

9.2 Mendelian genetics in man-family study, single factor, multifactor, lethal, sub-lethal and polygenic inheritance in man.
Official Syllabus: Paper I, Unit 9.2
Why can two brown-eyed parents have a blue-eyed child, and why does haemophilia appear in sons but pass through daughters? Mendelian genetics answers such questions with a few simple rules about how genes pass from parents to children. This unit applies those rules to human beings, who cannot be crossed in experiments, through the study of families. The physical basis of the gene (DNA, chromosomes, meiosis and mutation) is in Unit 1.7: in brief, a gene is a stretch of DNA on a chromosome, and meiosis gives each sperm or egg one copy of every chromosome pair. The methods of human genetics (twins, adoption, karyotypes, DNA tests) are in Unit 9.1, and the behaviour of genes in whole populations is in Unit 9.3.
1. Mendel’s Principles and Why They Apply to Man
In simple words
Mendel showed that parents pass on separate “units” (now called genes), one from each parent, which do not blend. Each child receives one of the two copies a parent carries, chosen by chance. These rules hold for humans too, but scientists must read them from family records instead of planned crosses.
1.1 Mendel’s experiments
Gregor Johann Mendel, an Augustinian friar of Brünn (now Brno, Czech Republic), crossed varieties of the garden pea (Pisum sativum) between 1856 and 1863. He read his results in 1865 and published them in 1866. His method was new in three ways, which explain why he succeeded where earlier plant breeders had failed:
- One trait at a time. Earlier hybridists looked at the whole plant; Mendel followed seven contrasting pairs (tall/dwarf stem, round/wrinkled seed, yellow/green seed, purple/white flower, inflated/constricted pod, green/yellow pod, axial/terminal flower).
- Pure lines first. He self-fertilised each variety for generations until it bred true, so he knew the starting genotypes.
- Counting. He counted thousands of offspring and treated the results as ratios, which revealed the hidden rules.
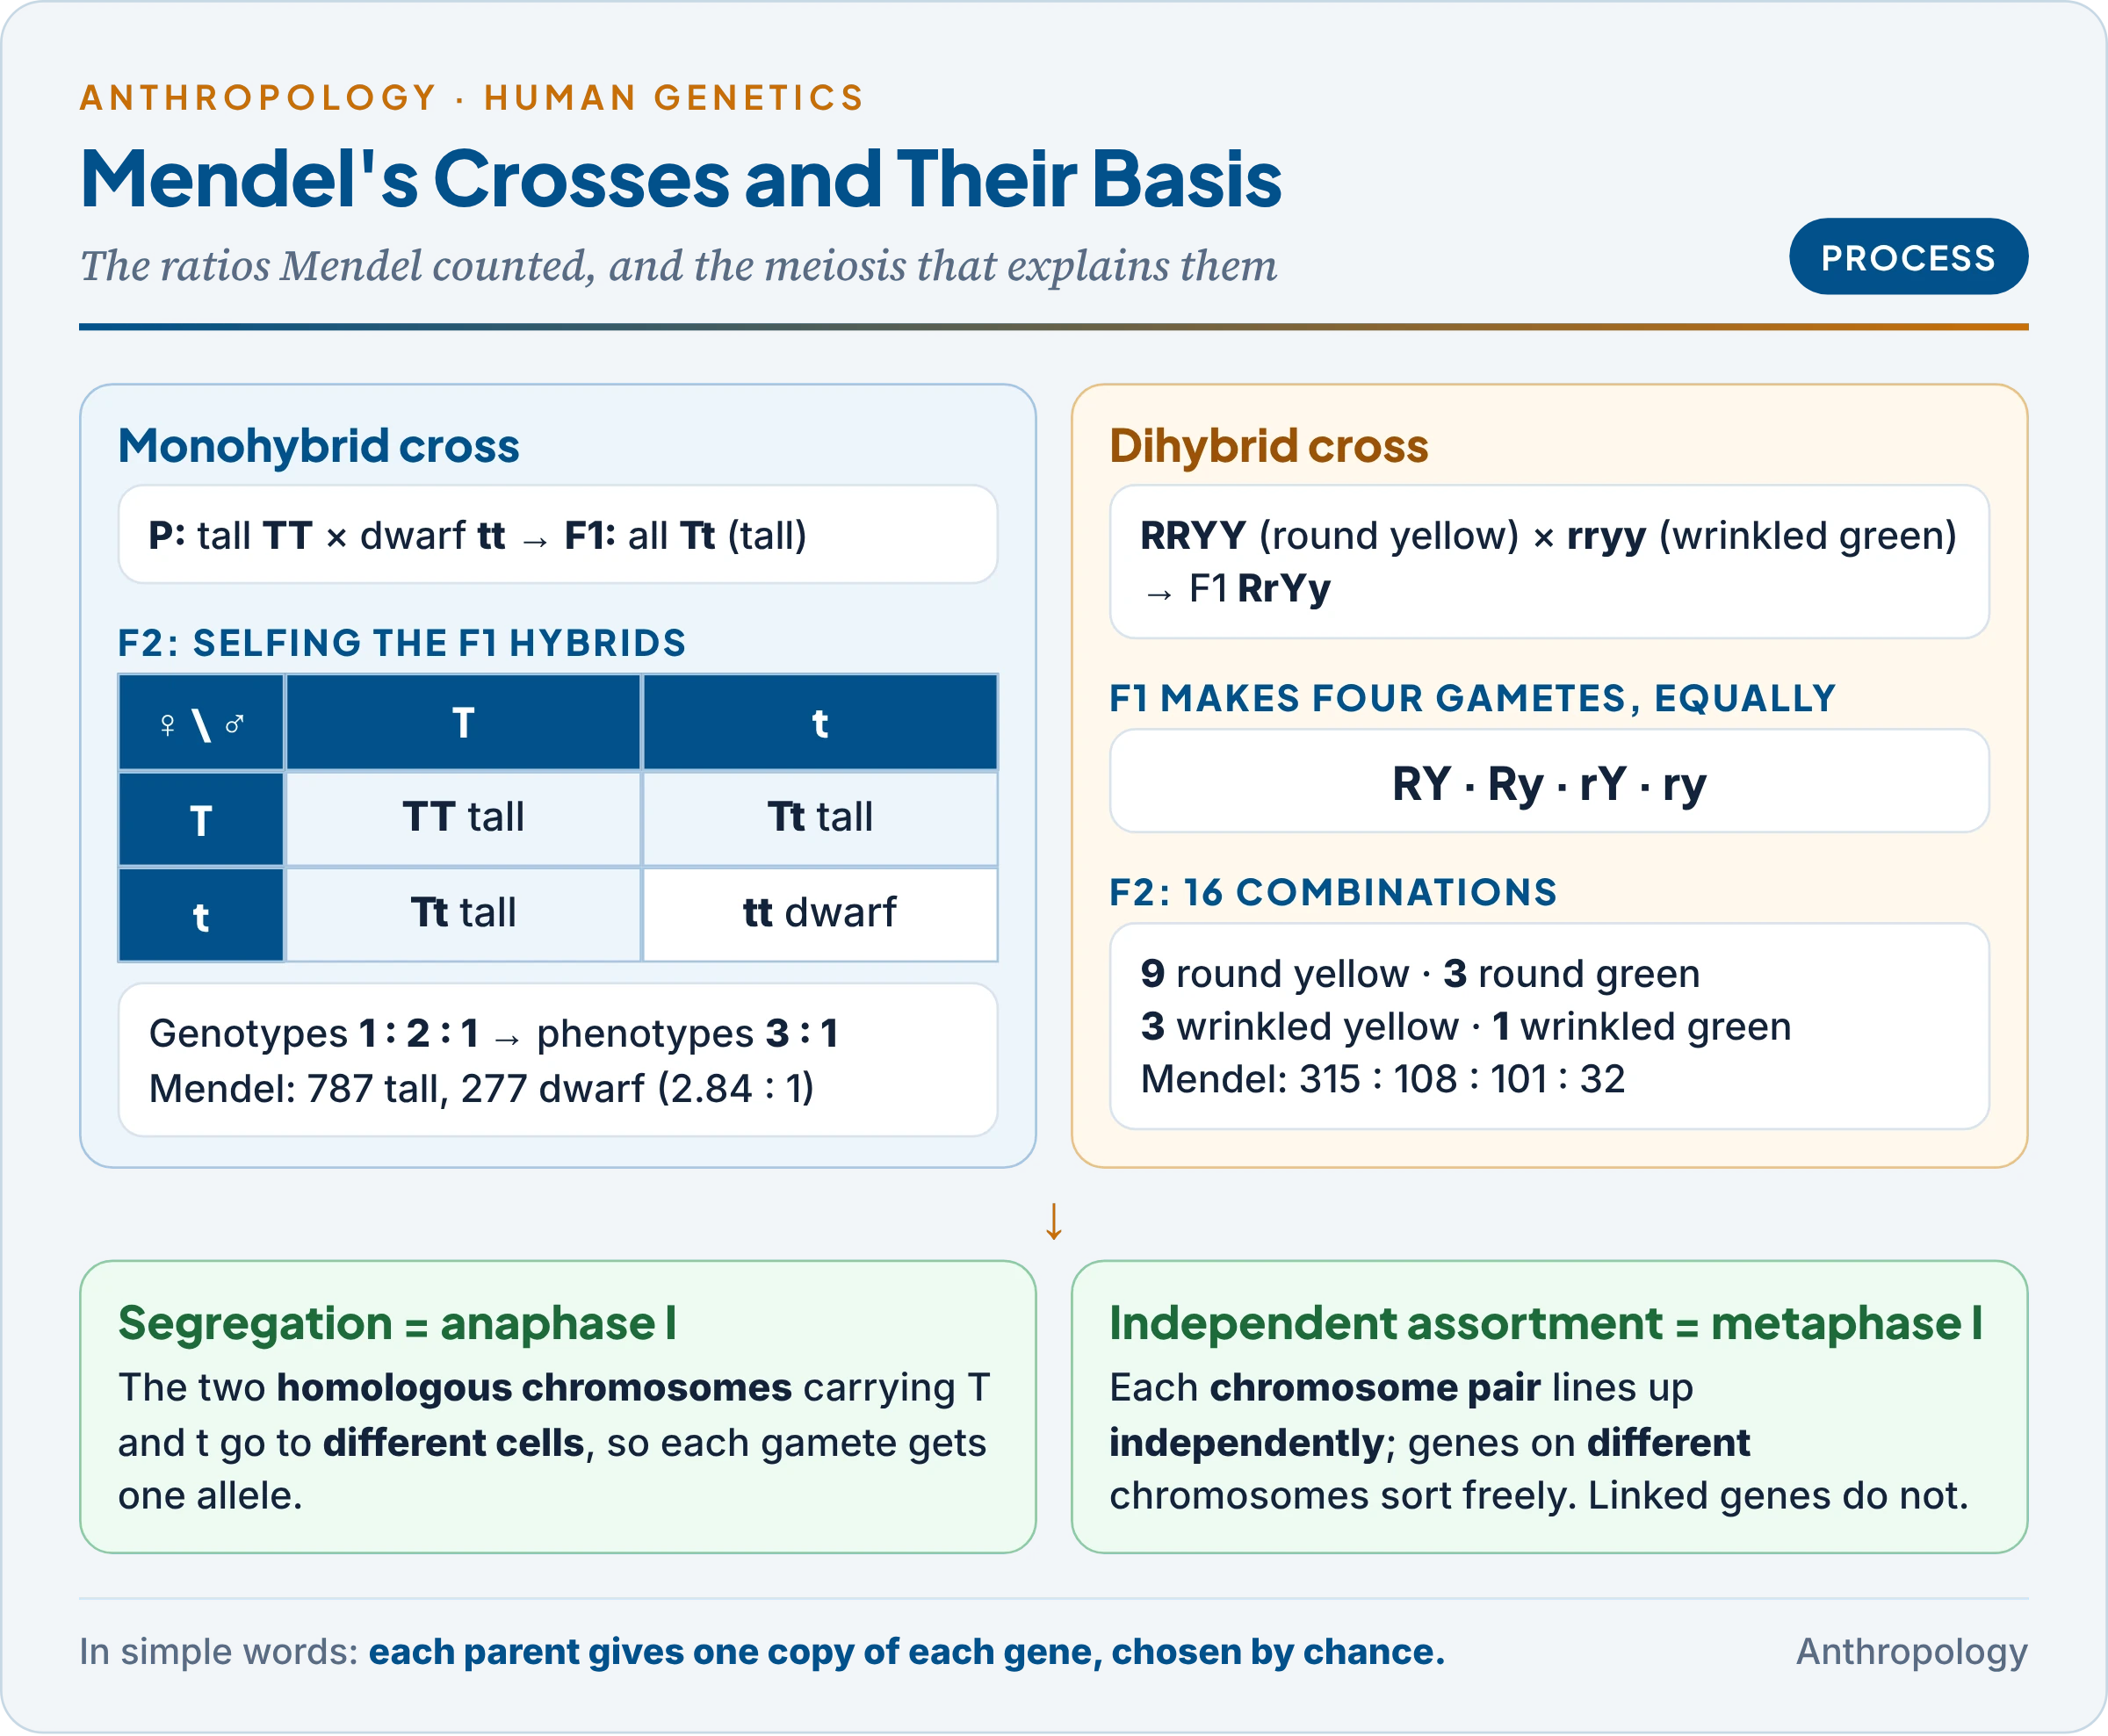
The monohybrid cross. Pure tall (TT) × pure dwarf (tt) gave an F1 (first filial generation) that was all tall (Tt). Selfing the F1 gave an F2 of 3 tall : 1 dwarf, for example 787 tall to 277 dwarf (2.84 : 1). The dwarf trait had hidden, not vanished. When he selfed the F2 tall plants, one-third bred true and two-thirds again gave 3 : 1, which showed that the F2 ratio is really 1 TT : 2 Tt : 1 tt.
The dihybrid cross. Round yellow (RRYY) × wrinkled green (rryy) gave all round yellow in F1 and 9 : 3 : 3 : 1 in F2 (315 round yellow, 108 round green, 101 wrinkled yellow, 32 wrinkled green). Each pair still gave 3 : 1 (12 : 4), so the two traits were inherited independently; a trihybrid cross extends the pattern to 27 : 9 : 9 : 9 : 3 : 3 : 3 : 1.
The test cross. Crossing a dominant-looking individual with a recessive homozygote reveals its genotype: TT × tt gives all tall, Tt × tt gives 1 tall : 1 dwarf.
1.2 The laws and their chromosomal basis
Mendel himself wrote no “laws”; the botanist Carl Correns, one of three scientists who rediscovered his paper in 1900 (with Hugo de Vries and Erich von Tschermak), stated his findings as rules. The English biologist William Bateson championed them and coined the word genetics (1905).
| Principle | Statement in simple words | Why it happens (chromosomal basis) |
|---|---|---|
| Unit characters | Each trait is controlled by a pair of factors (genes), one from each parent | Chromosomes come in homologous pairs |
| Dominance | In a hybrid, one form (dominant) masks the other (recessive) | The dominant allele’s product is enough for the trait |
| Segregation (purity of gametes) | The two factors separate in gamete formation; each gamete carries one | Homologous chromosomes go to different cells at anaphase I of meiosis |
| Independent assortment | Factors for different traits are distributed independently | Different chromosome pairs line up and separate independently at metaphase I |
The table shows that each “law” is a description of meiosis, which was why the American Walter Sutton and the German Theodor Boveri (1902–03) could propose that genes lie on chromosomes. It also shows the limits. Dominance is not universal (§4), and independent assortment fails for genes that lie close together on one chromosome, which tend to be inherited together (linkage). Segregation is the one law that holds almost without exception.
1.3 From peas to people
Common confusion
Are Mendel’s laws “equally applicable” to humans and to experimental organisms? The rules of transmission are the same, because human meiosis works exactly as in peas. What differs is the method: human geneticists cannot arrange crosses, wait for many generations or count hundreds of offspring per couple, so they read the same rules from pedigrees, family data and population frequencies.
Applying Mendel to man raised four practical difficulties: no controlled matings (marriage is governed by culture), long generations and small families (so a 3 : 1 ratio rarely appears in one family), few single-gene traits among visible human differences, and the influence of environment and culture on almost every phenotype (the observable trait).
The solutions became the core methods of human genetics:
- Family study and pedigree analysis: tracing a trait across generations (§2).
- Pooling many families and correcting for how they were found (ascertainment: families come to notice only because an affected child exists).
- Population data: allele frequencies through the Hardy–Weinberg law (Unit 9.3).
- Biochemical and molecular markers: blood groups, enzymes, DNA (Unit 9.1).
The first human cases. In 1902 the English physician Archibald Garrod, advised by Bateson, showed that alkaptonuria (urine that turns black) ran in families like a Mendelian recessive, often in children of first-cousin marriages. In 1905 the American anthropologist William Farabee traced brachydactyly (short fingers) through five generations as the first autosomal dominant trait in man. Human genetics thus began with family studies of rare traits.
2. Family Study and Pedigree Analysis
In simple words
A pedigree is a family tree drawn with standard symbols to show who has a trait. Reading where the trait appears (in every generation or skipping generations, in men only or both sexes) tells us how it is inherited. It is the human substitute for Mendel’s planned crosses.
Family study collects information on a trait in the relatives of an affected person, called the proband (or propositus): the person through whom the family came to notice. The data are drawn as a pedigree chart. The method is described in Unit 9.1; here it is the tool for reading Mendelian patterns.
Standard pedigree symbols (as recommended by the National Society of Genetic Counselors, 1995, revised 2008 and 2022):
| Symbol | Meaning |
|---|---|
| Square □ / circle ○ | Male / female (◇ diamond: sex unknown or not stated) |
| Filled symbol | Affected individual |
| Half-filled, or dot in the centre | Heterozygous carrier (a dot is used for an X-linked carrier female) |
| Diagonal slash | Deceased |
| Arrow | Proband |
| Horizontal line between partners | Marriage or mating; double line = consanguineous mating |
| Vertical line from the couple | Line of descent to the sibship |
| Horizontal sibship line | Brothers and sisters, oldest on the left |
| Roman numerals / Arabic numerals | Generations (I, II, III) / individuals within a generation |
How to read a pedigree. Ask five questions in order:
- Does the trait appear in every generation (dominant) or skip generations (recessive)?
- Are both sexes affected about equally (autosomal), or mainly males (X-linked)?
- Is there male-to-male transmission? If yes, the gene cannot be on the X chromosome, since a father gives his son his Y.
- Do unaffected parents have affected children? Then the trait is recessive and both parents are carriers.
- Is there a consanguineous (double-line) marriage? It raises the suspicion of a rare recessive.
3. Single-Factor (Monogenic) Inheritance
In simple words
Single-factor traits are controlled by one gene. The gene may sit on an ordinary chromosome (autosome) or on the X or Y sex chromosome, and its effect may be dominant or recessive. These five combinations give five recognisable family patterns.
An example first. In a village in central India, two healthy parents have four children, one of whom has sickle-cell anaemia. Neither parent is ill, yet both must carry the gene, because the child has two copies. This is the classic autosomal recessive pattern: the trait skips the parents and appears among siblings. The opposite pattern is Huntington’s disease, in which an affected parent has affected children in every generation. Single-factor inheritance is the reading of such patterns.
3.1 Autosomal dominant
- One copy of the allele (Aa) produces the trait; most affected people are heterozygotes.
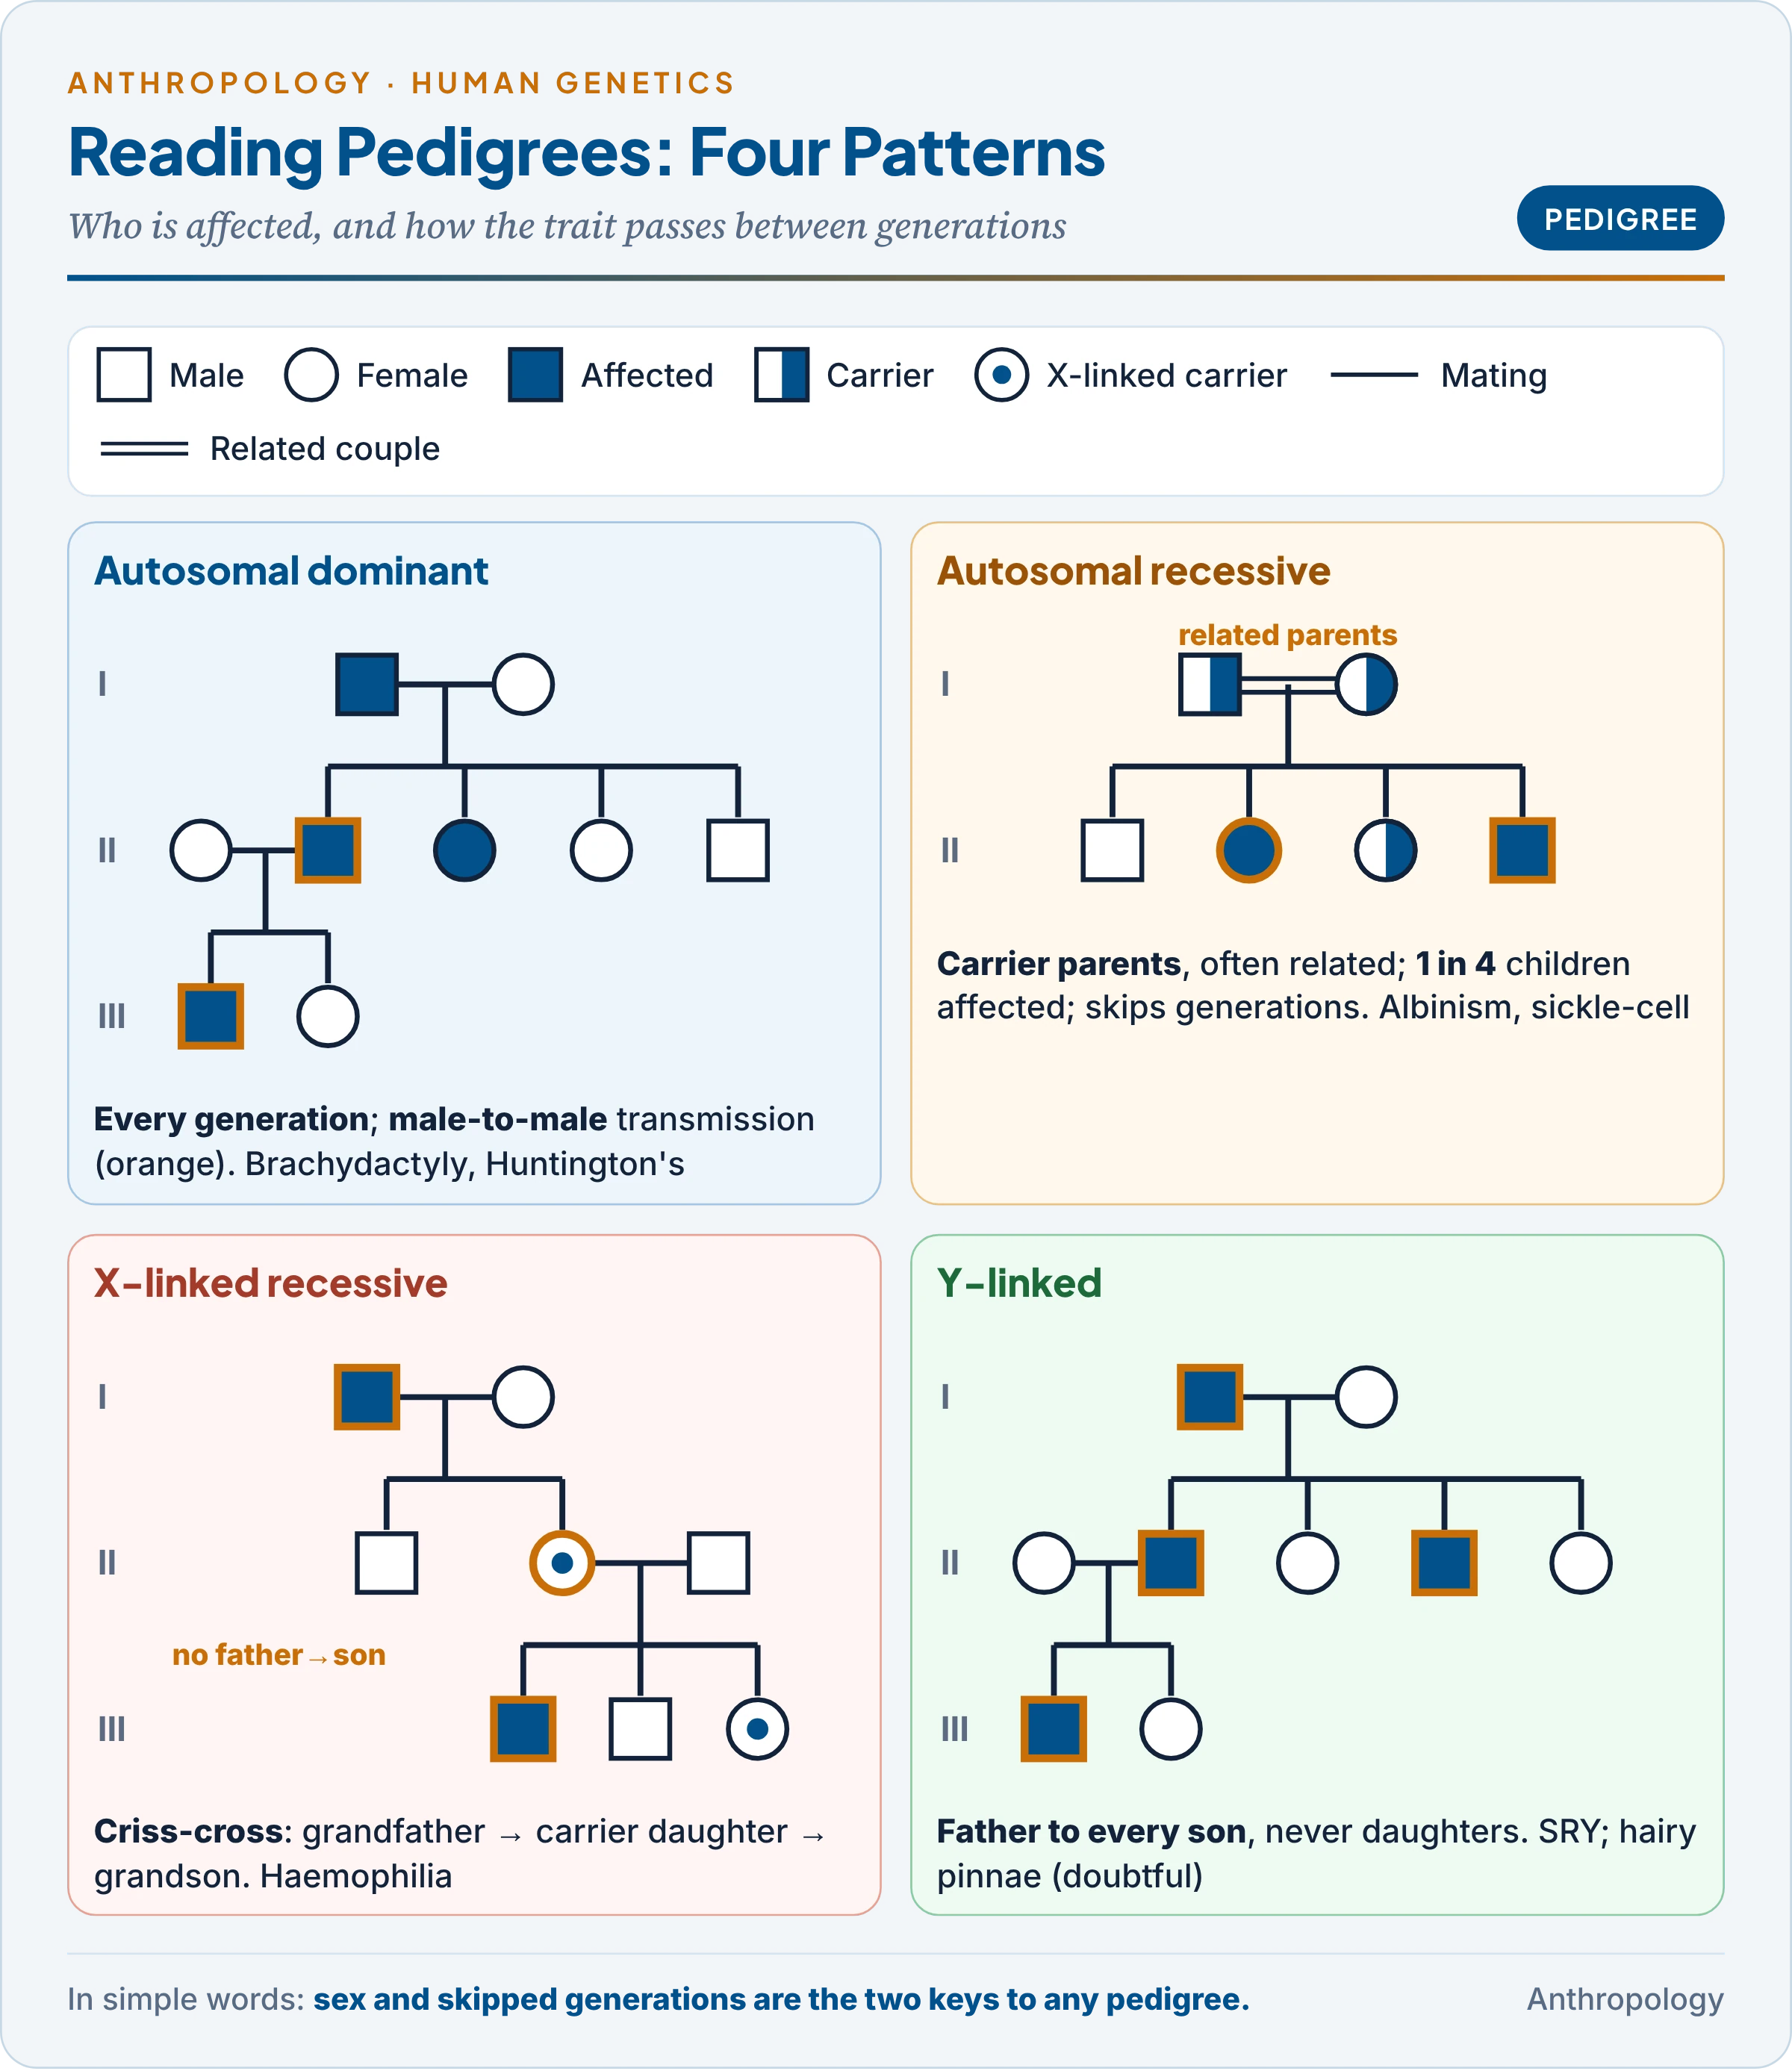
- Pattern: vertical transmission through every generation; both sexes affected and both transmit; male-to-male transmission occurs; an affected heterozygote × normal spouse gives 50 per cent affected children.
- Examples: brachydactyly; polydactyly (extra fingers, with incomplete penetrance, §4.4); achondroplasia (short-limbed dwarfism; about 80 per cent of cases are new mutations in children of average-height parents); Huntington’s disease (onset usually after 35–40 years); Marfan syndrome; familial hypercholesterolaemia.
- Why dominant disorders are often mild or late: a severe dominant disease that kills before reproduction survives only by new mutation (§5).
3.2 Autosomal recessive
- The trait appears only in homozygotes (aa); heterozygotes (Aa) are carriers, usually healthy.
- Pattern: horizontal: appears among siblings, often with normal parents; skips generations; both sexes affected equally; carrier × carrier gives 25 per cent affected, 50 per cent carriers, 25 per cent free; consanguinity is common among the parents.
- Examples:
- Albinism (oculocutaneous): absence of melanin pigment because the enzyme tyrosinase is missing.
- Inability to taste PTC (phenylthiocarbamide, a bitter compound discovered by Arthur Fox, 1931). Tasting is dominant; non-tasters are homozygous for recessive alleles of the bitter-taste receptor gene TAS2R38 on chromosome 7 (Kim and colleagues, 2003). About 70 per cent of most populations are tasters, and the proportion varies widely between groups, which made PTC a favourite anthropogenetic marker.
- Sickle-cell anaemia (HbSS) and β-thalassaemia major, the two commonest serious single-gene disorders in India.
- Phenylketonuria (PKU), Tay-Sachs disease, cystic fibrosis.
- Why recessive disorders persist: most copies of a rare recessive allele sit hidden in carriers, where selection cannot act on them (Unit 9.3).
3.3 X-linked recessive
- The gene is on the X chromosome. A male has one X (hemizygous), so one copy makes him affected; a female needs two.
- Pattern: mostly males affected; no father-to-son transmission; an affected man passes the gene to all his daughters (carriers), who pass it to half their sons: the criss-cross (zigzag) pattern, grandfather → daughter → grandson.
- Examples:
- Haemophilia A (factor VIII deficiency): carrier Queen Victoria passed it through her daughters to the royal houses of Spain and Russia.
- Red-green colour blindness: about 8 per cent of men of North European ancestry but under 1 per cent of women, because a woman must inherit two copies.
- Duchenne muscular dystrophy; G6PD deficiency (an enzyme defect of red cells, common in malarial regions).
3.4 X-linked dominant
- One copy is enough in either sex, so females are affected about twice as often (they have two X chromosomes to carry it).
- Pattern: an affected father passes the trait to all daughters and no sons; an affected mother to half her children of either sex.
- Example: vitamin D-resistant (hypophosphataemic) rickets.
3.5 Y-linked (holandric) inheritance
- Genes on the male-specific part of the Y chromosome pass from father to all sons and never to daughters.
- Established examples: SRY (sex-determining region of Y), which triggers testis development, and genes of the AZF (azoospermia factor) regions, whose deletion causes male infertility.
- Hypertrichosis of the ear rims (hairy pinnae) is the textbook example. It was studied in India by Krishna Dronamraju with J.B.S. Haldane (1962) and in West Bengal families by D.C. Rao (1970), whose data supported Y-linkage. But the American geneticist Curt Stern (1957) had shown that most early “Y-linked” pedigrees rested on hearsay, and the trait shows variable onset and incomplete penetrance. It is best cited as a classic but unproven case.
The table brings the five patterns together; the last column holds the single clue that most quickly identifies each.
| Pattern | Who is affected | Transmission | Human examples | Decisive clue |
|---|---|---|---|---|
| Autosomal dominant | Both sexes equally | Every generation; 50 per cent risk | Brachydactyly, Huntington’s, achondroplasia | Male-to-male transmission possible |
| Autosomal recessive | Both sexes equally | Skips generations; 25 per cent from two carriers | Albinism, PTC non-tasting, sickle-cell, PKU | Unaffected parents, often related |
| X-linked recessive | Mostly males | Criss-cross through carrier daughters | Haemophilia, colour blindness, DMD | No father-to-son transmission |
| X-linked dominant | Females about twice as often | Affected father → all daughters | Hypophosphataemic rickets | All daughters, no sons of affected man |
| Y-linked | Males only | Father → every son | SRY, AZF; hairy pinnae (doubtful) | Every son of an affected man |
The table shows that sex and generation-skipping are the two keys to any pedigree. Autosomal traits ignore sex; sex-linked traits do not. Dominant traits appear in every generation; recessive traits hide in carriers.
Common confusion
Does “dominant” mean common, or more likely to spread? No. Dominance describes only how an allele shows itself in a heterozygote. Dominant brachydactyly and Huntington’s disease are rare; recessive blood group O is the commonest ABO allele in most populations. Frequency depends on mutation, selection and drift (Unit 9.3), not on dominance.
4. Deviations from Simple Mendelian Ratios
In simple words
Mendel’s 3 : 1 ratio assumes one gene, two alleles and full dominance. Many human traits break one of these assumptions: both alleles may show, a gene may have more than two forms, one gene may mask another, or a gene may not always show itself. These are extensions of Mendel, not refutations.
4.1 Incomplete dominance and codominance
- Incomplete dominance: the heterozygote is intermediate. The classic plant case is the four-o’clock or snapdragon (red × white → pink, F2 1 red : 2 pink : 1 white). In man, familial hypercholesterolaemia heterozygotes have moderately raised cholesterol and homozygotes very high levels.
- Codominance: both alleles are fully expressed in the heterozygote. In the MN blood group, an MN person carries both M and N antigens; in the ABO system, Iᴬ Iᴮ gives group AB; in sickle-cell trait (HbAS), electrophoresis shows both HbA and HbS.
The difference matters: in incomplete dominance the phenotype is a blend of the two, while in codominance both products appear side by side. In both cases the F2 phenotypic ratio becomes 1 : 2 : 1 instead of 3 : 1, because every genotype can be recognised.
4.2 Multiple alleles: the ABO system
A gene may have more than two alleles in a population, though each person carries only two. The ABO blood groups, discovered by Karl Landsteiner in 1900, are controlled by one gene on chromosome 9 with three main alleles; the German mathematician Felix Bernstein showed in 1924 that a three-allele model fitted population data.
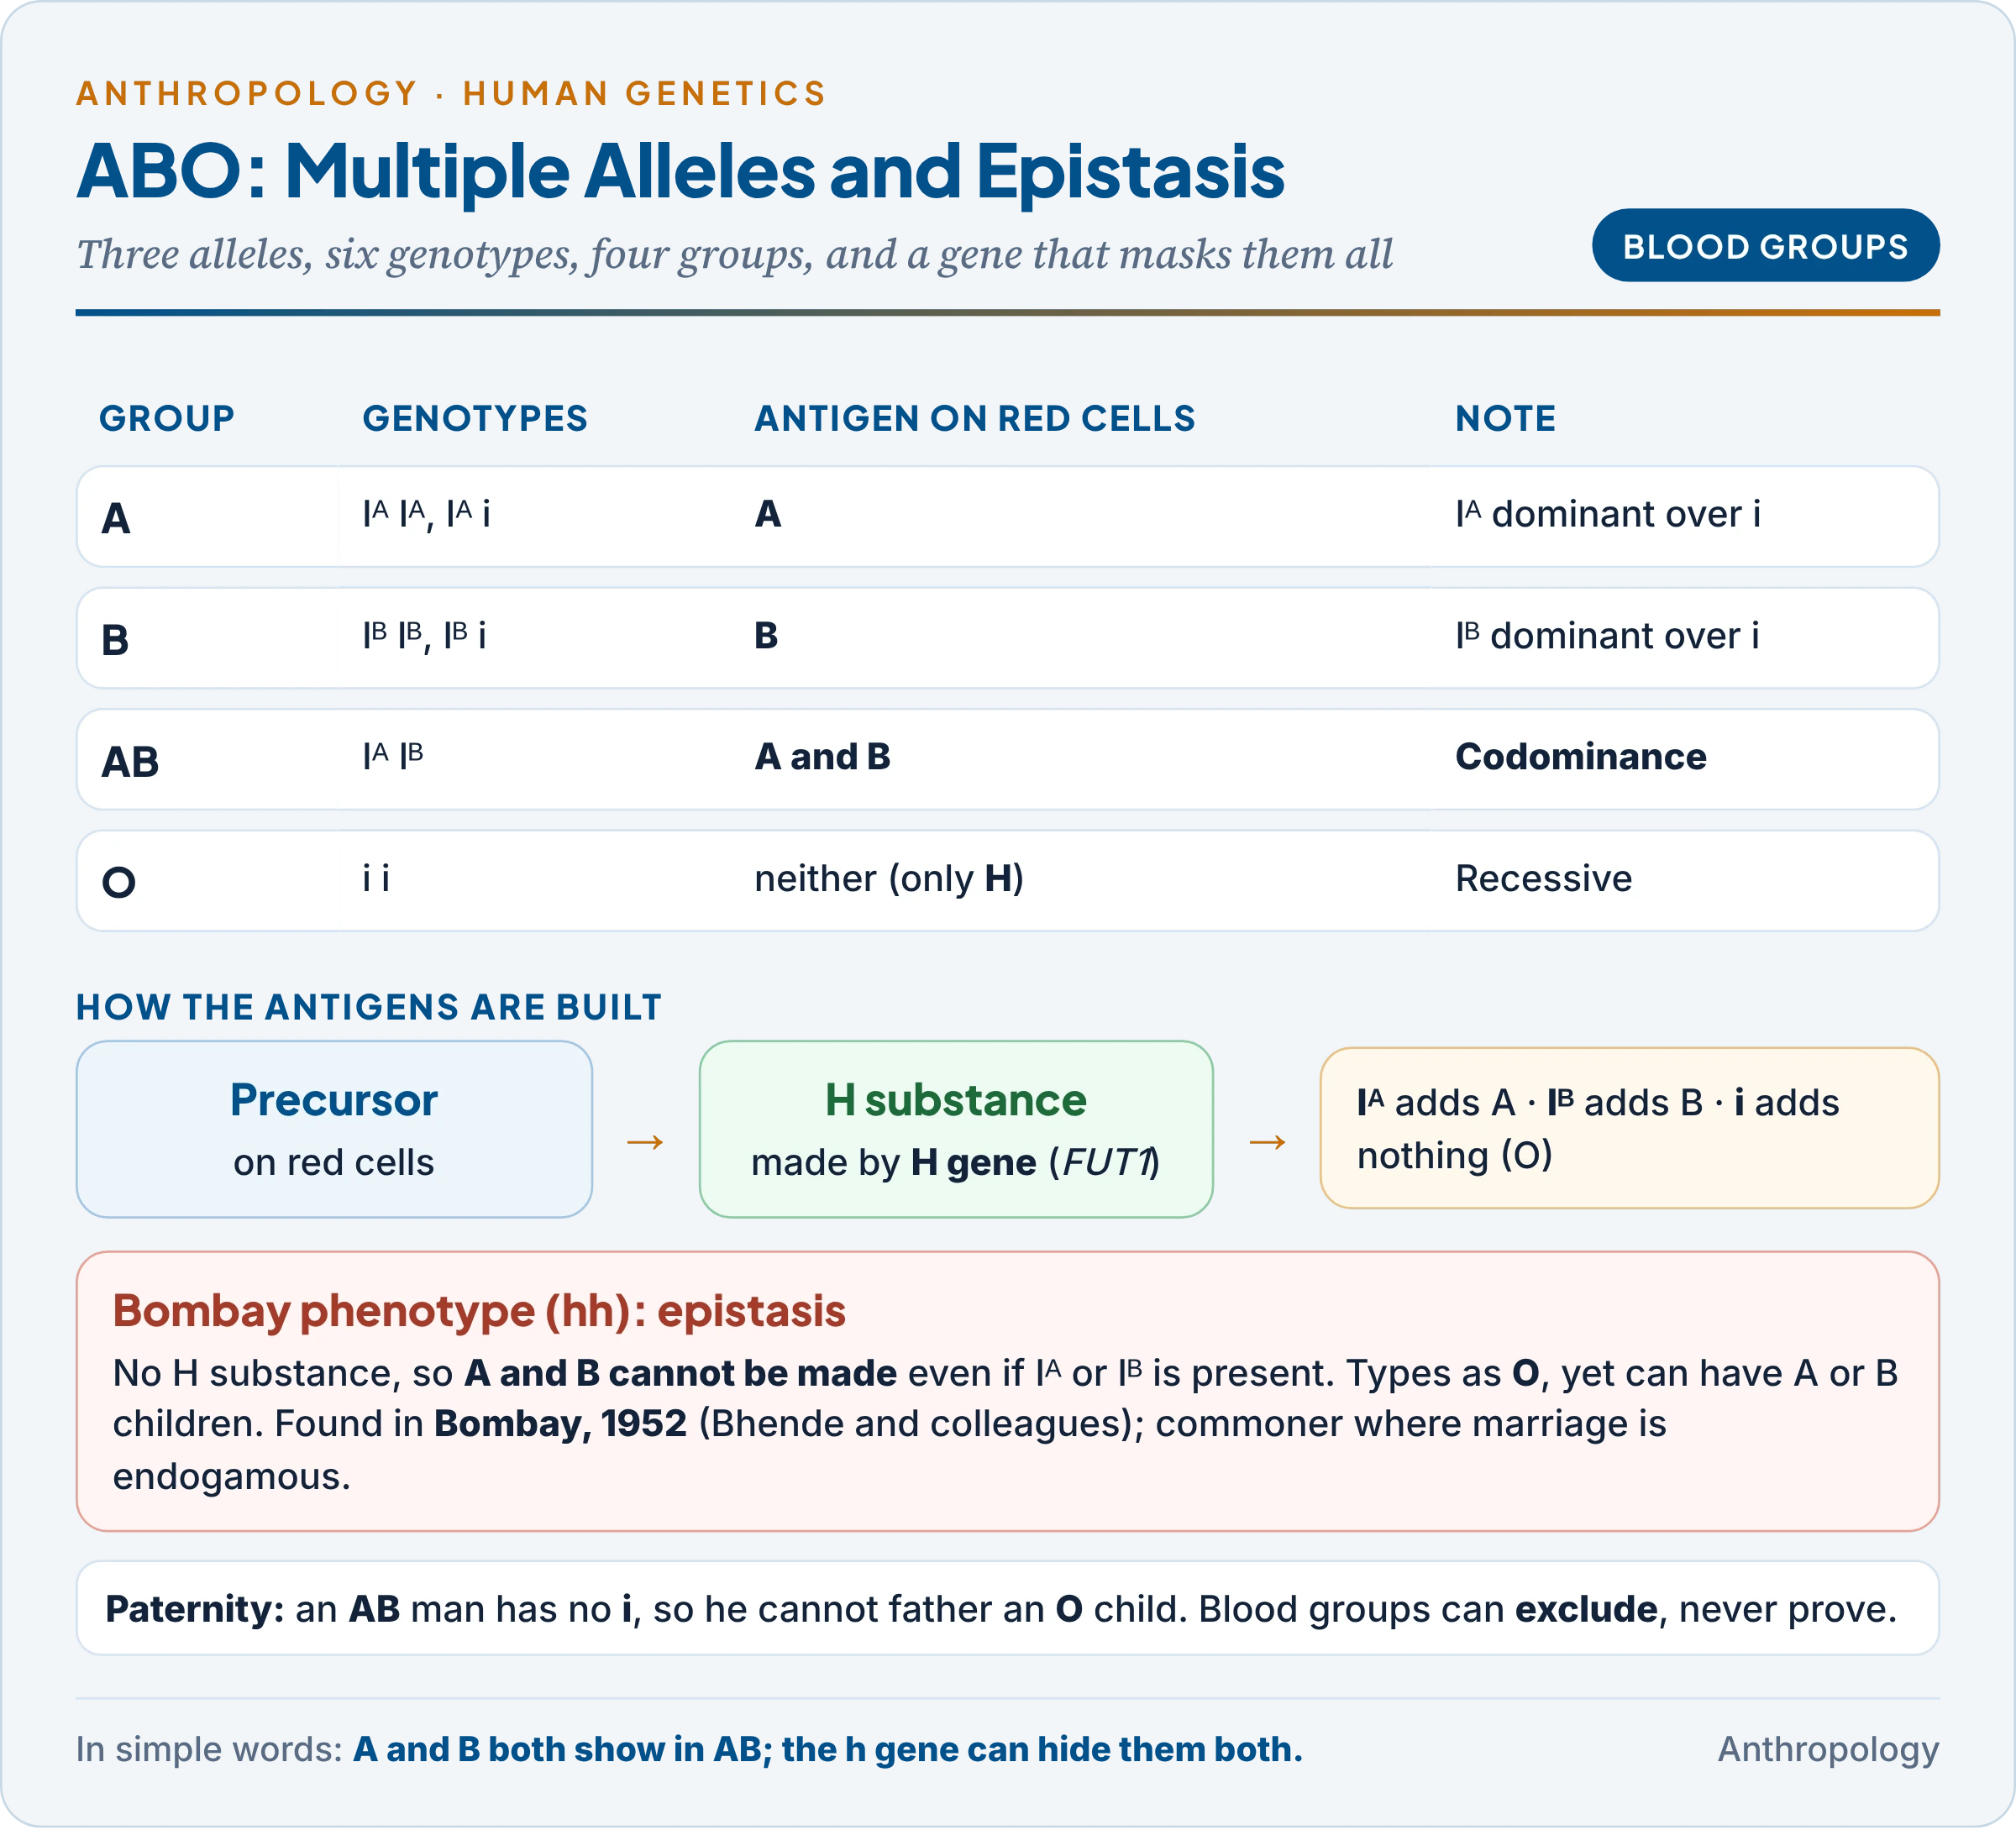
- Iᴬ and Iᴮ are codominant with each other and both dominant over i (O).
- Six genotypes give four phenotypes: A (Iᴬ Iᴬ, Iᴬ i), B (Iᴮ Iᴮ, Iᴮ i), AB (Iᴬ Iᴮ), O (ii).
- Use in paternity cases: genes can exclude a man as father but cannot prove paternity. An AB man cannot father an O child, because he has no i allele to give.
4.3 Epistasis: the Bombay phenotype
Epistasis means that one gene masks the effect of a different gene (not of its own allele, which is dominance). The best human case was found in Bombay in 1952 by Y.M. Bhende and colleagues. The A and B antigens are built on a precursor called H substance, made by the H gene (FUT1). People homozygous for the rare allele h (hh) make no H substance, so they cannot express A or B even if they carry Iᴬ or Iᴮ. They type as group O, yet may have children of group A or B. The Bombay phenotype is commoner in western India, partly because of endogamy and consanguinity.
4.4 Penetrance and expressivity
- Penetrance is the percentage of people with a genotype who show the trait at all. Huntington’s disease is nearly 100 per cent penetrant by old age; polydactyly and retinoblastoma (about 90 per cent) are incompletely penetrant, so a carrier parent may look normal while his child is affected. A pedigree then appears to “skip” a generation even though the gene is dominant.
- Expressivity is the degree to which the trait shows in those who have it. In neurofibromatosis type 1, one family member may have a few skin patches and another severe tumours; in polydactyly, one may have an extra finger on one hand, another on all four limbs.
- Why they arise: other genes, the environment and chance during development modify the gene’s effect.
4.5 Other departures
- Pleiotropy: one gene, many effects. The sickle-cell mutation causes anaemia, pain crises, organ damage and malaria resistance; the Marfan gene affects the eyes, heart and skeleton.
- Sex-limited and sex-influenced traits: genes on autosomes expressed differently by sex. Pattern baldness behaves as dominant in men and recessive in women because of male hormones; beard growth is sex-limited.
- Linkage: genes close together on one chromosome break independent assortment, as Bateson and Punnett first saw in sweet peas (1905) and Thomas Hunt Morgan explained in Drosophila (1910).
- Truly non-Mendelian inheritance (Unit 1.7): mitochondrial DNA passes only through the mother, and genomic imprinting makes a gene’s effect depend on which parent gave it.
5. Lethal and Sub-lethal Genes
In simple words
Some genes kill the person who carries them, usually before birth or in childhood. They are called lethal genes; genes that kill only some carriers or shorten life are sub-lethal. Recessive lethal genes survive for generations hidden in healthy carriers.
An example first. Two people with achondroplasia marry. Each is Aa. Their children are expected in the ratio 1 AA : 2 Aa : 1 aa, but AA babies have a severe skeletal form and die in infancy. Among the surviving children the ratio is 2 achondroplastic : 1 average height, not 3 : 1. The gene is dominant for its visible effect but recessive for lethality. A 2 : 1 ratio in place of 3 : 1 is the signature of a lethal gene; it was first seen in yellow mice by the French geneticist Lucien Cuénot (1905), a case explained in Unit 1.7.
Classification by effect on survival (with commonly used thresholds):
| Class | Effect on carriers of the relevant genotype | Human example |
|---|---|---|
| Lethal | Kill all (100 per cent) before reproductive age | Tay-Sachs disease; homozygous achondroplasia |
| Semi-lethal (sub-lethal) | Kill more than half (often stated as over 90 per cent) before maturity, or sharply shorten life | Untreated sickle-cell anaemia, thalassaemia major, haemophilia before modern treatment |
| Sub-vital | Reduce survival somewhat | Many mild metabolic variants |
| Vital | No effect on survival | Most polymorphic markers (blood groups, PTC) |
| Super-vital | Increase survival in some environment | HbAS (sickle-cell trait) where falciparum malaria is common |
The table shows that “lethal” is a graded idea: genes range from always fatal to beneficial, and the same allele (HbS) can be sub-lethal in homozygotes yet super-vital in heterozygotes. That double effect is the basis of balanced polymorphism (Unit 9.3).
Classification by dominance and conditions:
- Recessive lethals: fatal only in homozygotes; carriers are normal. They are the commonest kind and persist hidden in carriers. Example: Tay-Sachs disease (death in early childhood), frequent among Ashkenazi Jews through a founder effect.
- Dominant lethals: kill even heterozygotes, so the affected person leaves no children and the allele must arise afresh by mutation each time. Severe forms of tuberous sclerosis (formerly epiloia) were the textbook example; many patients are now known to be mildly affected and to reproduce, an instance of variable expressivity.
- Late-acting dominants: Huntington’s disease is not lethal in the strict sense because symptoms usually begin after children are born; it therefore escapes selection, which is why it persists.
- Dominant visible, recessive lethal: achondroplasia (above); also the human brachydactyly studied by Mohr and Wriedt in Norway (1919), whose homozygote died in infancy.
- Conditional lethals: lethal only in a particular environment.
- PKU: fatal brain damage on a normal diet, normal development on a low-phenylalanine diet from birth.
- Xeroderma pigmentosum: lethal skin cancers on exposure to sunlight.
- G6PD deficiency: dangerous haemolysis after eating fava beans or taking certain anti-malarial drugs.
- Gametic lethals: make sperm or eggs non-functional, producing segregation distortion (meiotic drive), well studied in mice and Drosophila.
Why lethal genes matter in anthropology:
- They make up much of a population’s genetic load, the burden of harmful alleles (Unit 9.3).
- They explain why consanguineous marriage raises child mortality: related parents are more likely to carry the same hidden recessive lethal (Unit 9.3).
- Medicine changes their class: transfusion and hydroxyurea turn once-lethal conditions into chronic ones, so more alleles pass on (relaxed selection).
A note on terms: many textbooks use sub-lethal and semi-lethal interchangeably for genes that kill some but not all carriers; the graded scale above, with an example for each class, avoids the confusion.
6. Multifactor and Polygenic Inheritance
In simple words
Traits such as height and skin colour do not fall into neat classes; people show every shade in between. Such traits are controlled by many genes, each adding a little, and by the environment. When plotted, they form a bell-shaped curve.
An example first. Among Indians, adult height ranges smoothly from about 140 cm to over 190 cm. No family shows “tall” and “dwarf” children in a 3 : 1 ratio; instead, children’s heights lie between and around their parents’, and the average height of Indians has changed within a few generations as nutrition improved. Height is therefore polygenic (many genes) and multifactorial (genes plus environment).
6.1 How Mendelism explained continuous variation
- The puzzle. The English scientist Francis Galton (Natural Inheritance, 1889), a cousin of Darwin, found that children of very tall parents are, on average, less extreme than their parents (regression to the mean). His followers, the biometricians (Karl Pearson, W.F.R. Weldon), held that such continuous traits could not be Mendelian, and quarrelled with Bateson‘s Mendelians for over a decade.
- The Swedish geneticist Herman Nilsson-Ehle (1909) showed in wheat that kernel colour was controlled by two or three gene pairs, each adding a little colour, which produced many shades.
- The English statistician R.A. Fisher (1918) proved mathematically that many Mendelian genes with small, additive effects, plus environment, produce the continuous, normal distribution and the correlations between relatives that Galton and Pearson had measured. This ended the quarrel and founded quantitative genetics.
6.2 Characteristics of polygenic traits
- Many genes, each with a small, additive effect: each “plus” allele adds a fixed amount.
- Continuous variation and a normal (bell-shaped) curve in the population.
- Strong environmental influence, which blurs the steps between classes; children cluster around the mid-parent value.
- Measured, not classified: studied with means, variances and heritability (the share of variation due to genes; estimation methods in Unit 9.1).
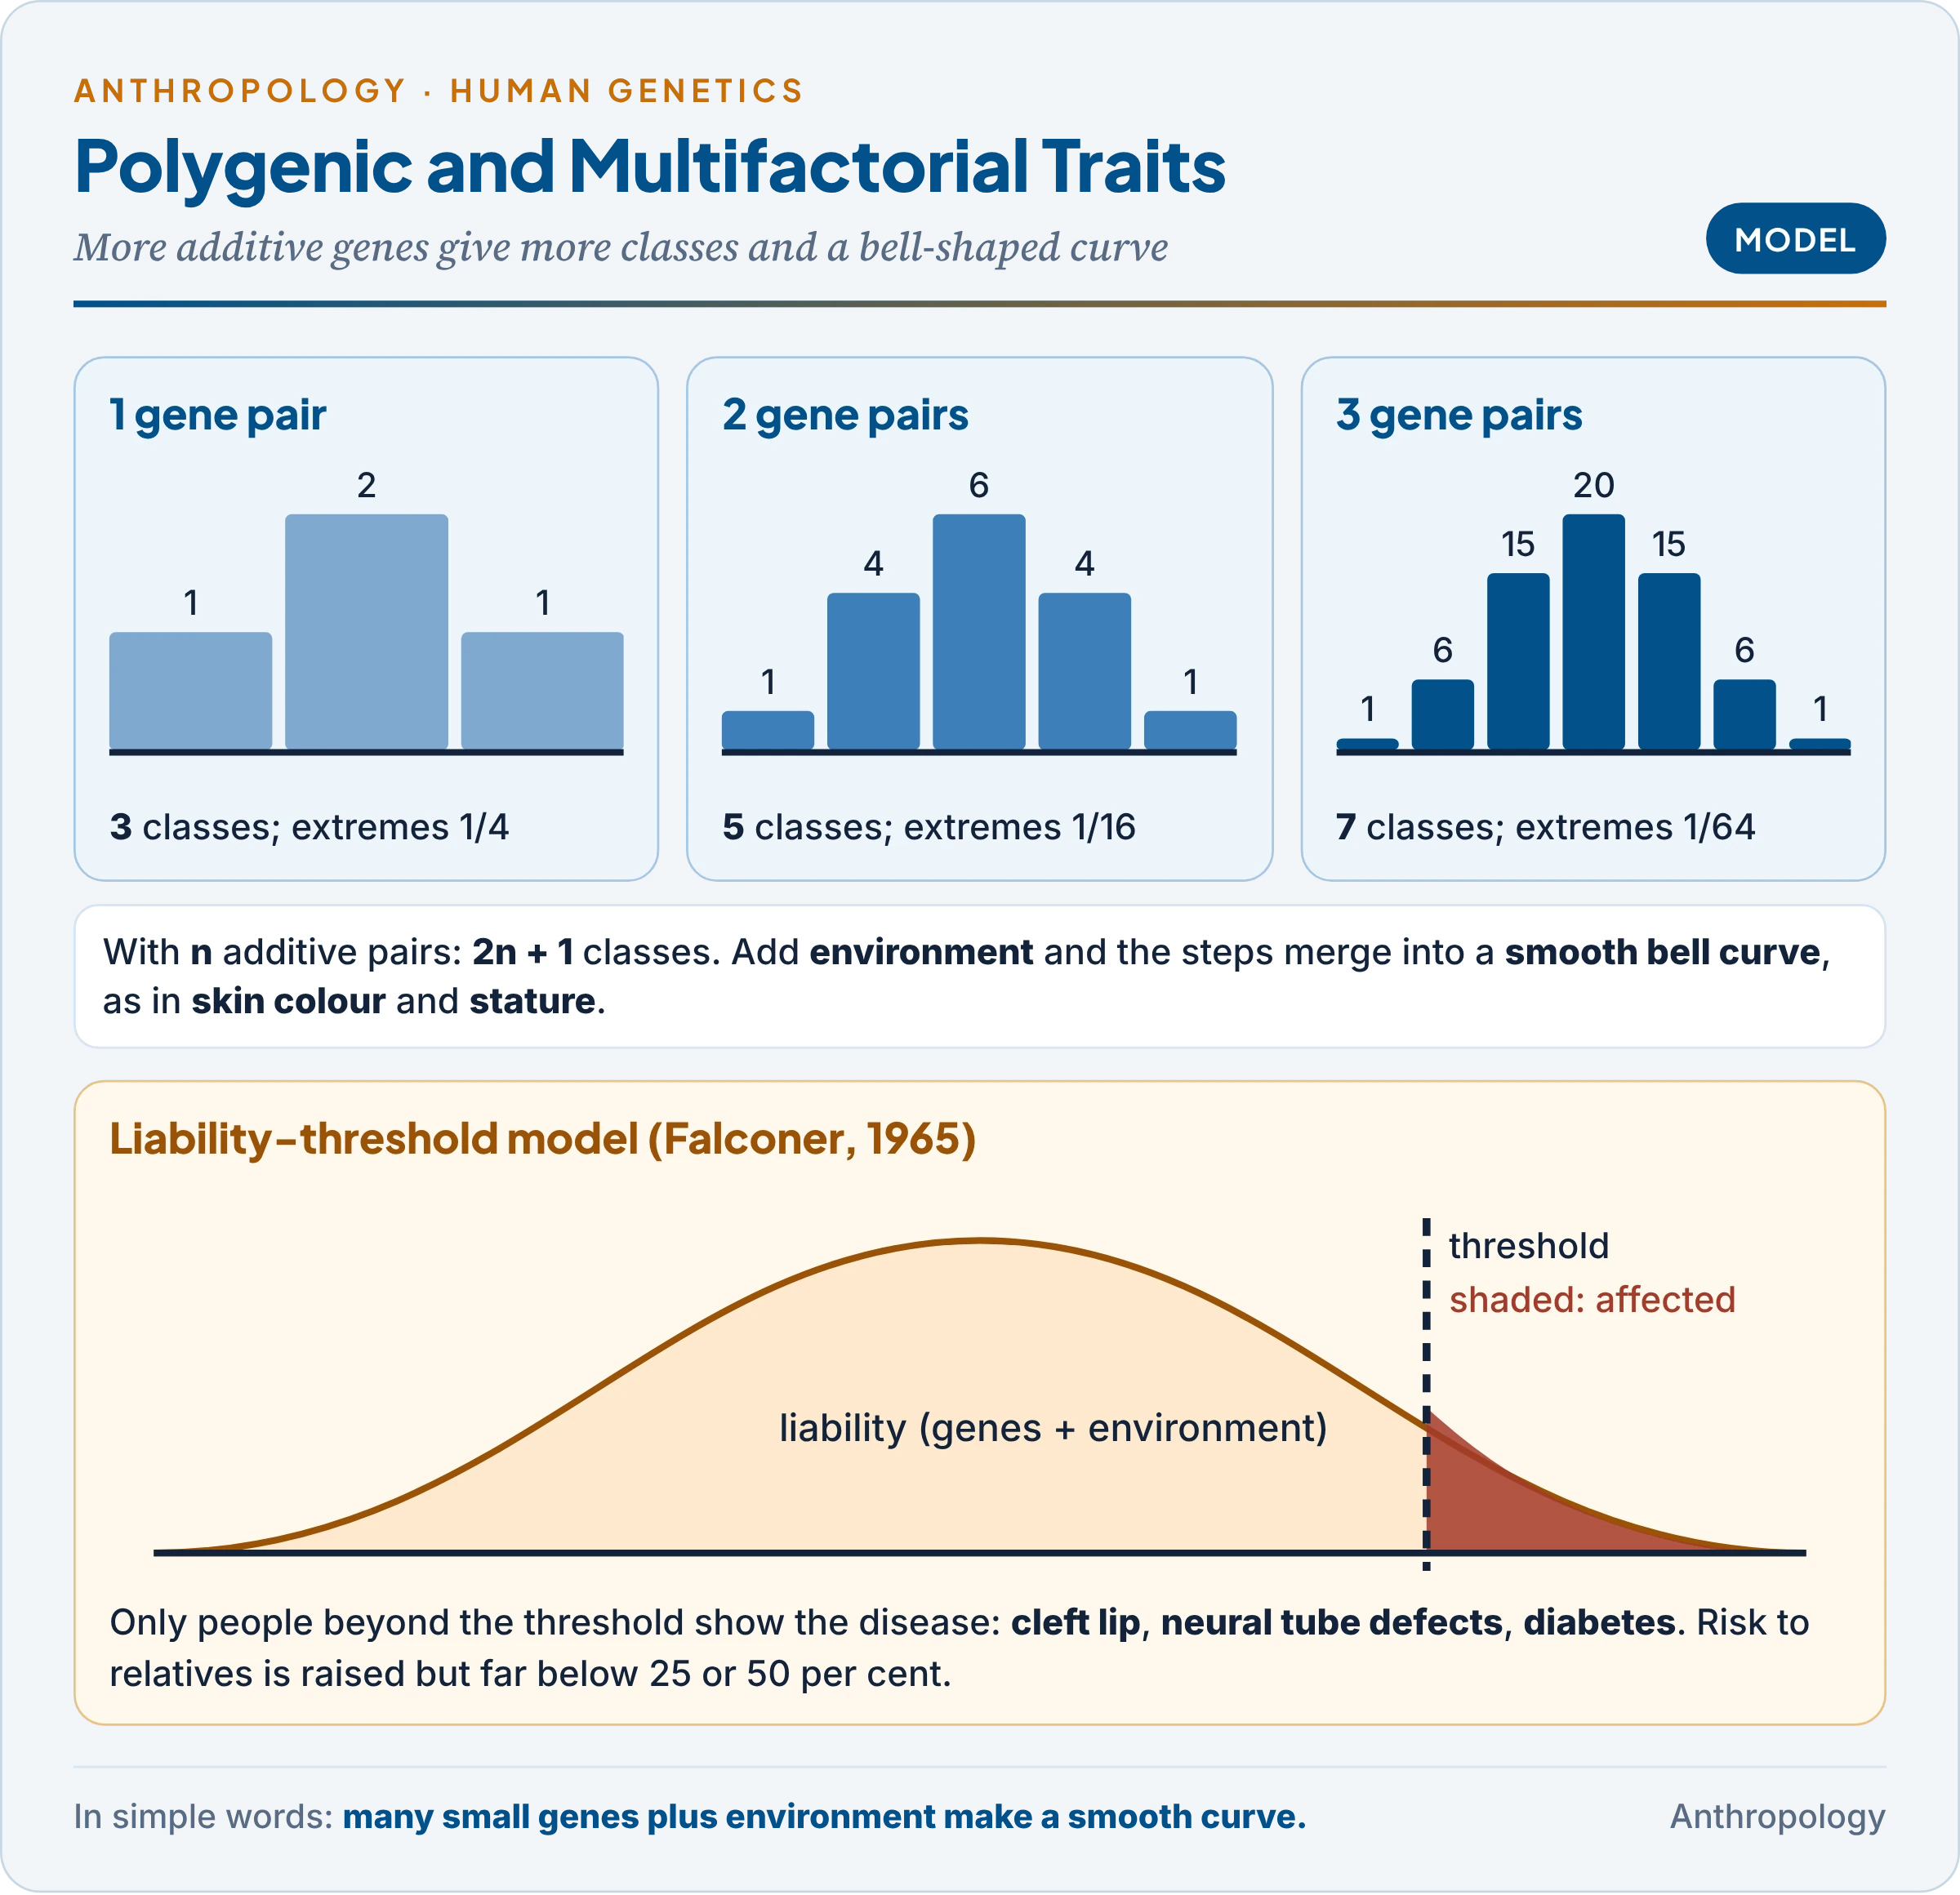
How many genes make a smooth curve? With n gene pairs, a cross of two heterozygotes gives 2n + 1 phenotypic classes, and each extreme appears in (1/4)ⁿ of offspring. One pair gives 3 classes; two pairs give 5 classes (1 : 4 : 6 : 4 : 1); three pairs give 7 classes (1 : 6 : 15 : 20 : 15 : 6 : 1). With environmental blurring, even three or four genes produce a curve that looks continuous.
6.3 Skin colour
- The classic model. The American eugenicist Charles Davenport and Gertrude Davenport (1910, 1913) studied families of mixed African and European descent in Jamaica and Bermuda and proposed two gene pairs with additive effects. Later workers, among them Curt Stern (1953), suggested three or four. Davenport’s eugenic conclusions are discredited, but his additive model became the textbook illustration.
- Modern evidence. Skin colour depends on the amount and kind of melanin and involves many genes (MC1R, OCA2, SLC45A2, TYR, MFSD12 and others). In India, a single variant of SLC24A5 (the “light-skin” allele rs1426654-A) explained about 27 per cent of skin-colour variation among 1,228 people of three agricultural castes of Andhra Pradesh; its frequency ranged from 0.03 to 1 across 54 Indian populations (Chandana Basu Mallick and colleagues, 2013). One gene can have a large effect, but most of the variation lies elsewhere.
- Why it matters: skin colour, long the main “racial” criterion, is a polygenic, environment-sensitive and selected trait (darker skin protects against ultraviolet radiation near the equator), so it is a poor guide to ancestry (Unit 9.5).
6.4 Stature
- Height has a heritability of about 0.8 in well-fed populations, yet depends heavily on nutrition and health in childhood (the secular trend, Unit 10).
- The largest genetic study (Loïc Yengo and colleagues, Nature, 2022), of 5.4 million people, found 12,111 independent DNA variants linked to height. Together they explain about 40 per cent of height variation in Europeans but only 10–20 per cent in other ancestries, which shows the European bias of genetic data.
- Why it matters: height is the clearest proof that a trait can be highly heritable and still change quickly with environment. Heritability describes variation within a population under given conditions, not fixed destiny.
6.5 Multifactorial threshold traits
Some multifactorial traits are either present or absent (a disease), although their causes are many. The liability-threshold model (the British geneticist Douglas Falconer, 1965) explains them:
- Every person has an underlying liability (risk), made of many genes and environmental factors and normally distributed.
- Only those whose liability crosses a threshold develop the condition.
- Examples: cleft lip and palate, neural tube defects, congenital heart disease, type 2 diabetes, hypertension, schizophrenia.
- Consequences: risk to relatives is higher than in the population but far below Mendelian 25 or 50 per cent (often 2–5 per cent for first-degree relatives), and it rises with each additional affected relative and with the severity of the case.
The table sets the three kinds of inheritance side by side. Notice how the number of genes, the shape of variation and the role of environment change together.
| Feature | Monogenic (single-factor) | Polygenic | Multifactorial |
|---|---|---|---|
| Genes | One locus, major effect | Many loci, small additive effects | Many genes plus environment |
| Variation | Discontinuous (classes) | Continuous (bell curve) | Continuous liability; threshold for disease |
| Environment | Little effect | Some effect | Large effect |
| Family pattern | Mendelian ratios (25, 50 per cent) | Children around mid-parent | Raised but low risk to relatives |
| Human examples | Albinism, PTC, ABO, haemophilia | Skin colour, stature, fingerprint ridge count | Cleft lip, diabetes, hypertension |
Monogenic traits make good genetic markers because each genotype can be read directly; polygenic and multifactorial traits explain most of human variation and most common diseases. The line between polygenic and multifactorial is thin, since almost every polygenic trait is also shaped by environment; the term multifactorial stresses that environment.
7. Mendelism in Human Populations: Uses and Limits
In simple words
Mendel’s rules help doctors predict risks for families, help courts settle disputes and help anthropologists map variation between communities. But most human traits involve many genes and the environment, so single-gene thinking explains only part of human diversity.
7.1 Uses
- Genetic counselling and risk prediction: calculating the chance that a child will be affected (Worked Examples) and advising carriers; India’s sickle-cell mission gives counselling cards to carriers to guide marriage choices (Unit 9.3).
- Medico-legal uses: disputed paternity and identification, first with ABO and other blood groups, now with DNA profiling (Unit 12).
- Medicine: prevention of Rh haemolytic disease of the newborn (erythroblastosis fetalis: an Rh-negative mother carrying an Rh-positive baby); newborn screening for treatable disorders such as PKU and congenital hypothyroidism.
- Anthropology: single-gene traits such as ABO and Rh blood groups, PTC tasting, colour blindness, haemoglobin variants and G6PD deficiency became genetic markers for comparing Indian castes and tribes, surveyed widely by the Anthropological Survey of India and the Indian Statistical Institute; their frequencies are the raw material of Unit 9.3.
7.2 Limits and critique
- Few traits are truly Mendelian. Of the visible differences that once defined “races”, almost none follow simple ratios; even classroom examples such as tongue rolling, ear-lobe attachment and widow’s peak do not, since identical twins can differ for them.
- Gene and environment interact. PKU shows that even a “genetic” disease can be prevented by changing the environment.
- One gene can have many effects (pleiotropy), and one trait can have many genes, so “a gene for X” is usually a simplification.
- The eugenic misuse. Early Mendelians, including Davenport, used crude single-gene models for intelligence and “feeble-mindedness” to justify sterilisation and immigration laws in the United States and elsewhere. Eugenics is discredited both scientifically (complex traits are not single-gene traits) and ethically; it is a warning, not a contribution.
- The answer to the 1982 question: the principles apply to man exactly as to animals, but their study in man needs pedigrees, population data and molecular markers, and their interpretation must allow for culture, which decides who marries whom.
8. Worked Examples
In simple words
These examples apply Mendel’s rules to human families with real numbers. Each one can be redrawn in an answer in a few lines.
1. Albinism from two carriers. Two normally pigmented parents have an albino child, so both are Aa.
- Next child: 1/4 albino (aa), 1/2 carrier (Aa), 1/4 non-carrier (AA).
- A normal sibling of the albino child is a carrier with probability 2/3, not 1/2, because the aa class is already excluded (2 Aa out of 3 normal genotypes).
- Probability that the next two children are both normal: 3/4 × 3/4 = 9/16.
2. Exactly two affected in a family of four (carrier × carrier). Use the binomial rule: C(4,2) × (1/4)² × (3/4)² = 6 × 1/16 × 9/16 = 54/256 ≈ 0.21. Families of four with no affected child occur with probability (3/4)⁴ = 81/256 ≈ 0.32, which is why such families never come to notice (the ascertainment problem, §1.3).
3. Haemophilia from a carrier mother (X Xʰ × X Y).
- Sons: 1/2 affected (Xʰ Y), 1/2 normal.
- Daughters: 1/2 carriers (X Xʰ), 1/2 normal; none affected.
- For any child: 1/4 affected son, 1/4 carrier daughter.
4. A colour-blind father (Xᶜ Y × X X). All sons normal (they get his Y); all daughters carriers. If such a daughter marries a normal man, half her sons will be colour-blind: the criss-cross pattern.
5. ABO and paternity. Mother A, child O, alleged father AB. The child is ii, so it received i from each parent. The mother can be Iᴬ i; but an AB man (Iᴬ Iᴮ) has no i allele to give, so he is excluded. A man of group A, B or O could not be excluded by ABO alone. A cross of Iᴬ i × Iᴮ i gives 1/4 each of A, B, AB and O: all four groups from one couple.
6. Two traits at once. Both parents are heterozygous tasters (Tt) and albinism carriers (Aa).
- Non-taster: 1/4; albino: 1/4. Since the genes are on different chromosomes, the chance of a non-taster albino child is 1/4 × 1/4 = 1/16; of a taster with normal pigment, 3/4 × 3/4 = 9/16: Mendel’s 9 : 3 : 3 : 1.
7. A lethal gene changes the ratio. Achondroplastic parents (Aa × Aa): of conceptions, 1/4 AA (lethal), 1/2 Aa, 1/4 aa. Among live-born children, 2/3 are achondroplastic and 1/3 of average height: a 2 : 1 ratio.
8. Penetrance. An autosomal dominant with 80 per cent penetrance; affected heterozygote × normal spouse. Risk that a child inherits the allele = 1/2; risk that the child shows the trait = 1/2 × 0.8 = 0.40. An unaffected child may still carry it: 1/2 × 0.2 = 0.10 of all children are non-penetrant carriers.
9. Polygenic skin colour (two-gene model). AaBb × AaBb, each capital allele adding one unit of pigment.
| Number of pigment alleles | 4 | 3 | 2 | 1 | 0 |
|---|---|---|---|---|---|
| Fraction of children | 1/16 | 4/16 | 6/16 | 4/16 | 1/16 |
Only 1 child in 16 is as dark as the darkest grandparent type and 1 in 16 as light as the lightest; most children are intermediate. With three pairs, each extreme falls to 1/64, and the seven classes already approach a bell curve.
Key Terms
| Term | Meaning in simple words |
|---|---|
| Gene / allele | A unit of heredity / one of its alternative forms |
| Genotype / phenotype | The genes a person carries / the trait that shows |
| Homozygous / heterozygous | Two identical alleles / two different alleles |
| Dominant / recessive | An allele that shows in a heterozygote / one that is hidden there |
| Proband | The family member through whom a family comes to notice |
| Carrier | A heterozygote who carries a recessive allele without showing it |
| Hemizygous | Having only one copy of a gene, as males for X-linked genes |
| Criss-cross inheritance | X-linked passage from grandfather through daughter to grandson |
| Codominance | Both alleles fully shown in a heterozygote (AB, MN) |
| Multiple alleles | More than two alleles of one gene in a population (ABO) |
| Epistasis | One gene masking the effect of another gene |
| Penetrance / expressivity | Whether a genotype shows at all / how strongly it shows |
| Pleiotropy | One gene having several effects |
| Lethal / sub-lethal gene | A gene that kills all / some carriers before reproduction |
| Polygenic trait | A trait controlled by many genes with small additive effects |
| Multifactorial trait | A trait shaped by many genes and the environment |
| Liability threshold | The point of combined risk beyond which a disease appears |
Contemporary Developments
- India’s sickle-cell screening (September 2026): the National Sickle Cell Anaemia Elimination Mission (launched July 2023) had screened over 7.3 crore people in tribal areas, finding about 20.6 lakh carriers and 2.5 lakh people with the disease, the largest exercise in Mendelian carrier detection in the country (Ministry of Tribal Affairs).
- GenomeIndia (April 2025): whole genomes of 9,772 healthy Indians from 83 populations yielded about 180 million variants, most of them rare; the data allow carrier-frequency estimates for recessive disorders in specific communities (Nature Genetics).
- Height mapped (2022): a study of 5.4 million people found 12,111 variants linked to stature, close to the limit of what common variants can explain in Europeans, but far weaker in other ancestries (Yengo and colleagues, Nature).
- CRISPR for sickle-cell disease: the first gene-editing therapy (Casgevy) was approved in the United Kingdom and the United States in 2023; India’s BIRSA 101 followed in November 2025 (Unit 1.7).
Diagrams to Master
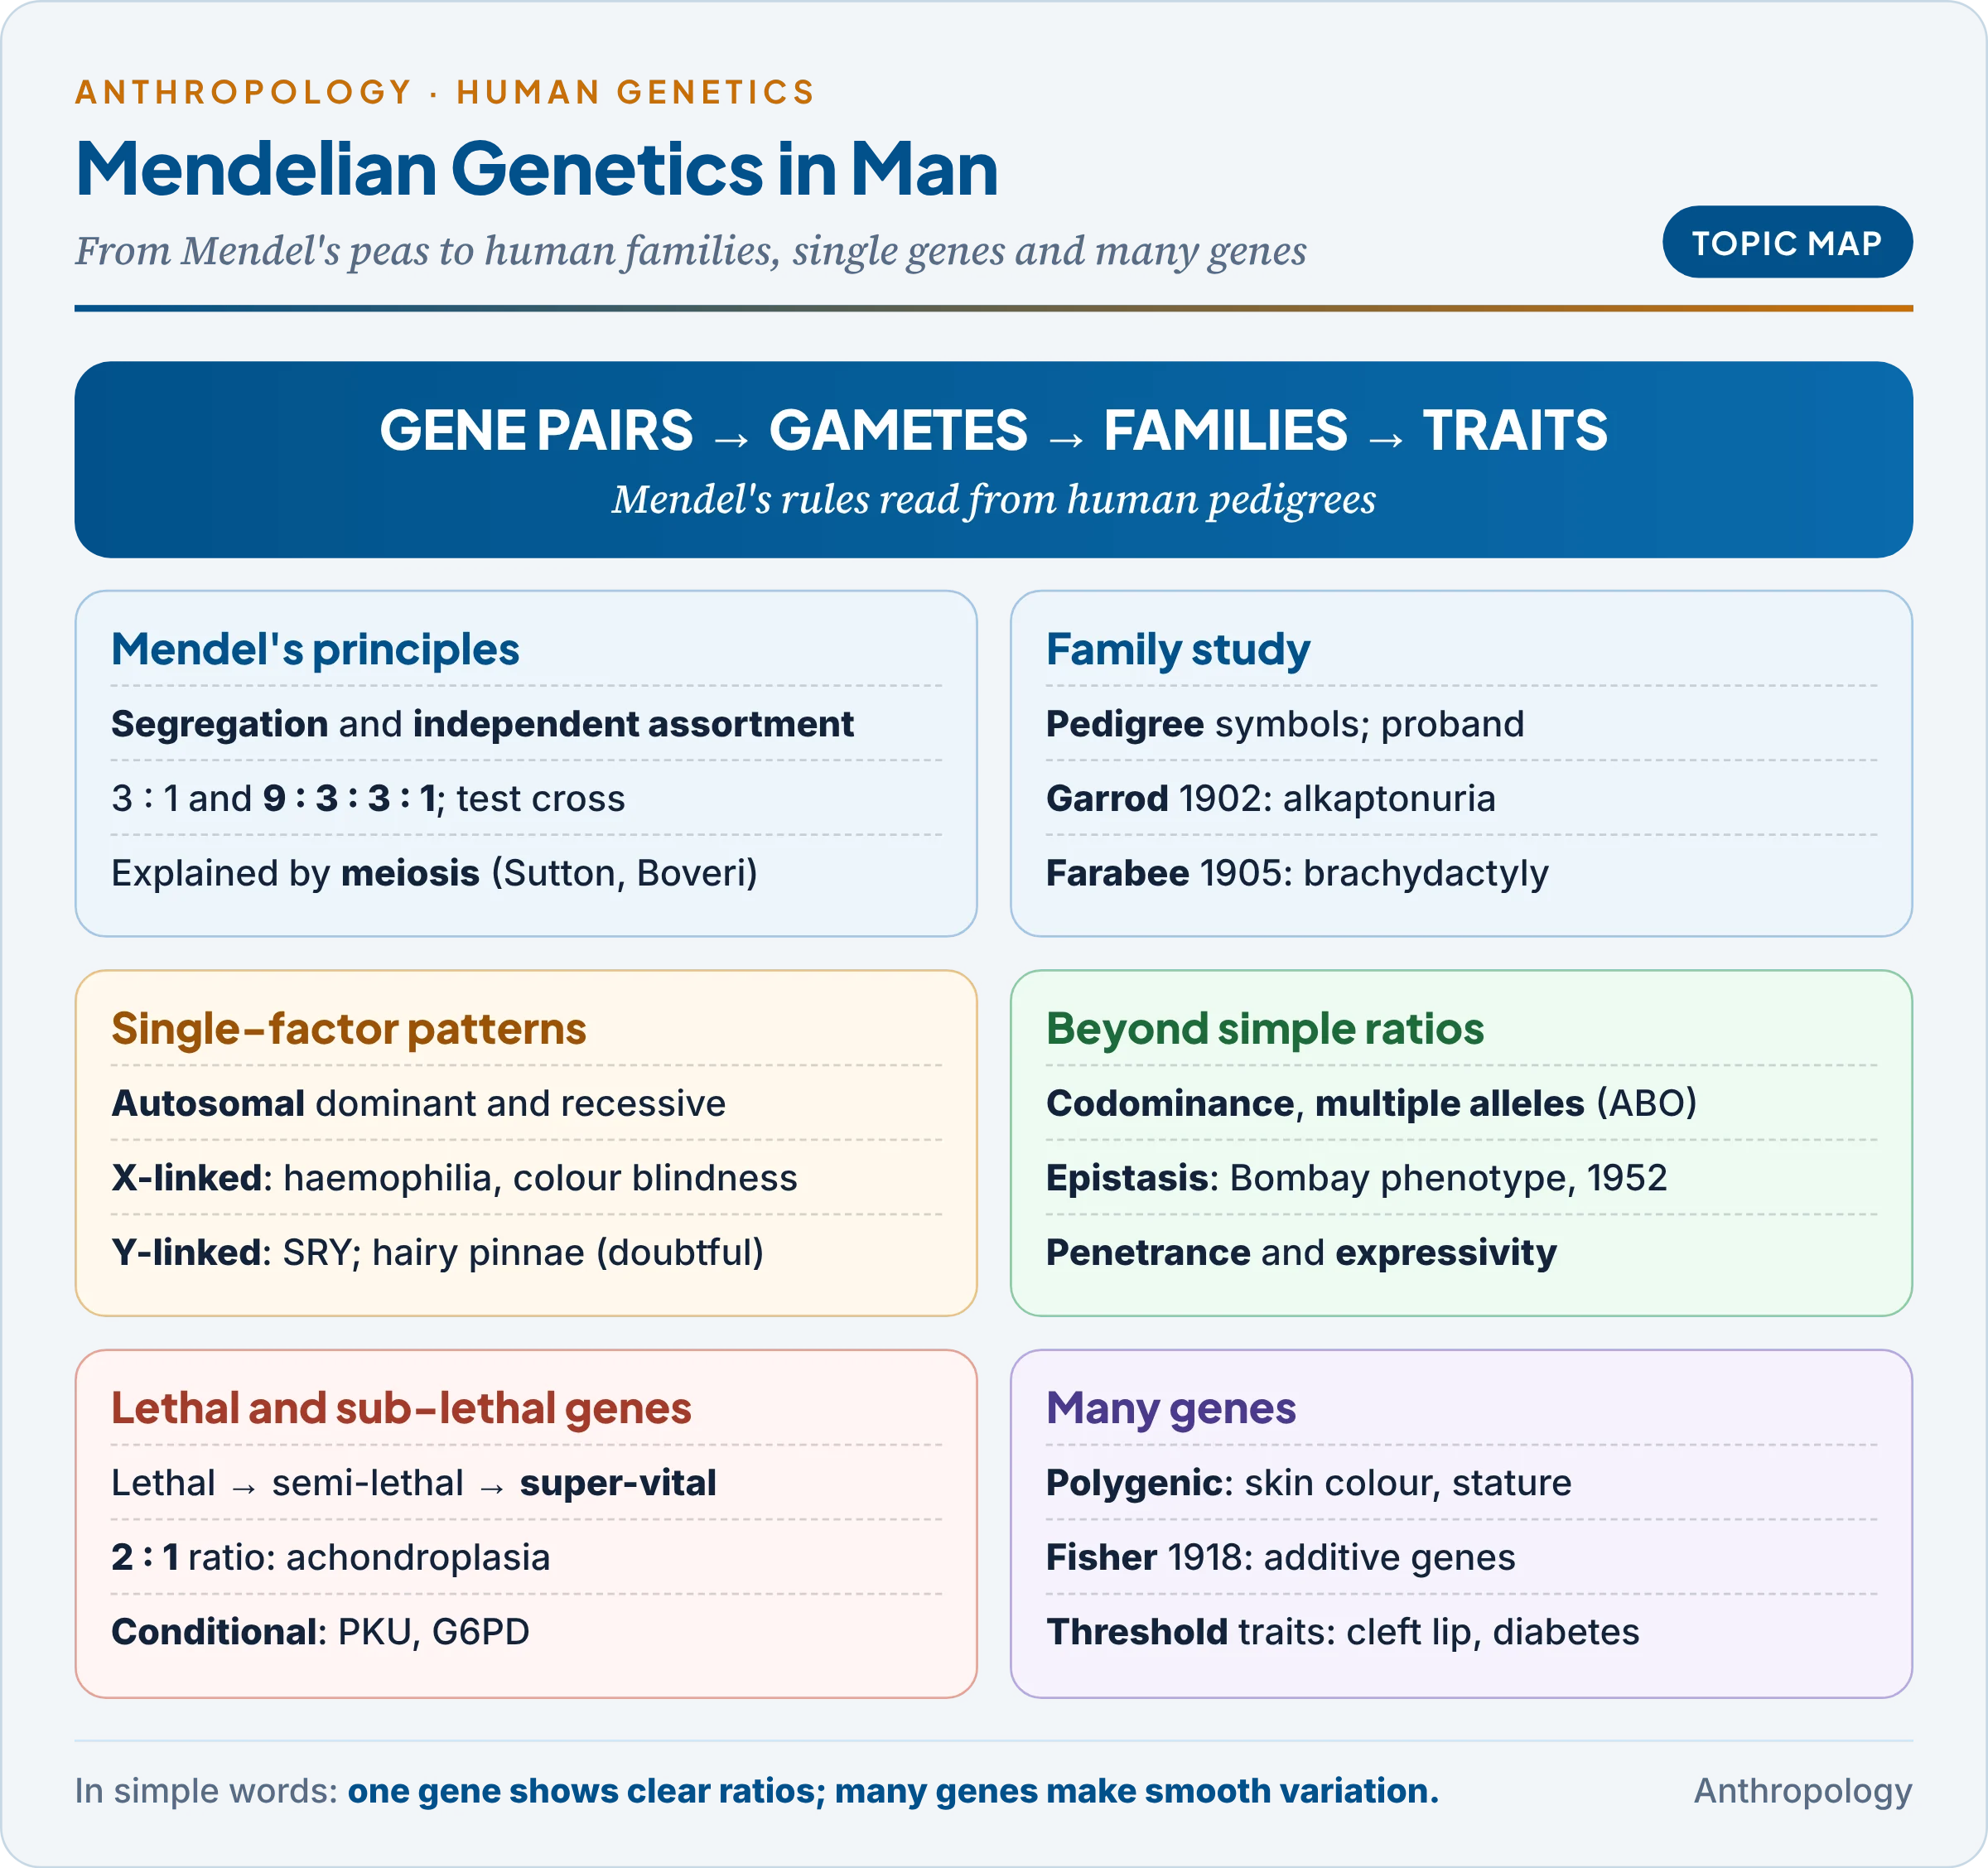
- Topic map: Mendel’s laws → family study → single-factor patterns → deviations → lethal genes → polygenic and multifactorial.
- Mendel’s crosses: TT × tt → F1 Tt → F2 1 : 2 : 1 (3 : 1); dihybrid 9 : 3 : 3 : 1; label anaphase I for segregation.
- Pedigree patterns: four small pedigrees with standard symbols; mark male-to-male transmission (AD), unaffected carrier parents (AR), criss-cross (XR), father to all sons (Y).
- ABO and Bombay: three alleles, six genotypes, four groups; H substance blocked in hh.
- Polygenic curve: 1 : 4 : 6 : 4 : 1 bars for two genes, the bell curve, and the threshold line for multifactorial disease.
Revision Grid
| Scholar | Work (year) | Key idea |
|---|---|---|
| Gregor Mendel | Experiments on Plant Hybridization (1866) | Segregation and independent assortment of factors |
| Francis Galton | Natural Inheritance (1889) | Continuous variation; regression to the mean |
| Karl Landsteiner | 1900 | ABO blood groups |
| Archibald Garrod | 1902 | Alkaptonuria, a recessive “inborn error of metabolism” |
| William Farabee | 1905 | Brachydactyly, first human dominant |
| Lucien Cuénot | 1905 | Lethal yellow gene in mice (2 : 1) |
| Nilsson-Ehle | 1909 | Additive genes for wheat colour |
| Davenport and Davenport | 1910, 1913 | Additive model of skin colour |
| R.A. Fisher | 1918 | Polygenic theory reconciles Mendel and biometry |
| Felix Bernstein | 1924 | Three-allele model of ABO |
| Bhende and colleagues | 1952 | Bombay phenotype (epistasis) |
| Dronamraju and Haldane | 1962 | Hairy pinnae as a possible Y-linked trait |
| Douglas Falconer | 1965 | Liability-threshold model |
| Basu Mallick and colleagues | 2013 | SLC24A5 and skin colour in India |
| Yengo and colleagues | 2022 | 12,111 height variants |
Previous Year Questions
Unit 9.2: Mendelian genetics in man
- 2025Write notes on: Mendelian and non-Mendelian traits.
- 2024What is a multifactorial trait? Illustrate your answer with suitable human examples.
- 2023Write notes on: Polygenic Inheritance.
- 2016Critically discuss the Mendelian principles and their application to human populations.
- 2012What are lethal and sub-lethal genes ?Explain.
- 2011Discuss monogenic and polygenic inheritance in man, citing suitable examples.
- 1993What are the contributions of Gregor Mendel to the field of Genetics ? Discuss with suitable examples how Mendel’s laws of inheritance are applicable to Man?
- 1992What are Mendel’s laws of inheritance ? Describe the recent advances in human genetics.
- 1991Write a note on Mendelism.
- 1990Describe Mendel’s laws of Inheritance. What are the recent advances in human genetics and human cytogenetics ?
- 1989Write a note on Law of Heredity as Propounded by Mendel.
- 1987Discuss how the laws of heredity propounded by Mendel can be understood in the context of meiotic cell division and their application on Man.
- 1986Discuss the laws of inheritance propounded by Mendel on the basis of his classic experiments. Explain how these laws are applied in the study of human genetics.
- 1982Mendelian principle are equally applicable to animal populations as well as to human populations. Discuss.
Related questions from other units
- 2026Unit 9.1: How would you find out that a particular disease/disorder is inherited and, if so, in which manner? Elaborate with suitable examples.
- 2025Unit 9.1: Differentiate between pedigree and genealogical analyses. Discuss the history and application of these methods in anthropological studies.
- 2024Unit 1.7: Write notes on: Lethal and sublethal genes.
- 2024Unit 1.7: Write notes on: Single-gene mutation disorders in man.
- 2024Unit 9.6: Describe the genetics and inheritance patterns of the ABO and Rh blood groups in man.
- 2024Unit 9.1: Write notes on: Heritability and its estimation.
- 2022Unit 9.1: Write notes on: Pedigree analysis in genetic counselling.
- 2012Unit 9.6: Discuss the role of ABO blood group system in resolving cases of disputed paternity.
- 2007Unit 9.1: Write a note on Pedigree Analysis.
- 1988Unit 1.7: Give an outline of the anthropological perspective of genetics and -critically evaluate the genetic significance of meiotic cell division.