

concept of IQ, deviation IQ, constancy of IQ.
Official Syllabus: Paper I · Unit 10 Intelligence and Aptitude
“The concept of the intelligence quotient (IQ) has been introduced… The American psychologists do not state the normal IQ as = 1 as we do, but as = 100.”
— Stern (1925), on the quotient he had proposed in 1912
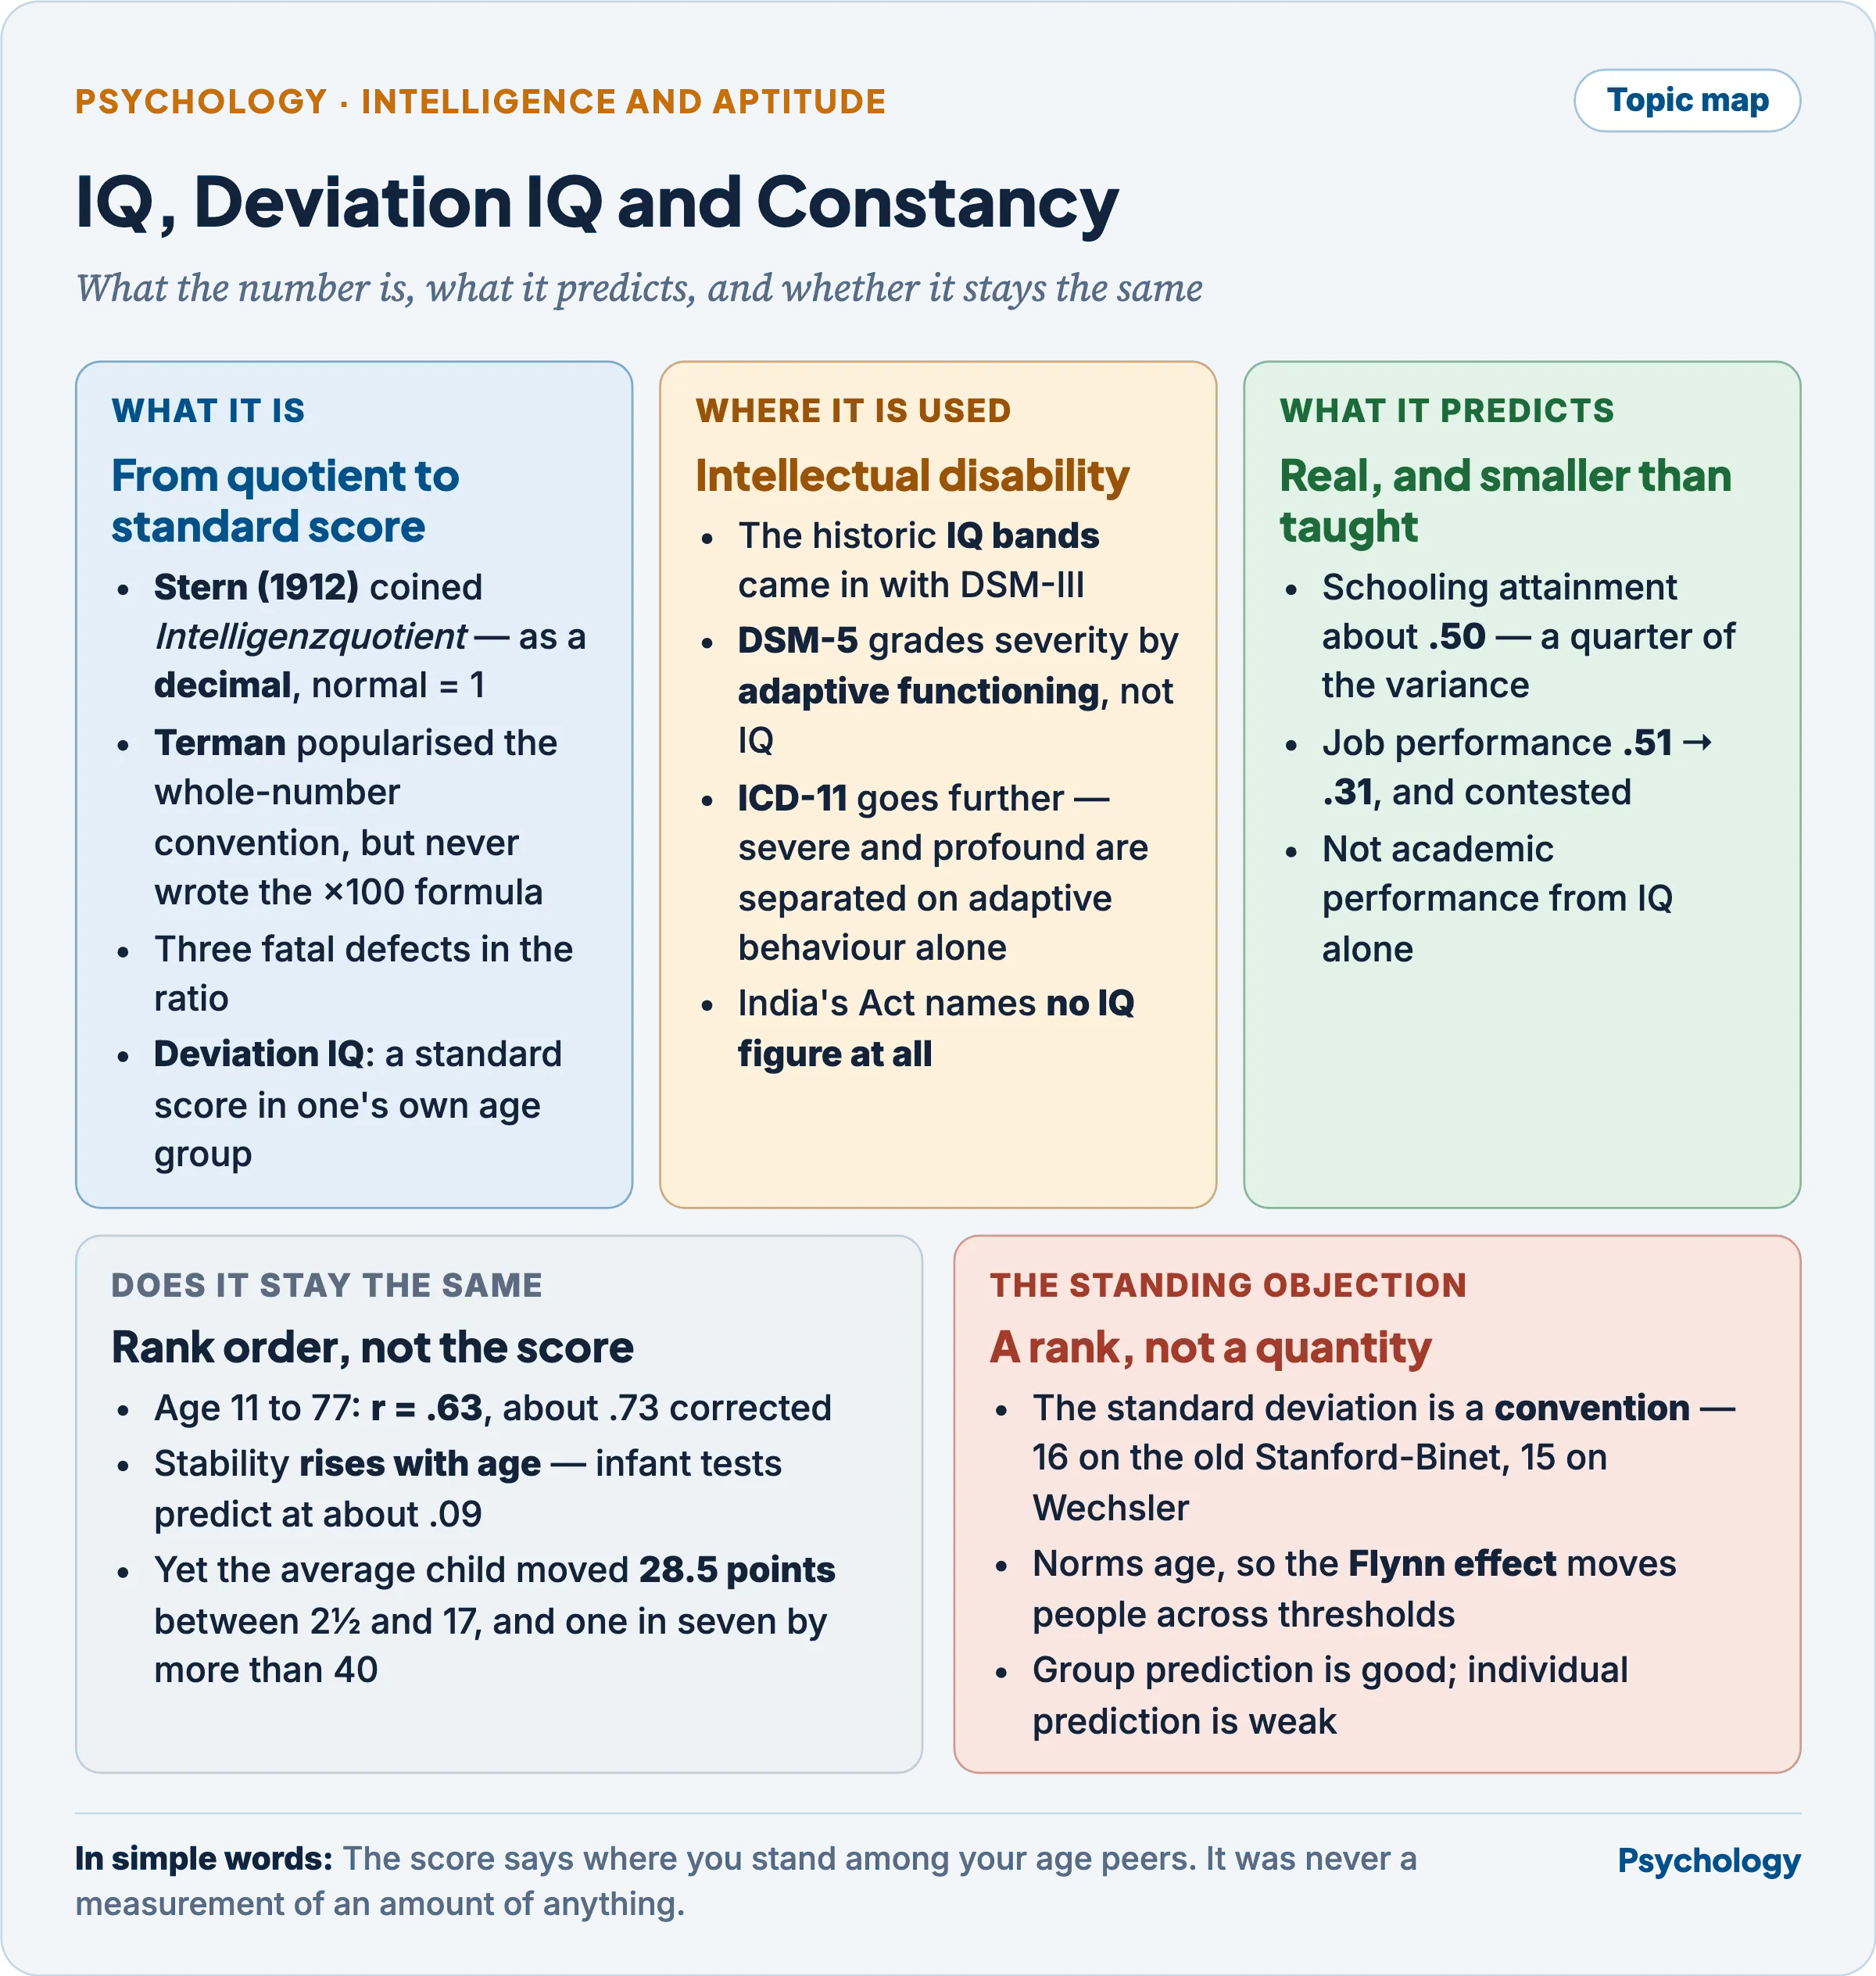
The quotient was a solution to a narrow technical problem — how to express a lag in a way that means the same thing at six and at fourteen — and it has carried a weight of interpretation its arithmetic was never built for. Three questions follow from it and are separable: what the number is, what it predicts, and whether it stays the same. The instruments that produce the number are treated separately.
The concept of IQ
- Stern (1912) proposed the quotient — mental age divided by chronological age — to solve a real problem: a two-year lag means something different at six than at fourteen. His worked example: an eight-year-old with a mental age of six has a quotient of 6/8 = 0.75.
- Stern coined the term, and coined it as a decimal. His own 1912 abbreviations key reads “IQ. = Intelligenzquotient”, so both the concept and the abbreviation are his, with normal = 1, not 100. The frequent attribution of the coinage to Terman arises because the 1914 English translation renders it throughout as “mental quotient” and never once as “intelligence quotient.”
- Terman never wrote the formula as it is usually printed. His 1916 definition is a bare ratio of mental age to chronological age, and his own worked example prints a decimal — .75. Multiplying by 100 was his tabulating convention, not his formula. Stern (1925) says so explicitly, noting that the American psychologists state the normal IQ as 100 rather than 1.
- So the familiar expression, true to practice but to neither author’s text:
IQ = (Mental Age ÷ Chronological Age) × 100
- What it buys. A single number, comparable across ages, with an intuitive meaning: 100 is exactly average for one’s age, above 100 is ahead, below is behind.
- The ratio IQ has three defects, and all three are fatal rather than inconvenient.
- Mental age stops growing; chronological age does not. Performance on these tasks plateaus in the mid to late teens, so beyond that the denominator keeps rising and the quotient falls mechanically. On a strict ratio formula a stable adult’s IQ declines every birthday, which is an artefact of the arithmetic and not a finding about the person.
- The spread of ratio IQs differs by age — the decisive defect, and Terman and Merrill demonstrated it themselves. Their 1937 text states that the use of IQ scores rests on the assumption that variability in IQ terms stays roughly constant from age to age, and that only so far as that holds does the score have consistent meaning. Their own table then shows the standard deviation of IQ running from about 12.5 at age six to about 20.6 at age two and a half — an eight-point spread in the standard deviation itself. An IQ of 120 is therefore a different degree of rarity at different ages, and they admitted smoothing over the problem.
- Mental age is not a real quantity. Two children with the same mental age may have reached it by passing entirely different items, and the unit does not represent equal increments of ability at different points on the scale.
Deviation IQ
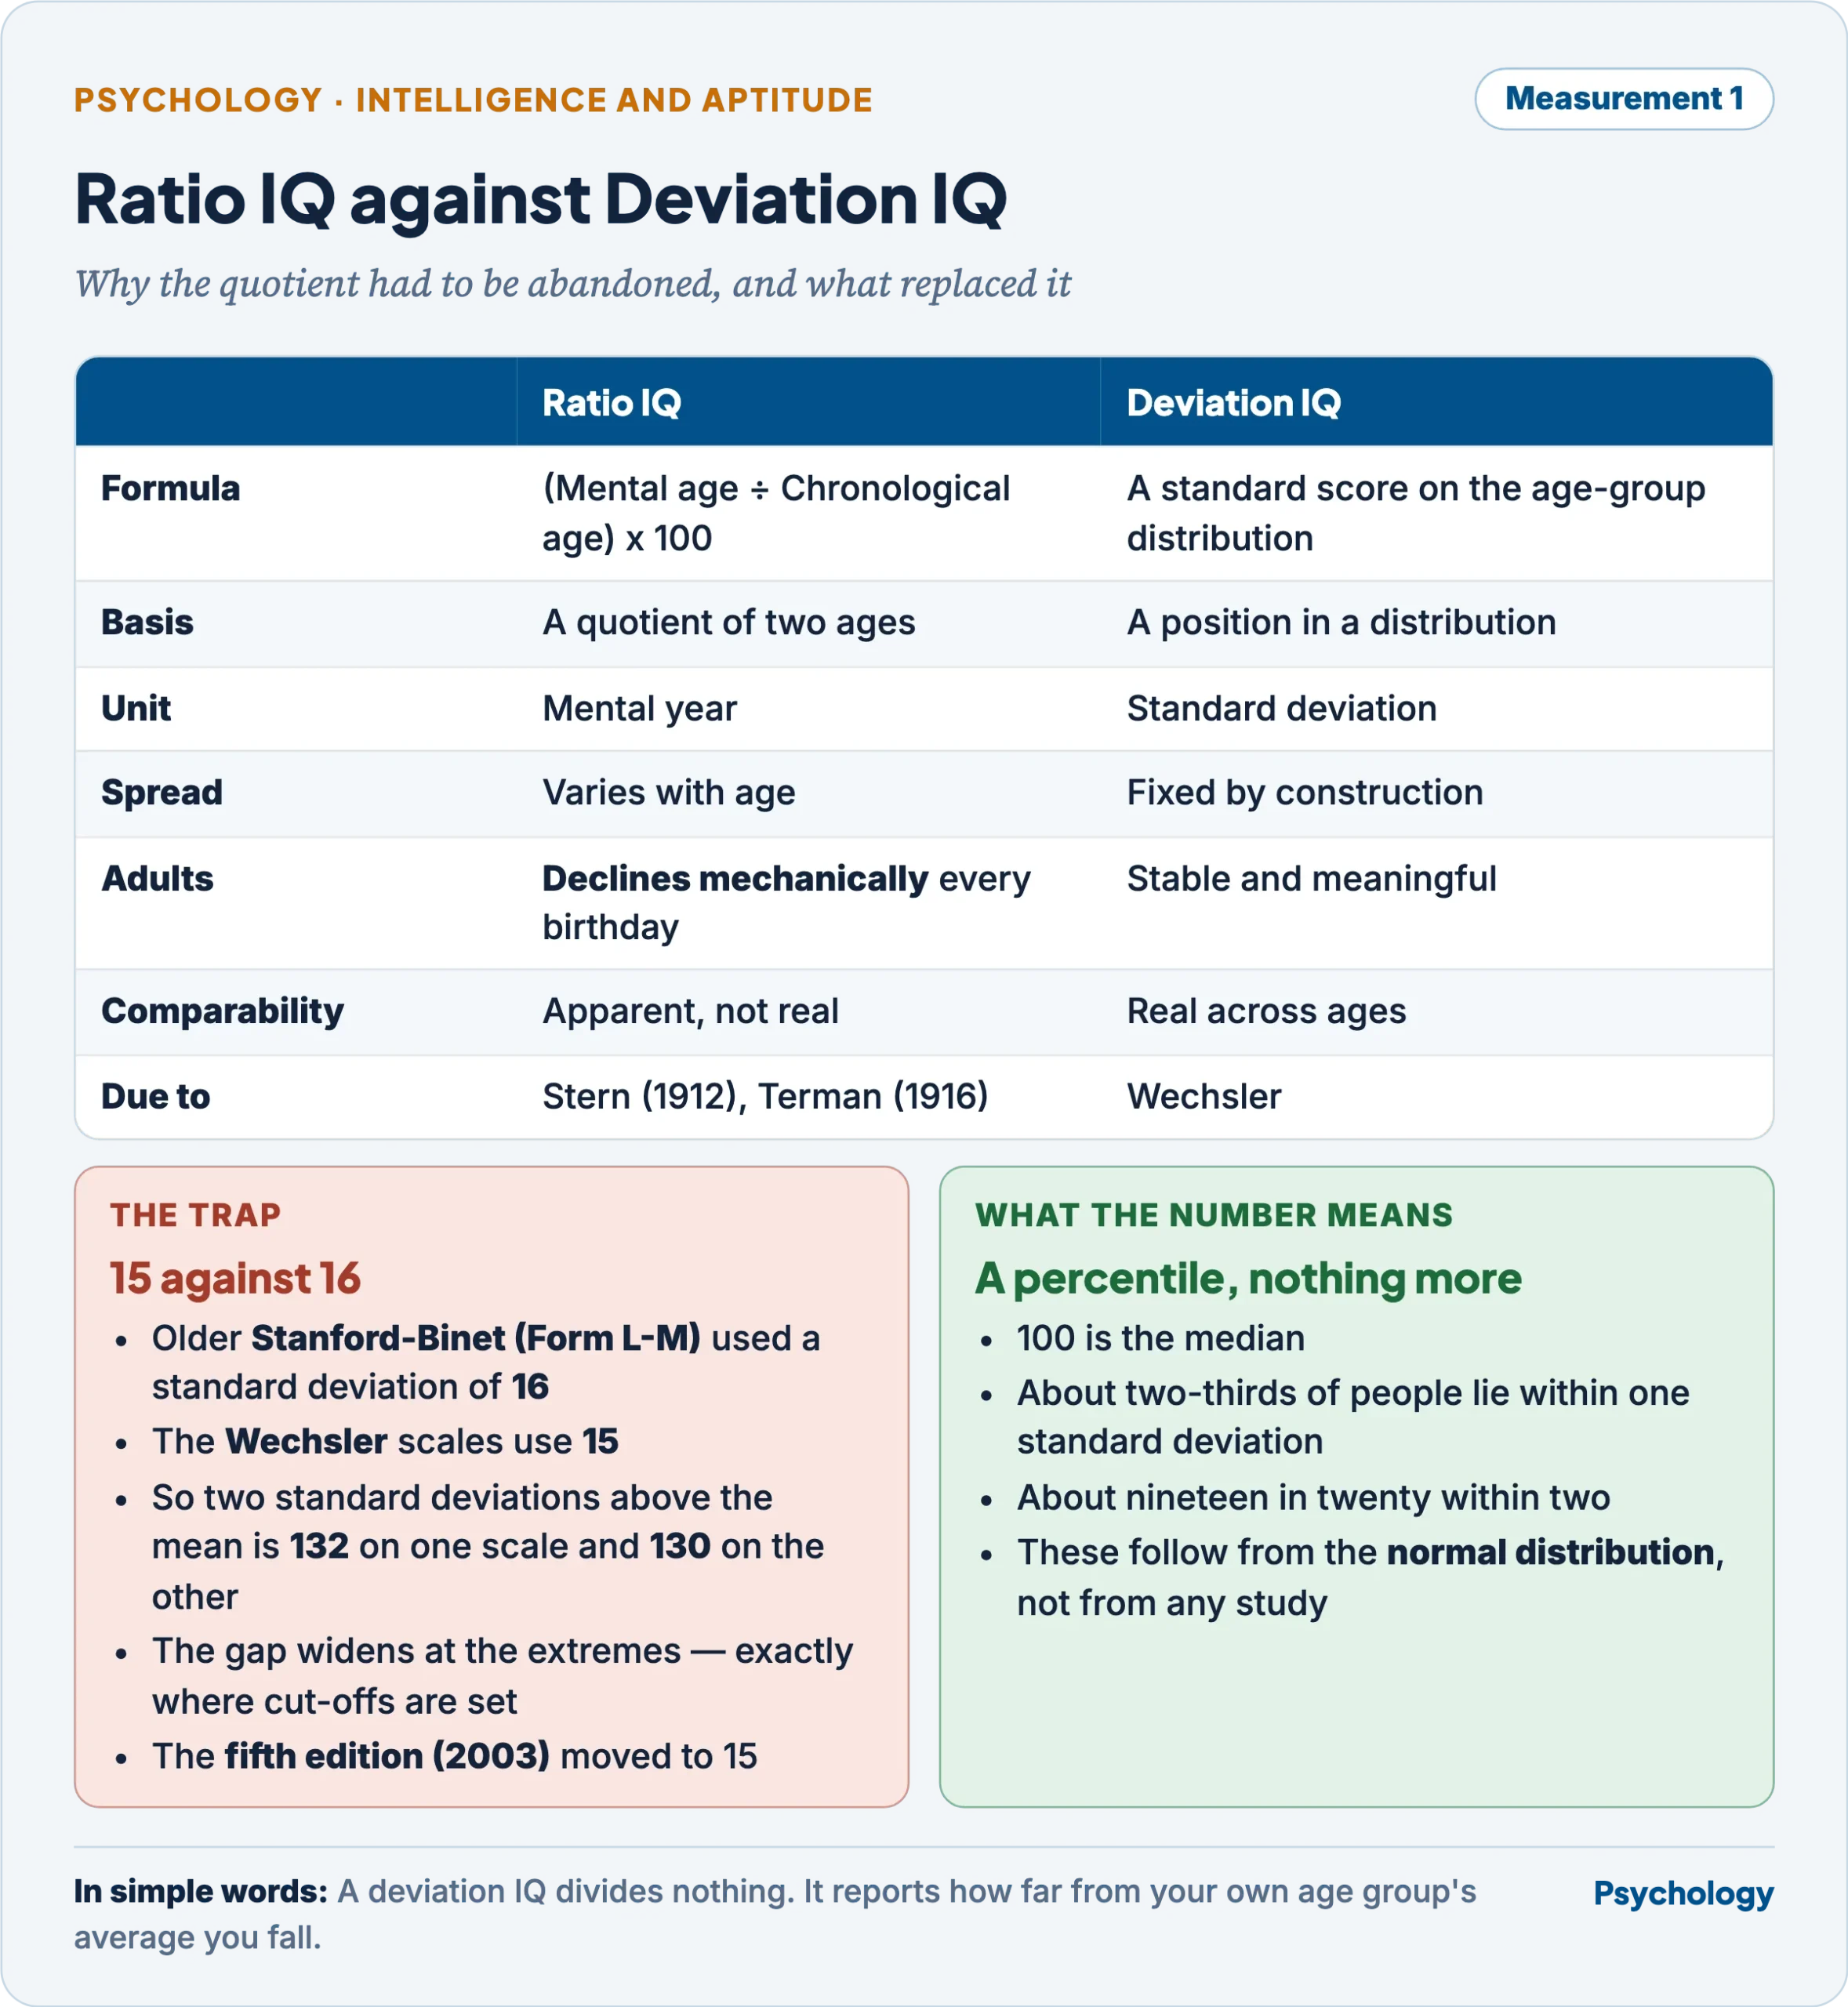
- The solution was to abandon the quotient and keep the name. Wechsler defined IQ as a standard score expressing a person’s position in the distribution of scores for their own age group, with a mean of 100 and a standard deviation of 15. Nothing is divided by anything; the score says how far from the age-group average the person falls, in standard-deviation units.
- Why this repairs all three defects. Because the comparison group is always one’s own age peers, the score is stable across the lifespan without a plateau problem; because the standard deviation is fixed by construction, a given IQ means the same rarity at every age; and because the unit is a standard deviation rather than a notional mental year, it is equal-interval by definition.
- The Stanford-Binet accepted it only in 1960. Wechsler introduced standard-score IQs in his first edition; the Stanford-Binet kept the ratio IQ until the 1960 Form L-M, whose revised tables — computed by Pinneau — replaced it. Cronbach (1960) records the change as discarding a conceptually and statistically unsatisfactory statistic, after which an IQ of a given size means the same thing at every childhood age. Deviation scoring is therefore Wechsler’s innovation and the Stanford-Binet’s later concession, two decades apart.
| Ratio IQ | Deviation IQ | |
|---|---|---|
| Formula | (MA ÷ CA) × 100 | Standard score on the age-group distribution |
| Basis | A quotient of two ages | A position in a distribution |
| Unit | Mental year | Standard deviation |
| Spread | Varies with age | Fixed by construction |
| Adults | Declines mechanically | Stable and meaningful |
| Comparability | Apparent, not real | Real across ages |
| Attribution | Stern, Terman | Wechsler |
- A practical trap in the standard deviation itself. The Stanford-Binet through Form L-M and the 1986 fourth edition used a standard deviation of 16; the Wechsler scales use 15. Cronbach (1960) called the discrepancy unfortunate and recorded that Wechsler simply chose 15. Terman and Merrill’s own 1937 prose had recommended 17 while their published conversion table used 16, and 16 is what all later practice adopted — so the figure is a convention that hardened, not a property of intelligence.
- The consequence is that the same IQ number is not the same percentile on the two tests: two standard deviations above the mean is 132 on the 16-point scale and 130 on the 15-point scale, and the gap widens at the extremes — precisely where giftedness and disability cut-offs sit.
- The effect was measured, not merely inferred. When the same adolescents were given the 1937 Stanford-Binet and the Wechsler-Bellevue, the mean Stanford-Binet IQ was 132 and the mean Wechsler IQ 122; and in the Wechsler standardisation only half as many children scored 130 and above as in the Terman-Merrill one.
- The fifth edition (2003) moved the Stanford-Binet to a standard deviation of 15. The change is documented; the often-asserted motive of matching Wechsler is not, so it is stated here as a fact and not as a reason.
- Percentile is what a deviation IQ means, and the figures follow from the normal distribution rather than from any study: 100 is the median, roughly two-thirds of people fall within one standard deviation of it, and about nineteen in twenty within two. An IQ is a rank statement about a population, not a measure of an amount of anything.
IQ and intellectual disability
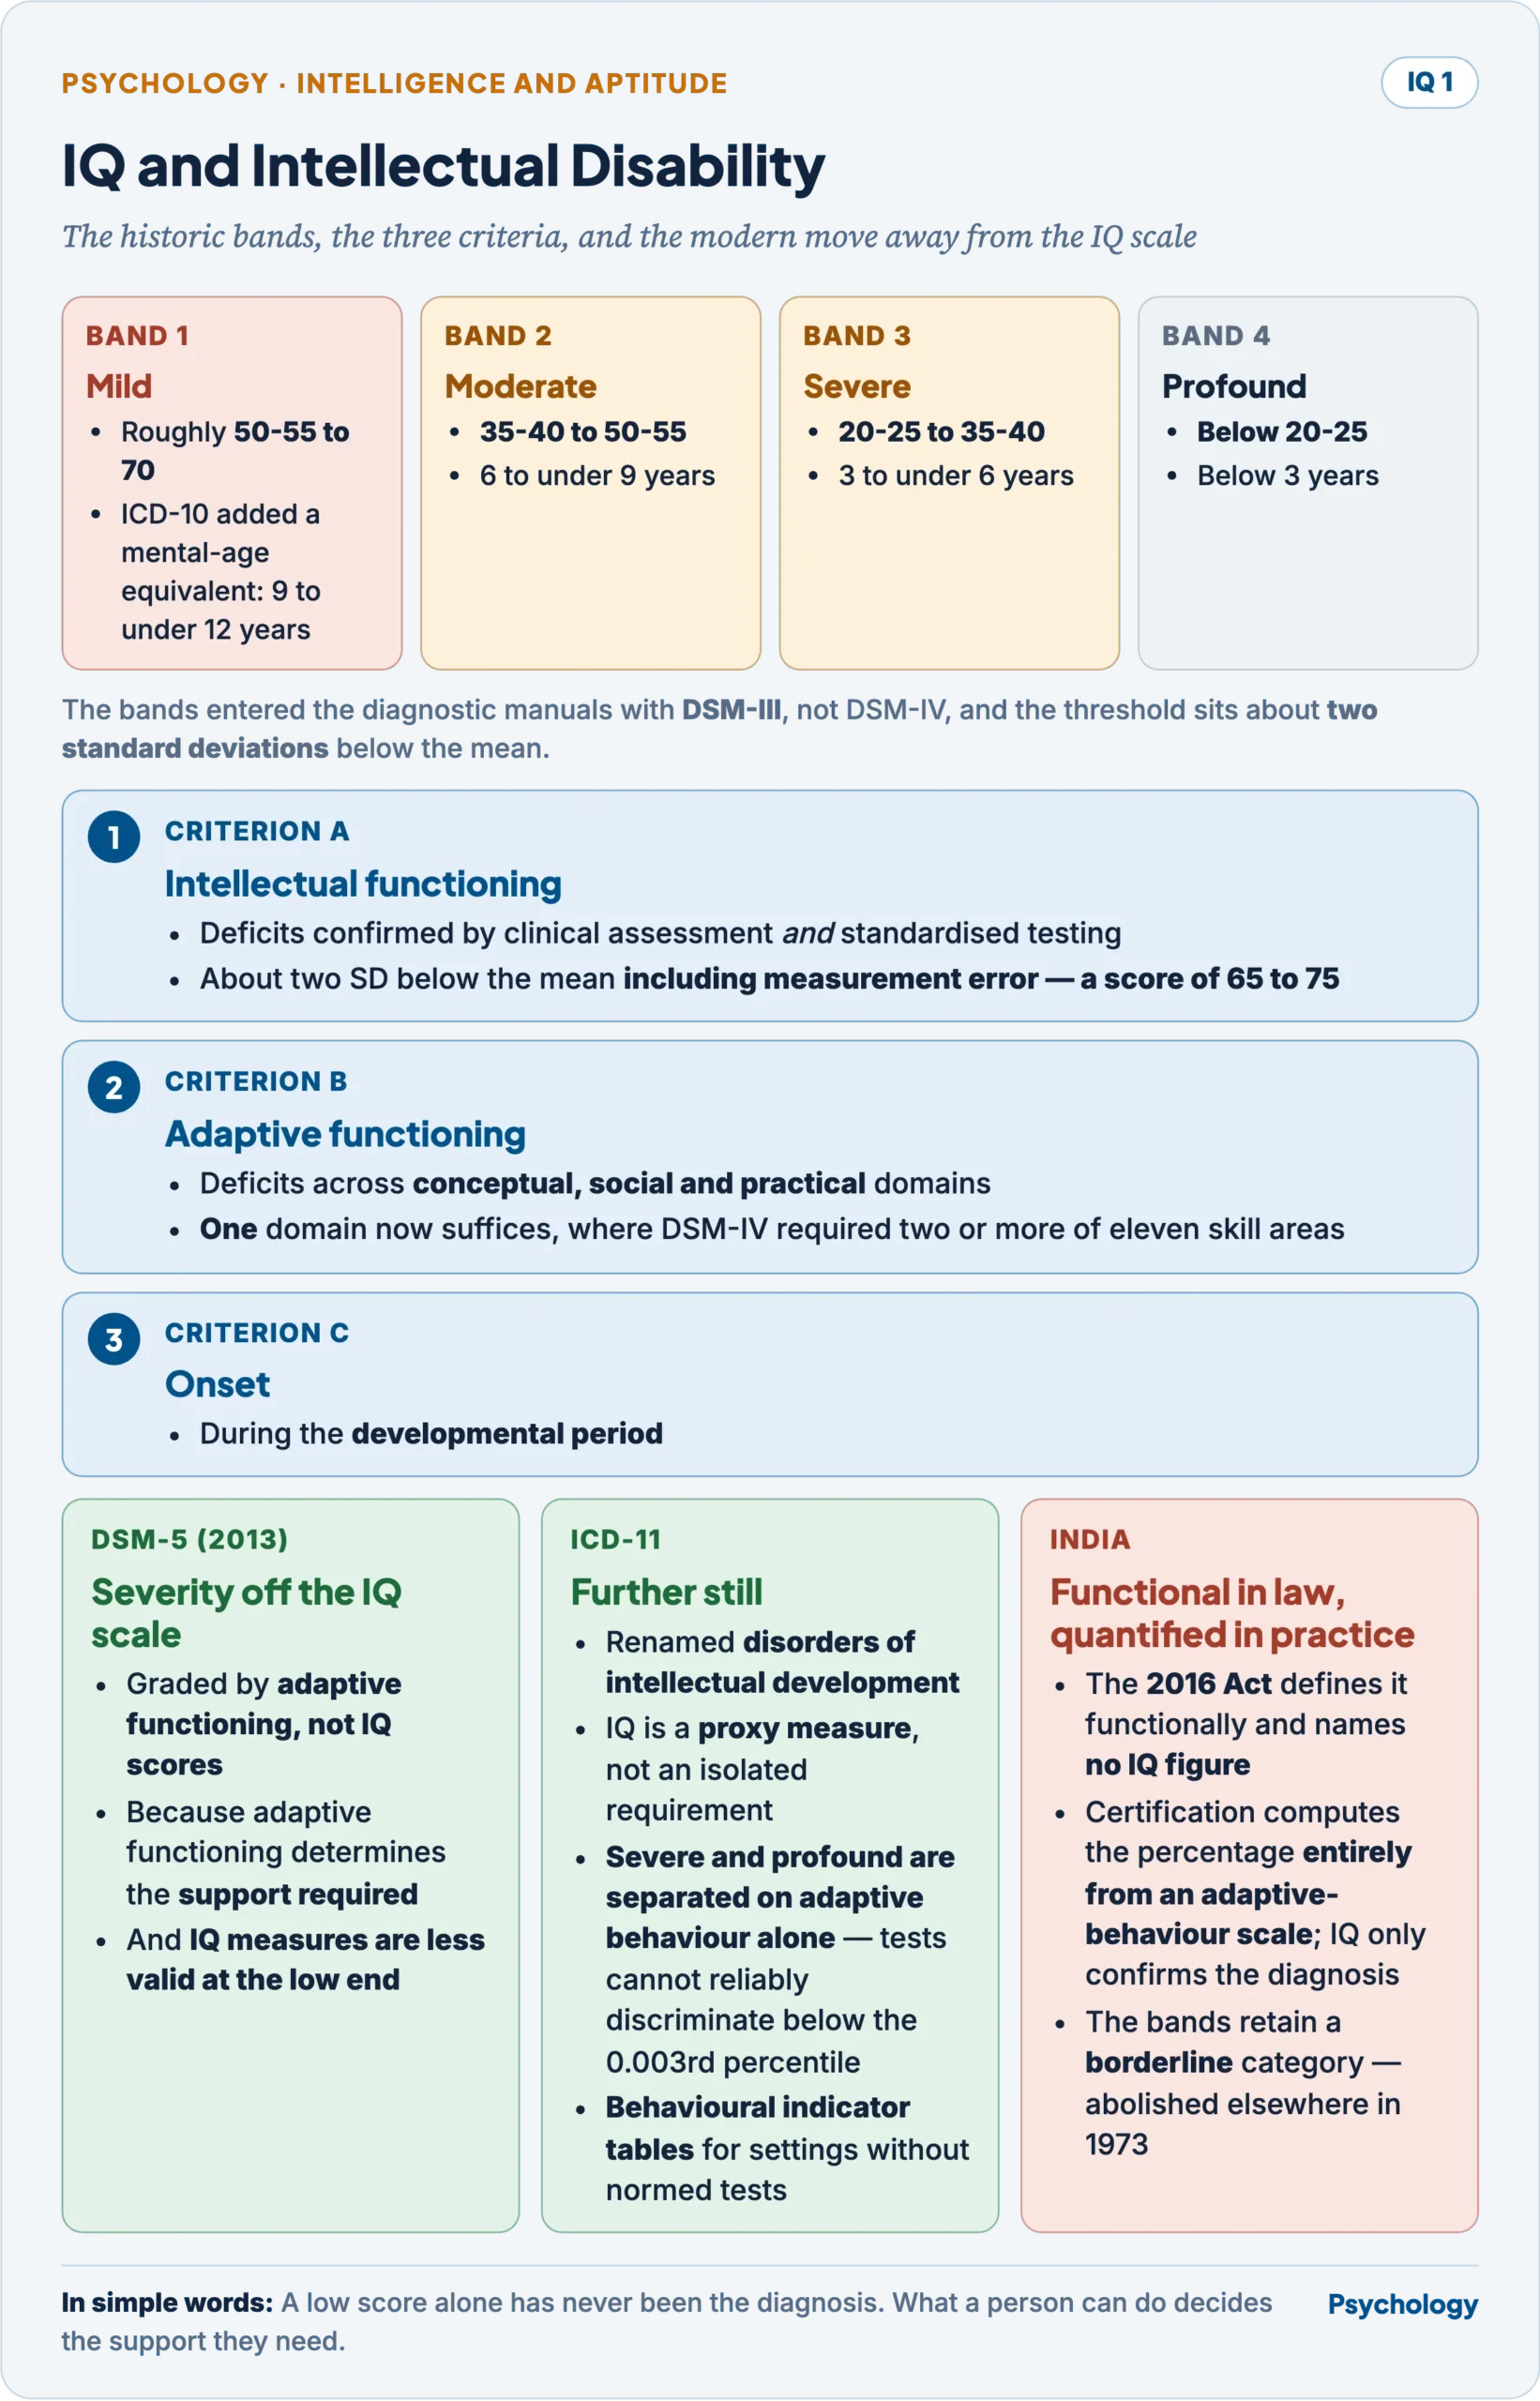
- The historic classification by IQ band, which the Stanford-Binet tradition supplied, grades the condition as mild (roughly 50-55 to 70), moderate (35-40 to 50-55), severe (20-25 to 35-40) and profound (below 20-25), with the threshold set about two standard deviations below the mean.
- The historic classification by IQ band, which the Stanford-Binet tradition supplied, grades the condition as mild (roughly 50-55 to 70), moderate (35-40 to 50-55), severe (20-25 to 35-40) and profound (below 20-25), with the threshold about two standard deviations below the mean. The bands entered the diagnostic manuals with DSM-III, not DSM-IV, and the American association for the field matched them. ICD-10 used the same structure with its own twist — it attached mental-age equivalents to each band, mild corresponding to a mental age of nine to under twelve years.
- The modern classifications have moved severity off the IQ scale, and the manuals state the reasoning. DSM-5 (2013) grades severity by adaptive functioning, across conceptual, social and practical domains, because it is adaptive functioning that determines the level of supports required and IQ measures are less valid in the lower end of the IQ range. Its intellectual criterion is a score about two standard deviations below the mean including a margin of measurement error — a score of 65 to 75, and deficits in one adaptive domain now suffice where DSM-IV required two or more of eleven skill areas.
- ICD-11 goes further than DSM-5. It renames the category disorders of intellectual development, treats an IQ as not an isolated diagnostic requirement but a proxy measure, and states that the diagnosis must not rest on IQ alone. Its sharpest provision: severe and profound are differentiated exclusively on adaptive behaviour, because existing standardised tests cannot reliably distinguish among people functioning below about the 0.003rd percentile. It also supplies behavioural indicator tables for use where appropriately normed tests are unavailable — a provision aimed squarely at low-resource settings.
- Three reasons the cut-off cannot bear the weight placed on it. The standard error of measurement means an obtained score of 70 is a band rather than a point, and courts have been directed to take that error into account. The Flynn effect means norms age, so the same performance scores higher against older norms and diagnostic status can change with the edition used. And the standard deviation difference between test families shifts the same number across the threshold.
- The Indian frame is statutory, and more interesting than it first looks. The Rights of Persons with Disabilities Act, 2016 defines intellectual disability as significant limitation both in intellectual functioning (rasoning [sic], learning, problem solving) and in adaptive behaviour — and mentions no IQ figure at all, no standard deviation and no percentile. The definition is framed entirely functionally, and it places specific learning disabilities and autism spectrum disorder under it as sub-clauses rather than as separate heads.
- The certification guidelines are the sharp part. The notification issued under the Act computes the disability percentage entirely from an adaptive-behaviour scale — the social maturity scale — with IQ testing used only to confirm the diagnosis. So India quantifies rigidly, but it quantifies adaptive functioning, which places the scheme closer to DSM-5 than to the ICD-10 IQ bands.
- One anomaly worth noticing: the certification bands retain a borderline category at the top, the very category the American association abolished in 1973 when it moved the cut-off back from one standard deviation to two. The guidelines in force were renotified in March 2024.
Does IQ predict success?
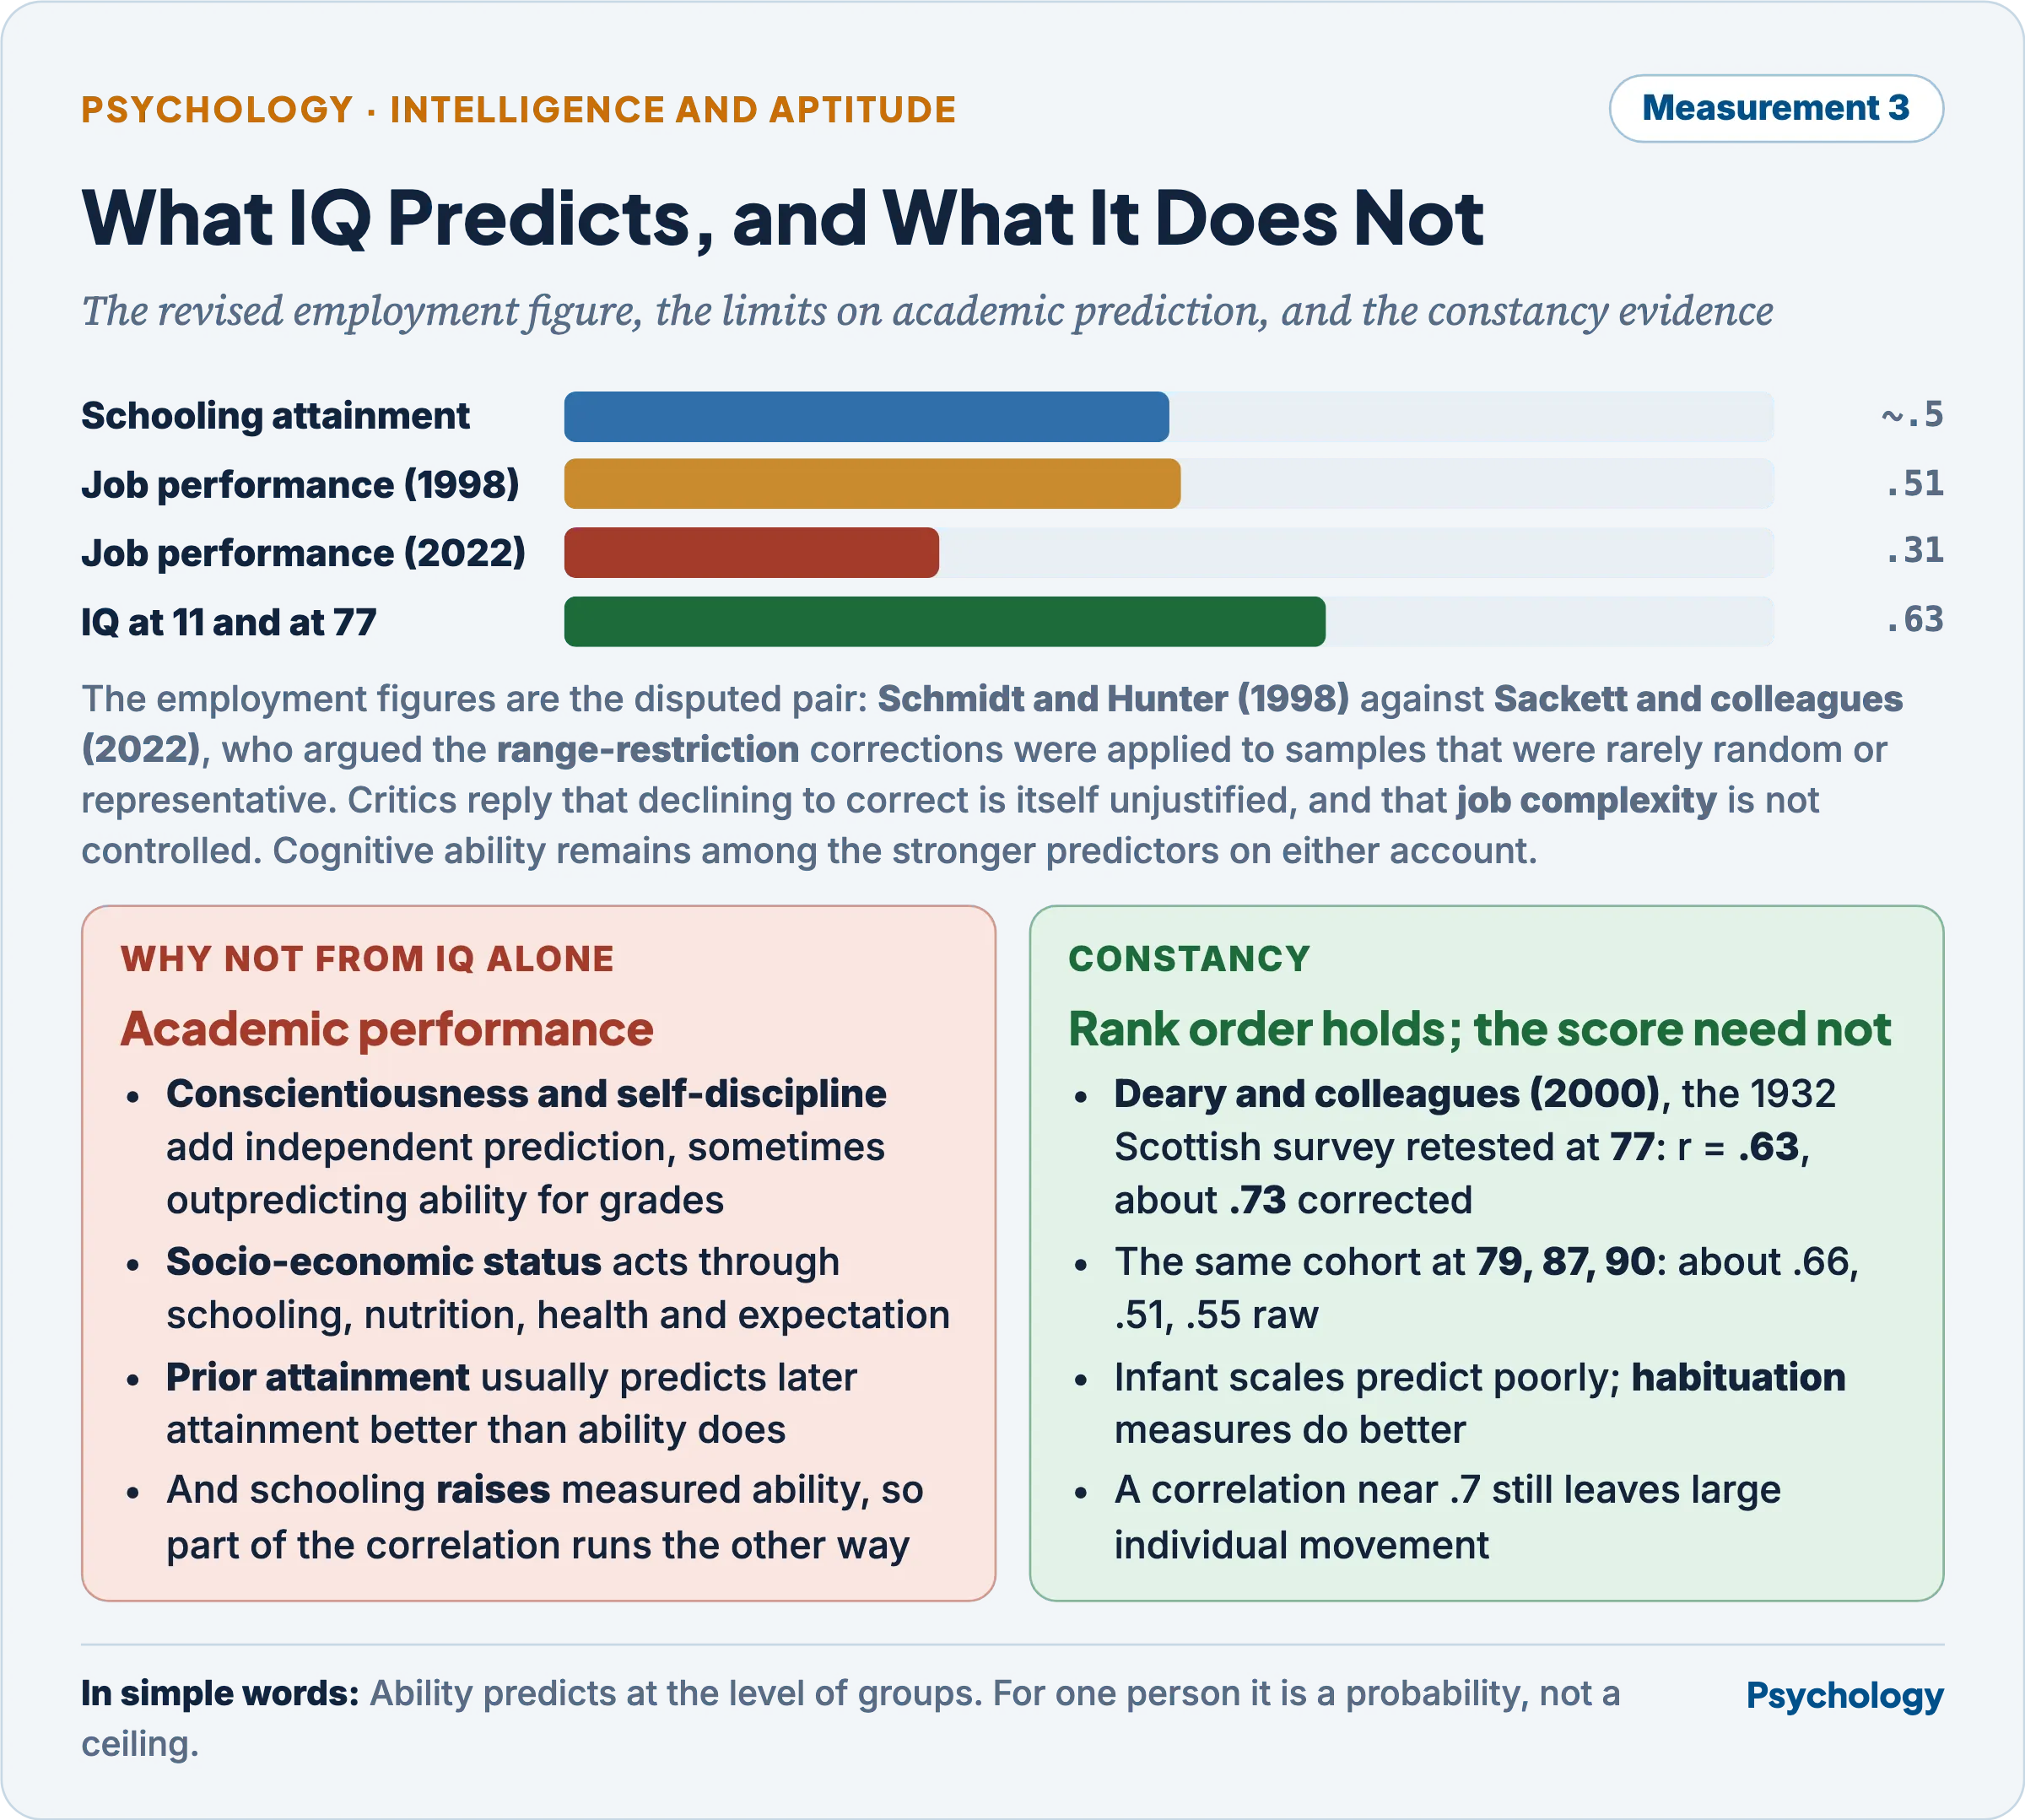
- In education the association is real and substantial. Measured ability correlates with school attainment in the region of .5, which places it among the strongest single predictors available — and leaves roughly three-quarters of the variance to everything else.
- In employment the headline figure has been revised downward, and the revision is contested. Schmidt and Hunter (1998) reported a corrected validity of about .51 for general mental ability against job performance, which became the standard citation for two decades. Sackett and colleagues (2022) argued that the corrections for range restriction in that literature were applied to samples that were rarely random or representative, and therefore overcorrected; integrating the prior meta-analyses without those corrections they reported about .31. The dispute is live: critics reply that declining to correct is itself unjustified, and that the comparison ignores job complexity, for which the original estimate was specific. The defensible statement is that cognitive ability remains among the stronger predictors of job performance on either account, and that the size of its advantage over other predictors is smaller than was taught.
- Academic performance cannot be determined from IQ alone, for specific reasons.
- Ability predicts attainment best where instruction is uniform and the criterion is a standardised test, and worst where grades depend on coursework, attendance and teacher judgement — which is why the correlation varies so much between studies.
- Conscientiousness and self-discipline add substantial independent prediction, in some studies outpredicting ability for school grades.
- Socio-economic status operates on attainment through schooling quality, nutrition, health and expectation, partly independently of measured ability.
- Prior attainment usually predicts later attainment better than ability does, because it carries the effects of ability and everything else already realised.
- And the causal arrow runs both ways: schooling raises measured ability, so part of the correlation is attainment producing IQ rather than the reverse.
- What follows for use. A score supports a probabilistic statement about a group and a weak one about an individual. Treating it as a ceiling on what a particular child can achieve is the specific misuse Binet warned against in 1909 and the evidence has not vindicated since.
Constancy of IQ
- What is stable is rank order, not the score. Constancy means that people tend to hold their position relative to their age peers, which is a different and weaker claim than that an IQ is fixed.
- The long-run evidence is good because one country tested a whole birth cohort. Every Scottish child born in 1921 and at school on a day in June 1932 — 87,498 of them — sat the same test. Deary and colleagues (2000) retested 101 of the survivors at 77 on that same instrument and found a correlation of .63, rising to about .73 corrected for restriction of range. Later work followed the cohort further: age 11 to 79 gives about .66, to 87 about .51, and to 90 about .54, which corrects to about .67.
- The corrections are themselves conservative. Allowing for the test’s own short-term unreliability, the investigators estimated the true stability from age 11 to age 80 might be as high as .8.
- Stability increases with age at first testing, and the early figures are strikingly low. Scores on standardised infant tests given between one and six months correlate about .09 with childhood intelligence, rising only to about .20 when given between seven and twelve months; such tests do not predict at useful levels until after about eighteen to twenty-four months. Measures of infant habituation and novelty preference do better, which locates the weakness in what infant scales sample rather than in an absence of continuity. A modern synthesis puts it practically: the stability needed for individual decisions is not reached in children younger than six, and even at eight it holds for only about two years.
- The group figure conceals individual movement, and the scale of it is the counterweight to everything above. In a longitudinal study following children on the same scale at seventeen ages, the average child changed 28.5 IQ points between two and a half and seventeen, more than a third shifted by over 30 points, and one in seven moved by more than 40; one child rose 74. These are not random fluctuations around a fixed value — they follow systematic trends across childhood. The distinction that reconciles this with the .7 correlations is between the stability of mean levels and the stability of individual differences: rank order is well preserved in aggregate while individuals move a great deal within it.
- Constancy is partly built into the instrument. A deviation IQ is a position in an age distribution, and tests are constructed and normed to behave this way, so some of the observed stability is a property of the measurement rather than a discovery about the mind.
Has the IQ outlived its utility, and is EQ more useful?
- It has not outlived its utility, but its claims have been correctly narrowed. It remains the best-validated instrument in differential psychology, indispensable in diagnosing intellectual disability and specific learning difficulty, in neuropsychological assessment, and in identifying children who need support. What has gone is the larger claim — that the score fixes a person’s ceiling, ranks groups, or predicts an individual life.
- The honest reading of the prediction evidence supports exactly that narrowing: real and substantial association at the level of groups, with the employment estimate revised downward and contested, and roughly three-quarters of the variance in attainment left to everything else.
- EQ is not more useful, and the comparison is not like for like. The decisive point is measurement. An IQ is a maximum-performance score with better and worse answers; most emotional-intelligence scores are self-reports of emotional self-efficacy, which belong to personality. Where emotional intelligence is measured as an ability, its incremental validity over general ability and personality is modest; where it appears to add more, decomposition attributes the gain to the personality and ability variance inside the instrument. The popular claim that EQ matters more than IQ has no empirical support.
- What is true is narrower and worth stating. Emotion skills predict performance best where the work is high in emotional labour, and emotional understanding is a measurable knowledge domain that relates to outcomes. So the useful formulation is not that one quotient replaces the other but that they predict different things in different settings — which is an argument for using both appropriately, not for ranking them. The full treatment of the construct and its measurement belongs with emotional intelligence.
Criticisms and limitations
- The IQ is a rank, not a quantity. It supports statements about position in a distribution and not about amounts of ability, and most misuse consists of forgetting this.
- The Flynn effect undermines the fixity of the scale, since the same performance yields a different score against norms of a different vintage, with direct consequences at diagnostic thresholds.
- Prediction at the individual level is weak even where group-level prediction is good, and the gap between the two is routinely elided.
- The standard deviation is a convention, not a property of intelligence, and the same number means different things across test families.
- Constancy is partly an artefact of the instrument: a deviation IQ is a position in an age distribution, and tests are built and normed to behave that way.
- The number outlives the caution attached to it. A score is an estimate with an error, from one occasion, against one reference group — and it is read as a fixed property of a person.
Previous Year Questions
- 2026Does IQ predict mental retardation? Explain the classification of mental retardation with regard to IQ scores given by Stanford-Binet.
- 2021IQ scores predict success in academic, job and other life outcomes. Evaluate.
- 2019In what ways is deviation IQ different from traditional IQ? Discuss.
- 2017Can we determine a person’s academic performance based only on IQ score? Explain.
- 2010Distinguish between IQ and deviation IQ.
- 1999Explain the concept of intelligence quotient. Has it outlived its utility for explaining individual differences? Is the concept of emotional quotient (EQ) more useful in this regard?