

10. Concept of human growth and development: Stages of growth – pre-natal, natal, infant, childhood, adolescence, maturity, senescence. Factors affecting growth and development genetic, environmental, biochemical, nutritional, cultural and socio-economic.
Official Syllabus: Paper I, Unit 10
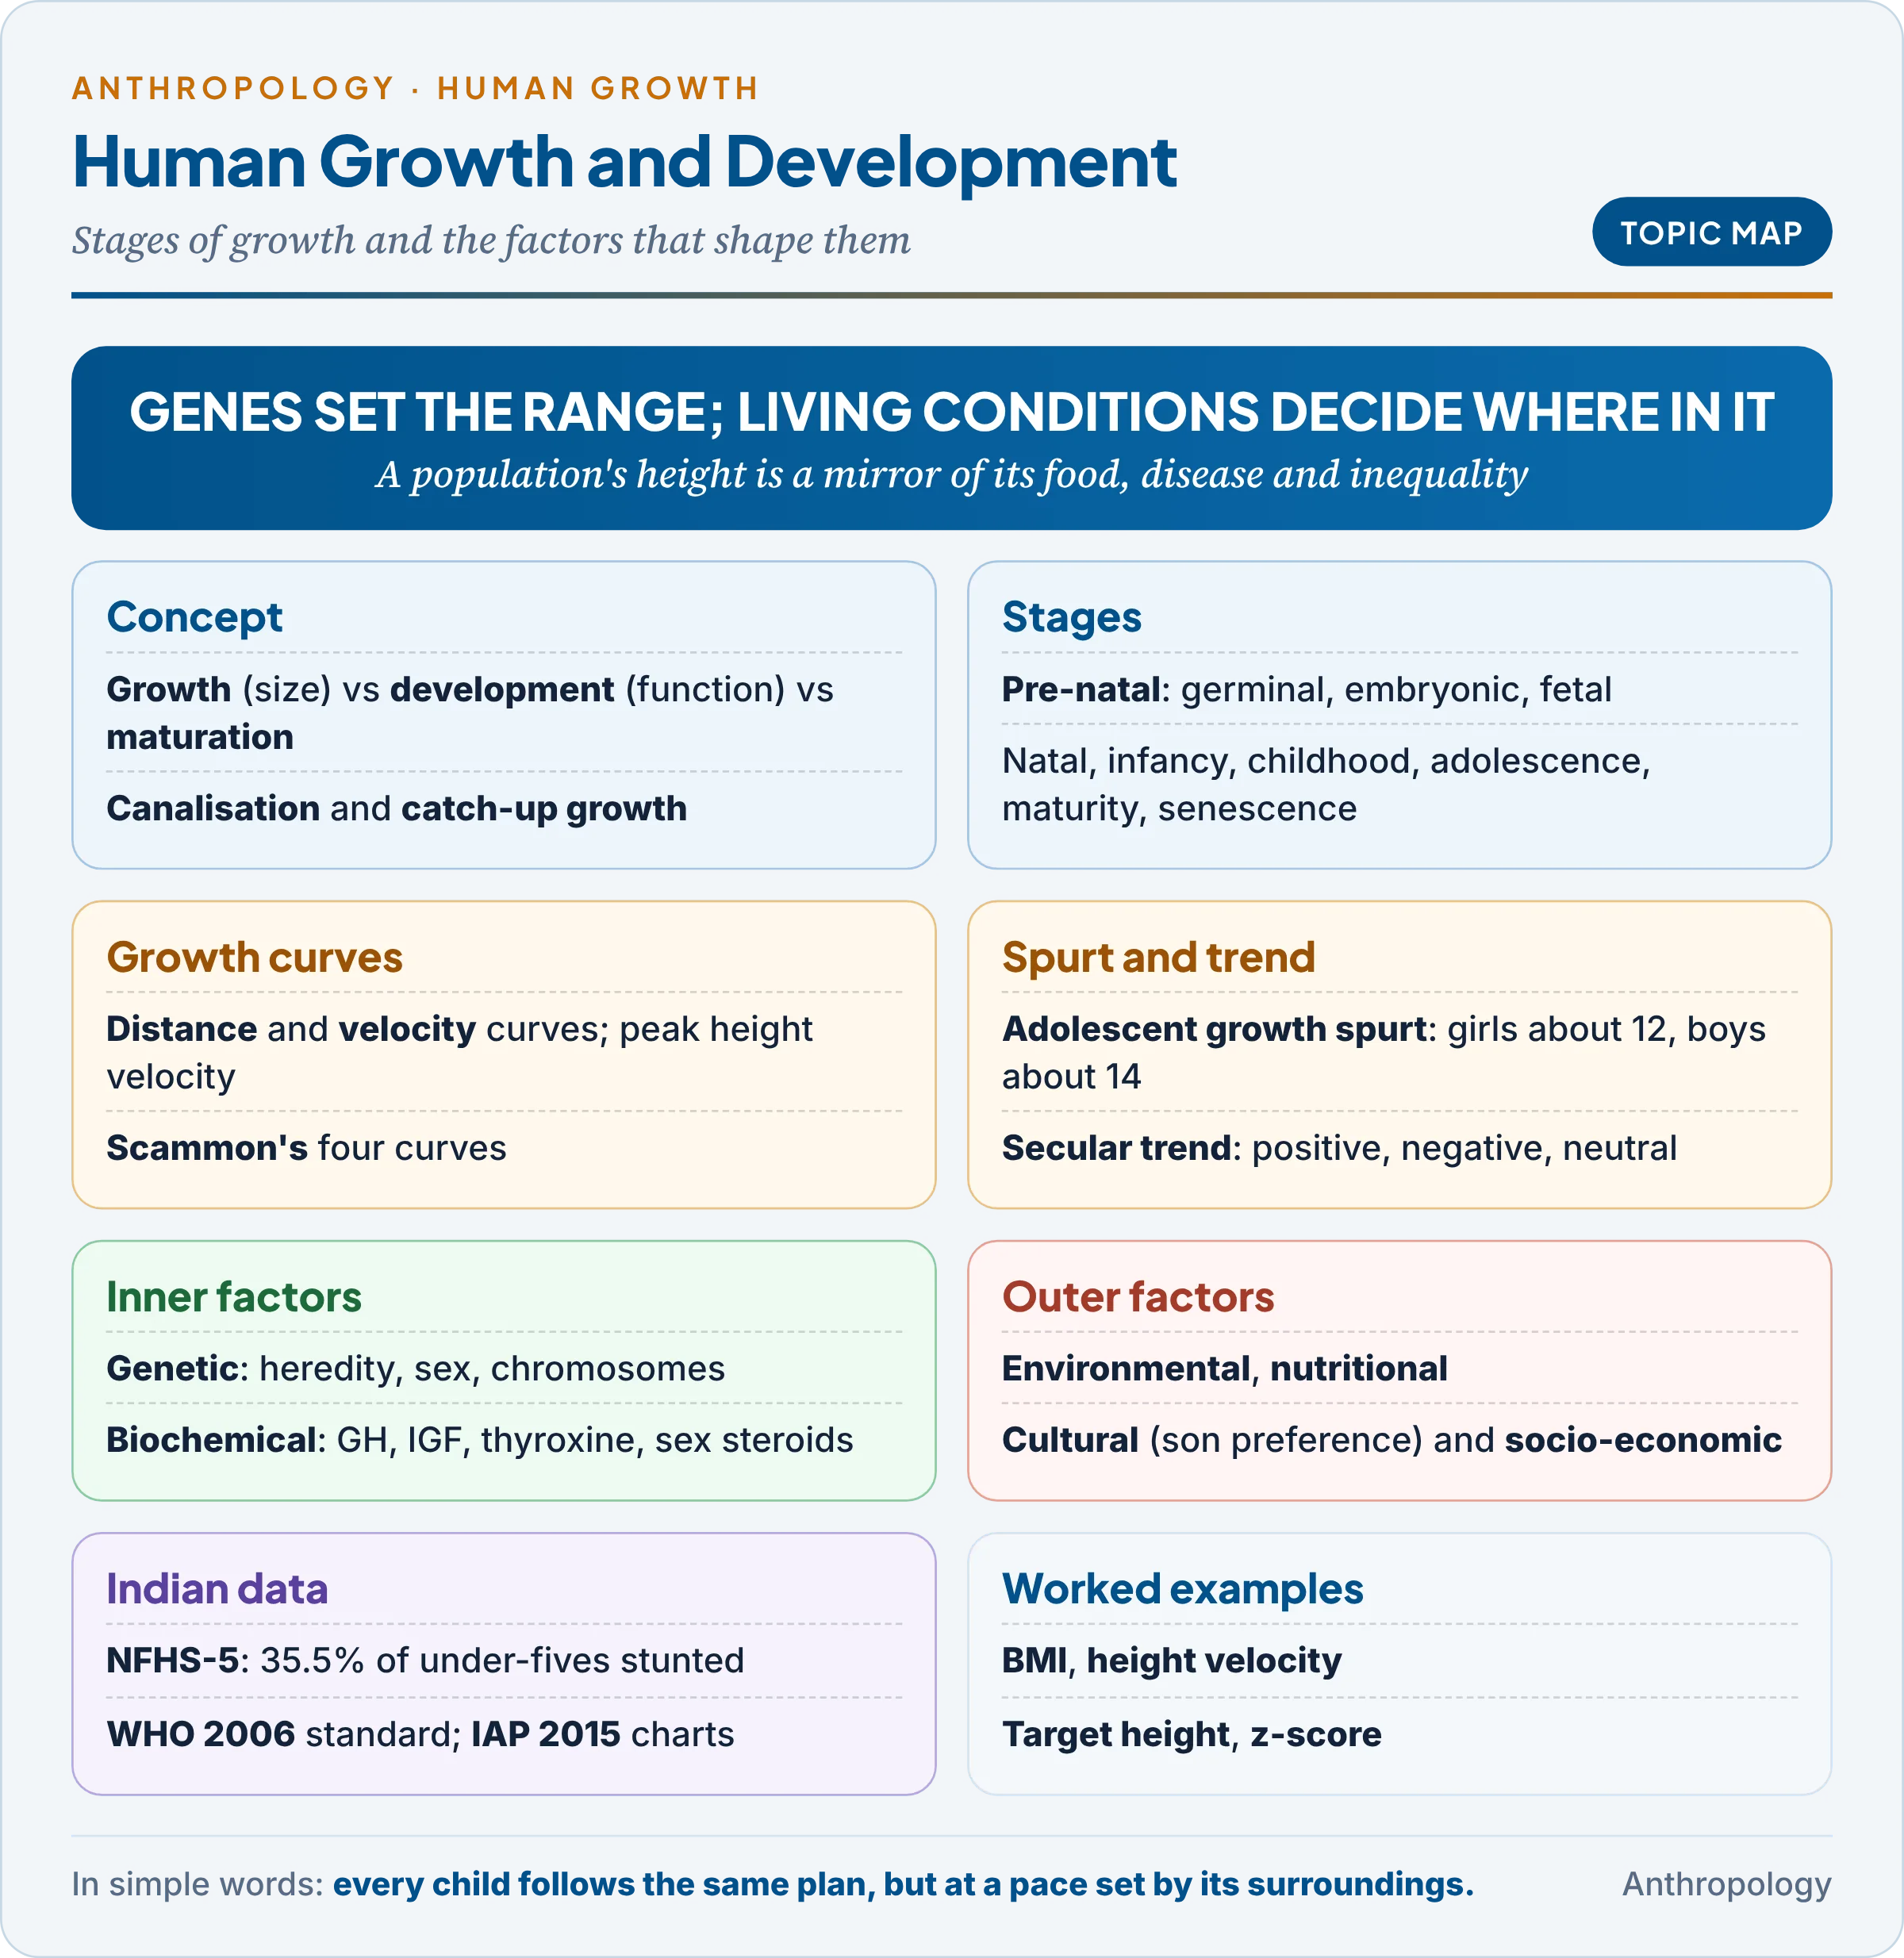
Unit 9 dealt with how human populations differ genetically and adapt to their environments. This unit follows a single human life from conception onwards and asks how the body grows, why it grows in a particular pattern, and why children of the same age differ so much from one population to another. Growth is a sensitive mirror of the conditions of a society: a population’s average height records its food, disease and inequality. Ageing, body types (somatotypes) and the methods of growth study are taken up in Unit 10b.
1. The Concept of Growth and Development
In simple words
Growth means getting bigger: more cells, larger cells, more weight and height. Development means getting more capable: learning to walk, speak and reason as the body’s parts take on special jobs. Both follow an orderly pattern from conception to adulthood, which is why departures from the pattern signal trouble.
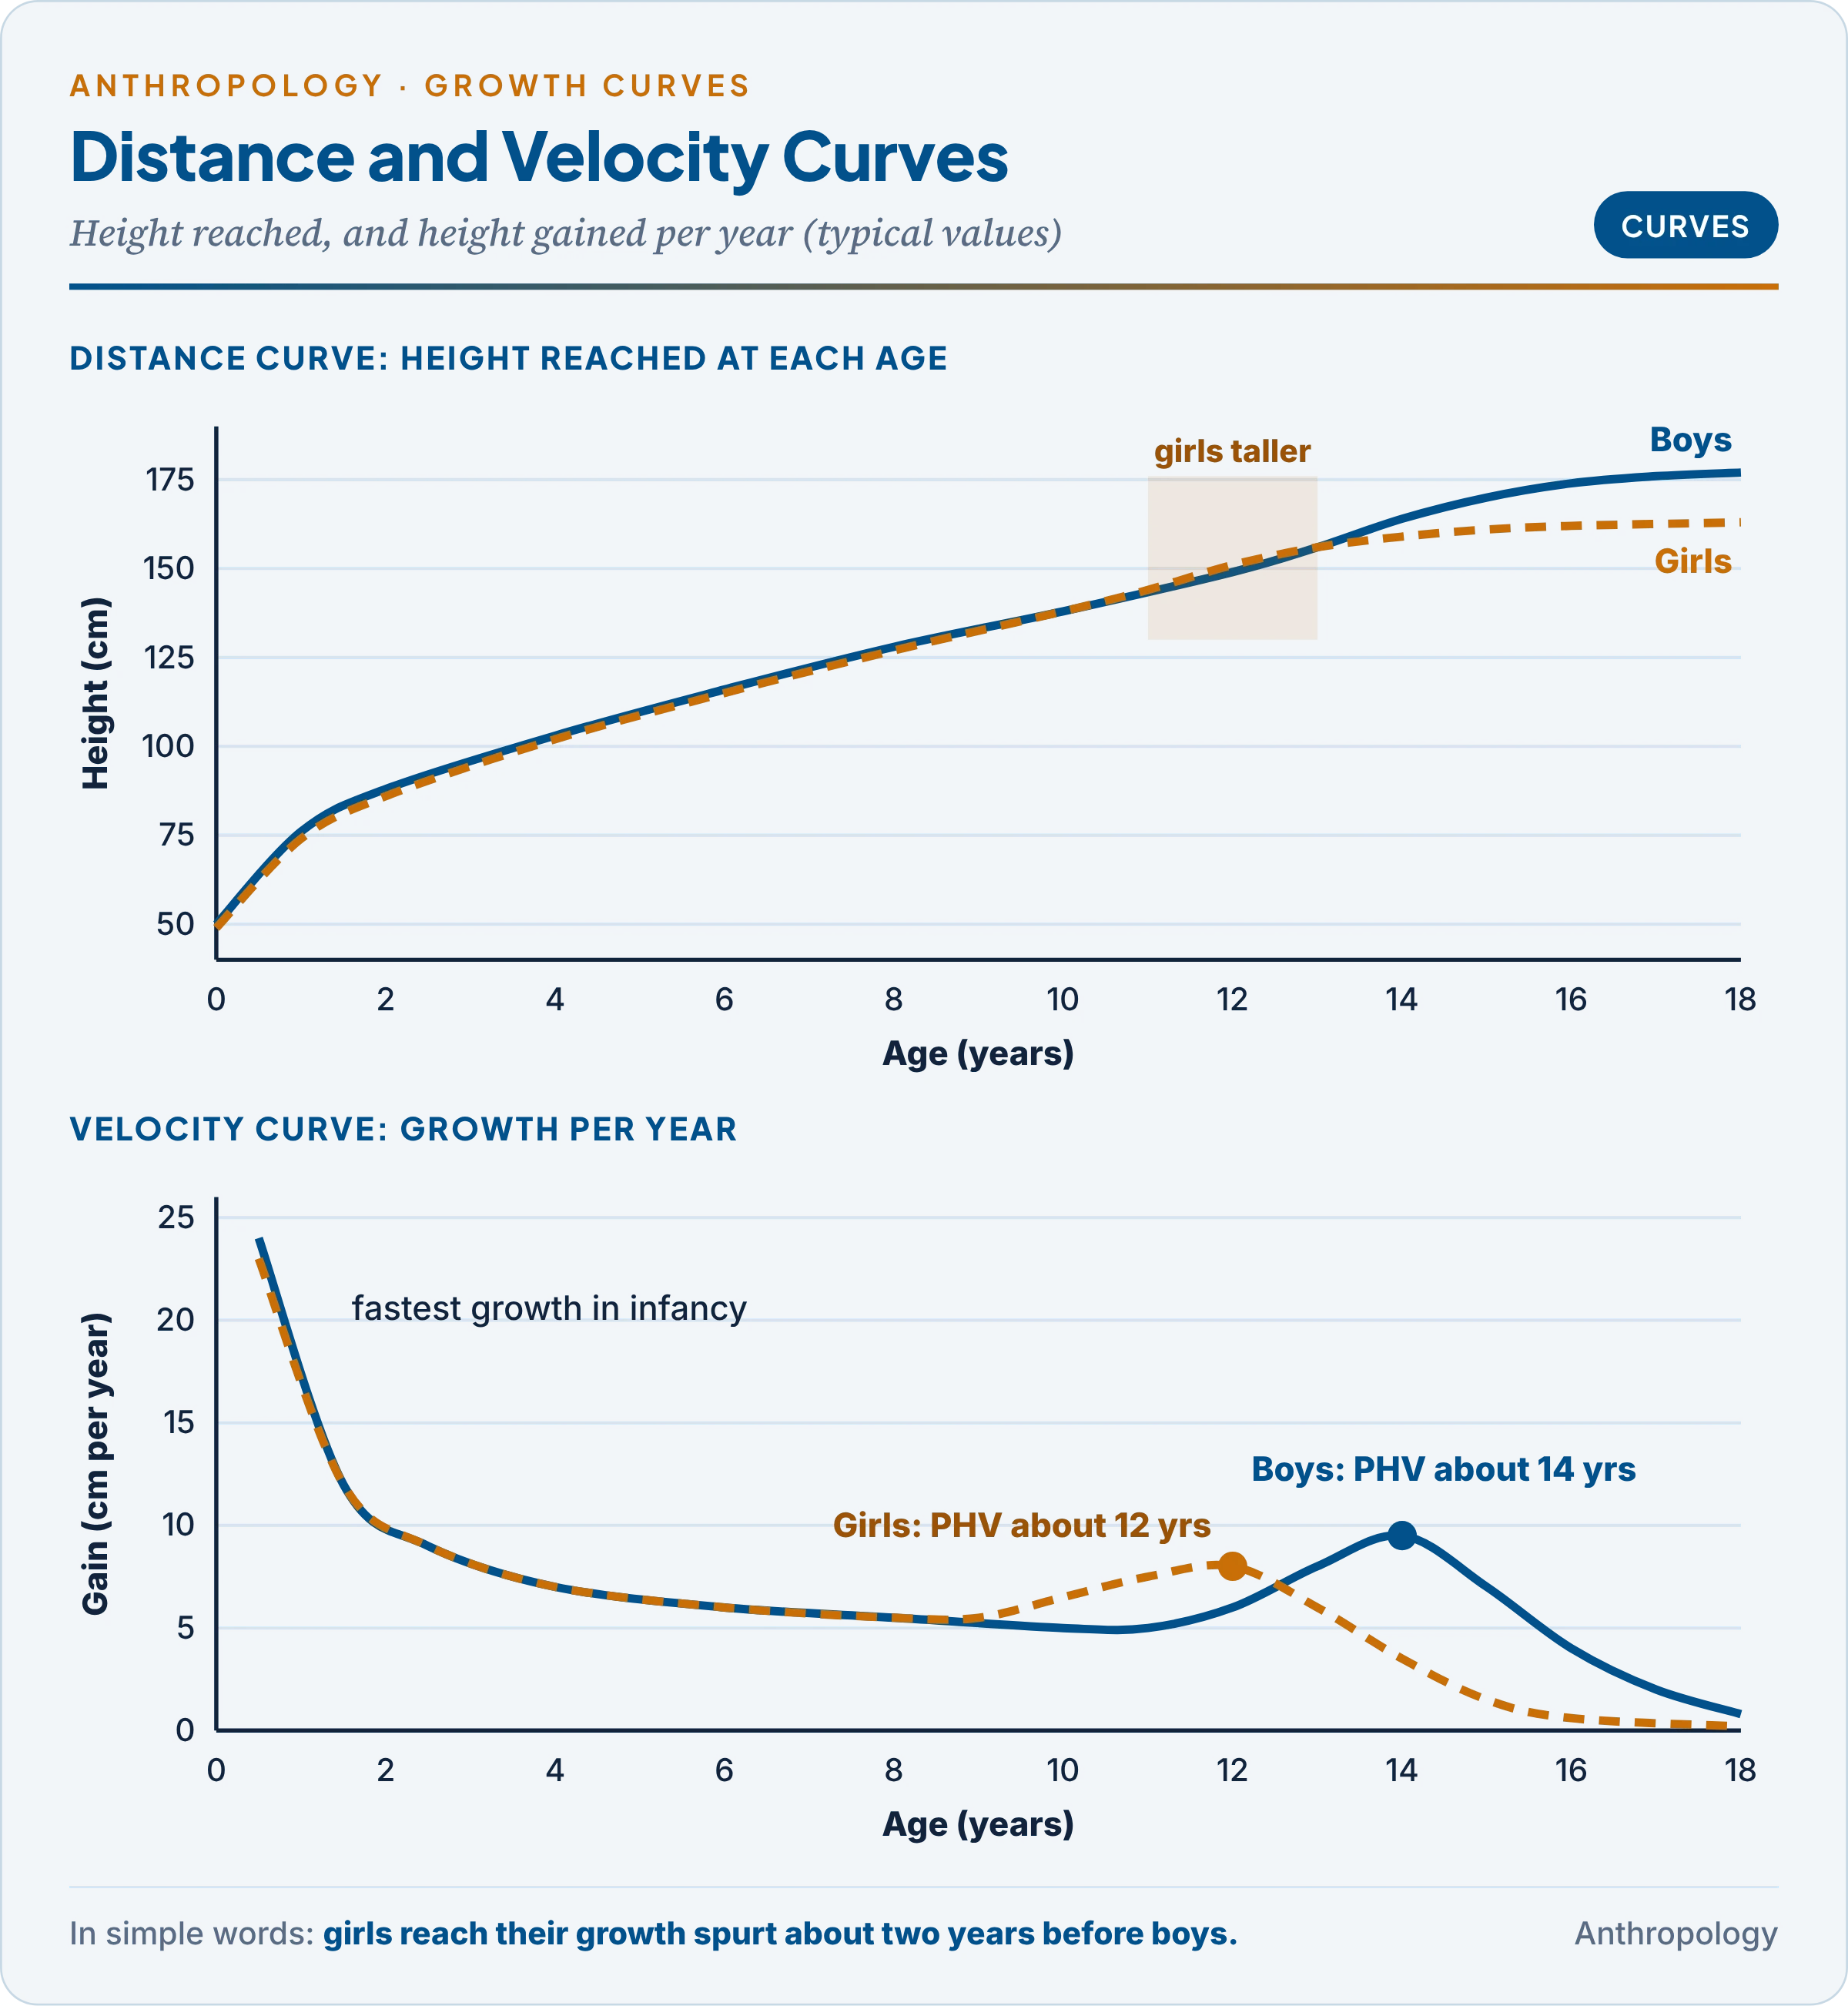
Between 1759 and 1777, the French nobleman Philibert Guéneau de Montbeillard measured his son’s height about every six months from birth to eighteen, and the naturalist Buffon published it: the oldest known record of a child’s growth. Plotted as height against age, it rises steeply in infancy, steadily through childhood, again in the early teens, and then flattens. Plotted as gain per year, it shows the boy grew fastest at birth, slowed through childhood and had a second burst at adolescence. These two drawings of one set of numbers, the distance and velocity curves (§3), are the basic tools of growth study.
1.1 Growth, development and maturation
- Growth is the quantitative increase in the size of the body and its parts. It happens in three ways: hyperplasia (increase in the number of cells by division), hypertrophy (increase in the size of cells) and accretion (increase in material between cells, such as bone matrix).
- Development is the qualitative change towards functional maturity: cells differentiate (specialise into nerve, muscle or bone), organs begin to work, and new abilities appear, such as speech, as unpredictable from what came before as a butterfly from a cocoon.
- Maturation is progress towards the adult state, measured not in years but in biological age: skeletal age (ossification seen on hand-wrist X-rays), dental age (eruption of teeth) and sexual maturity (secondary sex characteristics). Two children of 12 years may differ by three or four years in biological age.
| Basis | Growth | Development |
|---|---|---|
| Nature | Quantitative: more and bigger | Qualitative: more complex and capable |
| Measured by | Height, weight, circumferences | Milestones, skills, IQ, maturity indicators |
| Cellular basis | Hyperplasia, hypertrophy | Differentiation, integration |
| Duration | Largely stops after adolescence | Continues throughout life |
| Example | A child gains 7 cm in a year | A child moves from babbling to sentences |
The two usually go together but can separate: a child can grow tall yet lag in development, which is why check-ups record both growth charts and milestones.
Common confusion
Is growth the same as development? No. Growth is a change in size that can be measured in centimetres and kilograms. Development is a change in function and complexity, such as learning to walk or speak. Growth largely ends with adolescence, while development, including the decline of ageing, continues through life.
1.2 Aspects and principles
- Three aspects interact: physical, intellectual and personality and social; a child who cannot see well may fall behind in reading and in friendships.
- Principles of the pattern:
- Cephalocaudal (“head to tail”): the head develops first. A two-month embryo’s head is half its length, a newborn’s a quarter, an adult’s about an eighth; babies control the head before the trunk and grasp long before they walk.
- Proximodistal (“near to far”): from the centre of the body outwards: trunk before limbs, upper arm before fingers.
- Simple to complex and general to specific: a baby first waves the whole arm, then reaches, then picks up a grain with thumb and finger.
- Individual differences: children pass the same milestones in the same order but at different ages, and the range of differences widens with age as experience and environment add their effects.
1.3 Rate, canalisation and catch-up growth
- Growth velocity (cm per year) reveals a slowing of growth early, before size falls far below the norm.
- Canalisation: the British biologist C. H. Waddington (1940s–1957) described development as a ball rolling down a valley (the “epigenetic landscape“): each child’s growth is held to a genetically set path, or channel, and tends to return to it after being pushed off.
- Catch-up growth: when a period of illness or starvation ends, a child grows faster than normal for its age until it regains its original curve. The term was introduced by Andrea Prader, James Tanner and G. von Harnack (1963). Catch-up may be complete (after a short illness) or incomplete (after long or early deprivation, especially in the first two years). The British paediatrician James Tanner called growth “target-seeking“: the body seems to know where it should be.
- Why this matters: catch-up shows both the strength of genetic control (the target exists) and its limits (if deprivation is severe or early, the target is never reached; the result is stunting).
1.4 Measuring growth and development
- Growth indicators in children: weight-for-age, height-for-age, weight-for-height, head circumference and mid-upper-arm circumference, compared with a reference as percentiles or z-scores (§6).
- Developmental assessment: milestones (social smile at 6–8 weeks, sitting at 6 months, standing at 9–10 months, walking at about 12 months, sentences at 2 years) and, for intellectual development, the intelligence quotient: IQ = mental age ÷ chronological age × 100.
2. Stages of Growth
In simple words
Human life passes through stages: development in the womb, birth, infancy, childhood, adolescence, adulthood and old age. Each stage has its own speed of growth and its own new abilities. Humans also have unusually long childhood and adolescence compared with other primates.
The stages below follow the syllabus line. Ages are approximate, and different schemes draw the boundaries differently.

2.1 Pre-natal stage (conception to birth, about 38 weeks)
Germinal stage (fertilisation to about 2 weeks)
- Fertilisation takes place in the ampulla of the fallopian tube, forming the zygote. Rapid cell division (cleavage) produces a solid ball of cells, the morula, by about day 3–4.
- Fluid collects inside it to form the blastocyst: an outer layer, the trophoblast (which will form the placenta), and an inner cell mass (which will form the embryo). The blastocyst reaches the uterus after a journey of 3–4 days and implants in the uterine wall during the second week.
- The inner cell mass becomes a two-layered embryonic disc (ectoderm and endoderm); a third layer, the mesoderm, forms between them. The amnion (the fluid-filled sac), the yolk sac and the chorion form around it; the primitive streak and then the notochord appear, and the neural plate that will form the brain and spinal cord.
| Germ layer | Gives rise to |
|---|---|
| Ectoderm | Skin (outer layer), hair, nails, tooth enamel, brain, spinal cord and nerves, sense organs |
| Mesoderm | Muscles, skeleton, heart and blood vessels, kidneys, gonads, inner skin layer |
| Endoderm | Lining of the digestive and respiratory tracts, liver, pancreas, thyroid |
Embryonic stage (about 3 to 8 weeks)
- Organogenesis: nearly all organs form; the heart beats by about the fourth week.
- Sex determination: in an XY embryo, the SRY gene on the Y chromosome directs the gonads to become testes, whose hormones (testosterone) masculinise the body; in an XX embryo, ovaries develop.
- The critical period: because organs are forming, the embryo is most vulnerable to teratogens (agents that cause birth defects). The sedative thalidomide (about 1957–61) caused thousands of babies to be born with phocomelia (flipper-like limbs); rubella damages the heart, eyes and ears. Most structural defects arise in the first trimester.
Fetal stage (about 9 weeks to birth)
- From the appearance of the first bone cells at about 8 weeks, the embryo becomes a fetus. Organs mature and begin to work; the fetus grows about 20 times in length.
- Peak growth velocity of the fetus is reached at about 18–20 weeks for length and about 34 weeks for weight, when fat is laid down. A coating of vernix caseosa (a waxy layer) protects the skin.
- Birth size reflects the mother’s environment more than the child’s genes: the size of the uterus and the mother’s nutrition limit fetal growth. A large-breed foal carried by a small-breed mare is born small (Walton and Hammond’s horse crosses, 1938), and so are human babies of undernourished mothers.
2.2 Natal stage (birth and the newborn)
- Birth occurs at about 280 days from the last menstrual period. Labour has three stages: dilation of the cervix (the longest, 12–24 hours in a first birth), expulsion of the baby, and delivery of the placenta.
- Definitions (WHO): preterm birth before 37 completed weeks; low birth weight below 2,500 g; the neonatal period is the first 28 days; the perinatal period runs from 22 completed weeks of pregnancy to 7 days after birth.
- Transition to independent life: the baby must breathe, switch its circulation from placenta to lungs, keep warm (using fat laid down late in fetal life) and digest milk. The Apgar score (Virginia Apgar, 1952) rates colour, heart rate, reflexes, tone and breathing at 1 and 5 minutes.
- The newborn: about 50 cm long; loses up to about 10 per cent of birth weight in the first days (mostly fluid) and regains it by 10–14 days; the skull bones are separated by soft spots (fontanelles) that let the head mould during birth and close by about 18 months.
2.3 Infancy (birth to about 1 year; sometimes extended to 2–3 years)
- Fastest growth after birth: weight doubles by about 5 months and triples by 1 year; length increases by about 50 per cent in the first year (about 50 to 75 cm). Peak postnatal weight velocity comes in the first two months.
- Brain growth: the brain is about 25 per cent of adult weight at birth and about 75 per cent by age 2; neurons grow and form synapses rapidly. At birth the chest circumference is smaller than the head; the two are about equal by one year.
- Reflexes present at birth, whose disappearance shows the brain maturing: rooting (turning towards a touch on the cheek), sucking, Moro (throwing out the arms at a sudden noise), palmar grasp, stepping and Babinski (toes fanning out when the sole is stroked).
- Teeth: the first milk tooth erupts at about 6 months; all 20 milk teeth are present by about 2½ years.
| Age | Motor | Speech and social |
|---|---|---|
| 6 weeks | Head control begins; follows objects | Social smile |
| 6 months | Sits without support; palmar grasp | Babbles; turns to sound |
| 9 months | Stands with support; crawls; pincer grip | Fear of strangers; responds to name |
| 12 months | Walks alone; neat pincer grip | Single words; waves bye-bye |
| 18 months | Runs; feeds self | Several words |
| 2 years | Climbs stairs | Two- or three-word sentences |
| 3 years | Hops on one foot | Shares toys; understands negatives |
2.4 Childhood (about 1 to 10–12 years)
- Early childhood (toddler 1–3; preschool 3–6 years): the chubby infant becomes slender, the head proportionately smaller; motor skills advance fast (hopping at 4, jumping about a metre at 5) and sentences grow complex.
- Middle childhood (6–12 years): steady, slower growth of about 5–6 cm and 2–3 kg a year, with a small mid-growth spurt at about 6–8 years; the permanent teeth begin to replace milk teeth from about 6; intellectual and social growth is substantial.
- A human speciality: the American anthropologist Barry Bogin (Patterns of Human Growth, 1999) argued that humans have two stages other primates lack. Childhood (about 3–7 years), when the young are weaned but still need specially prepared food and care, lets mothers wean early and have the next baby sooner. Adolescence (§2.5) is the other. Bogin’s five stages are infancy, childhood, juvenile, adolescence and adulthood.
- Dental stages: the primatologist Adolph Schultz divided postnatal life by the teeth: infancy until the first permanent molar, juvenile until the last permanent tooth, then adulthood.
- Childhood as culture: the American anthropologists Beatrice Whiting and Carolyn Edwards (Children of Different Worlds, 1988) classified children by where they spend their time: lap children (infants), knee children (toddlers), yard children (preschoolers) and community children (school-age), showing that each society organises growth socially as well as biologically.
2.5 Adolescence (about 10 to 19 years)
- Puberty is the biological process leading to sexual maturity; adolescence is the wider biological, psychological and social transition from childhood to adulthood. It has been said that adolescence “begins in biology and ends in culture“.
- Hormonal trigger: the hypothalamus releases gonadotropin-releasing hormone (GnRH); the pituitary then secretes FSH and LH; the gonads respond with oestrogen (ovaries) or testosterone (testes). Puberty may be triggered when body weight or body fat reaches a critical level: the American scientist Rose Frisch (1970, 1974) proposed a critical weight, later a critical fat proportion, for menarche (the first menstruation).
- Timing: girls begin about two years earlier than boys (girls about 9–10 years, boys about 11–12), with wide normal variation (girls 7–14, boys 9–16).
- Sequence: in girls, breast budding comes first, then pubic hair, the growth spurt, and menarche late in the sequence (about 12–13 years in well-nourished populations), after peak growth. In boys, enlargement of the testes comes first, then pubic hair, penile growth, voice change, the growth spurt and facial hair. The British paediatricians W. A. Marshall and James Tanner (1969, 1970) defined five Tanner stages for these changes.
- Sex differences in form: boys develop broader shoulders, longer legs relative to the trunk and more muscle; girls develop a wider pelvis and more subcutaneous fat. Before the spurt boys are only about 2 per cent taller than girls; for a few years girls are taller; after the spurt men are about 8 per cent taller.
- Culture shapes adolescence: among the Tahitians, the American anthropologist Robert Levy (1973) described a recognised period of adventurous, rebellious youth (taure’are’a) in a culture that otherwise prizes gentleness; Margaret Mead’s Samoan study (Unit 6g) asked whether adolescent turmoil is biological or cultural.
2.6 Maturity (adulthood)
- Growth in height stops when the epiphyses (growth plates at the ends of long bones) fuse with the shafts, at about 18 years in women and 21 in men.
- Young adulthood (20–40): strength peaks at about 25–30 years; senses are sharpest; decline thereafter is gradual (about a 10 per cent loss of strength between 30 and 60).
- Middle adulthood (40–65): presbyopia (difficulty focusing on near objects), presbycusis (loss of high-frequency hearing), slower reactions; menopause (about 51 on average in Western women) and a gradual male climacteric.
2.7 Senescence
- Senescence is the period of declining body function associated with ageing; its onset and speed vary greatly between individuals. Senses dull, bones thin (osteoporosis), and the heart and lungs lose reserve capacity (the extra effort, four to ten times normal, that organs can produce in emergencies), so older people cope less well with stress, heat, cold and accidents.
- Primary ageing is gradual and inevitable; secondary ageing results from disease, abuse and disuse and can often be prevented by diet and exercise. Theories of ageing and longevity are treated in Unit 10b.
3. Growth Curves, the Adolescent Spurt and the Secular Trend
In simple words
Growth can be drawn in two ways: total height at each age, or how much height is gained each year. Different parts of the body follow different timetables: the brain grows early, the reproductive organs late. Over the last 150 years, children in many countries have become taller and matured earlier, because living conditions improved.
3.1 Distance and velocity curves
- Distance curve: the attained size at each age (height for age). For height it is S-shaped (sigmoid): steep in infancy, steady in childhood, a second rise in adolescence, then a plateau.
- Velocity curve: the rate of growth (cm per year) at each age. It is high at birth and falls steeply in infancy, declines slowly in childhood, rises to the peak height velocity (PHV) in adolescence and falls to zero in adulthood.
- Why the velocity curve is more revealing: small differences in timing, hidden in the distance curve, stand out as separate peaks. Two children of the same height may be at opposite points of the spurt.
Common confusion
Is catch-up growth a secular trend? No. Catch-up growth happens within one child’s life: faster growth after an illness or hunger ends. A secular trend is a change between generations: today’s children taller or earlier-maturing than their parents were at the same age.
3.2 Scammon’s curves
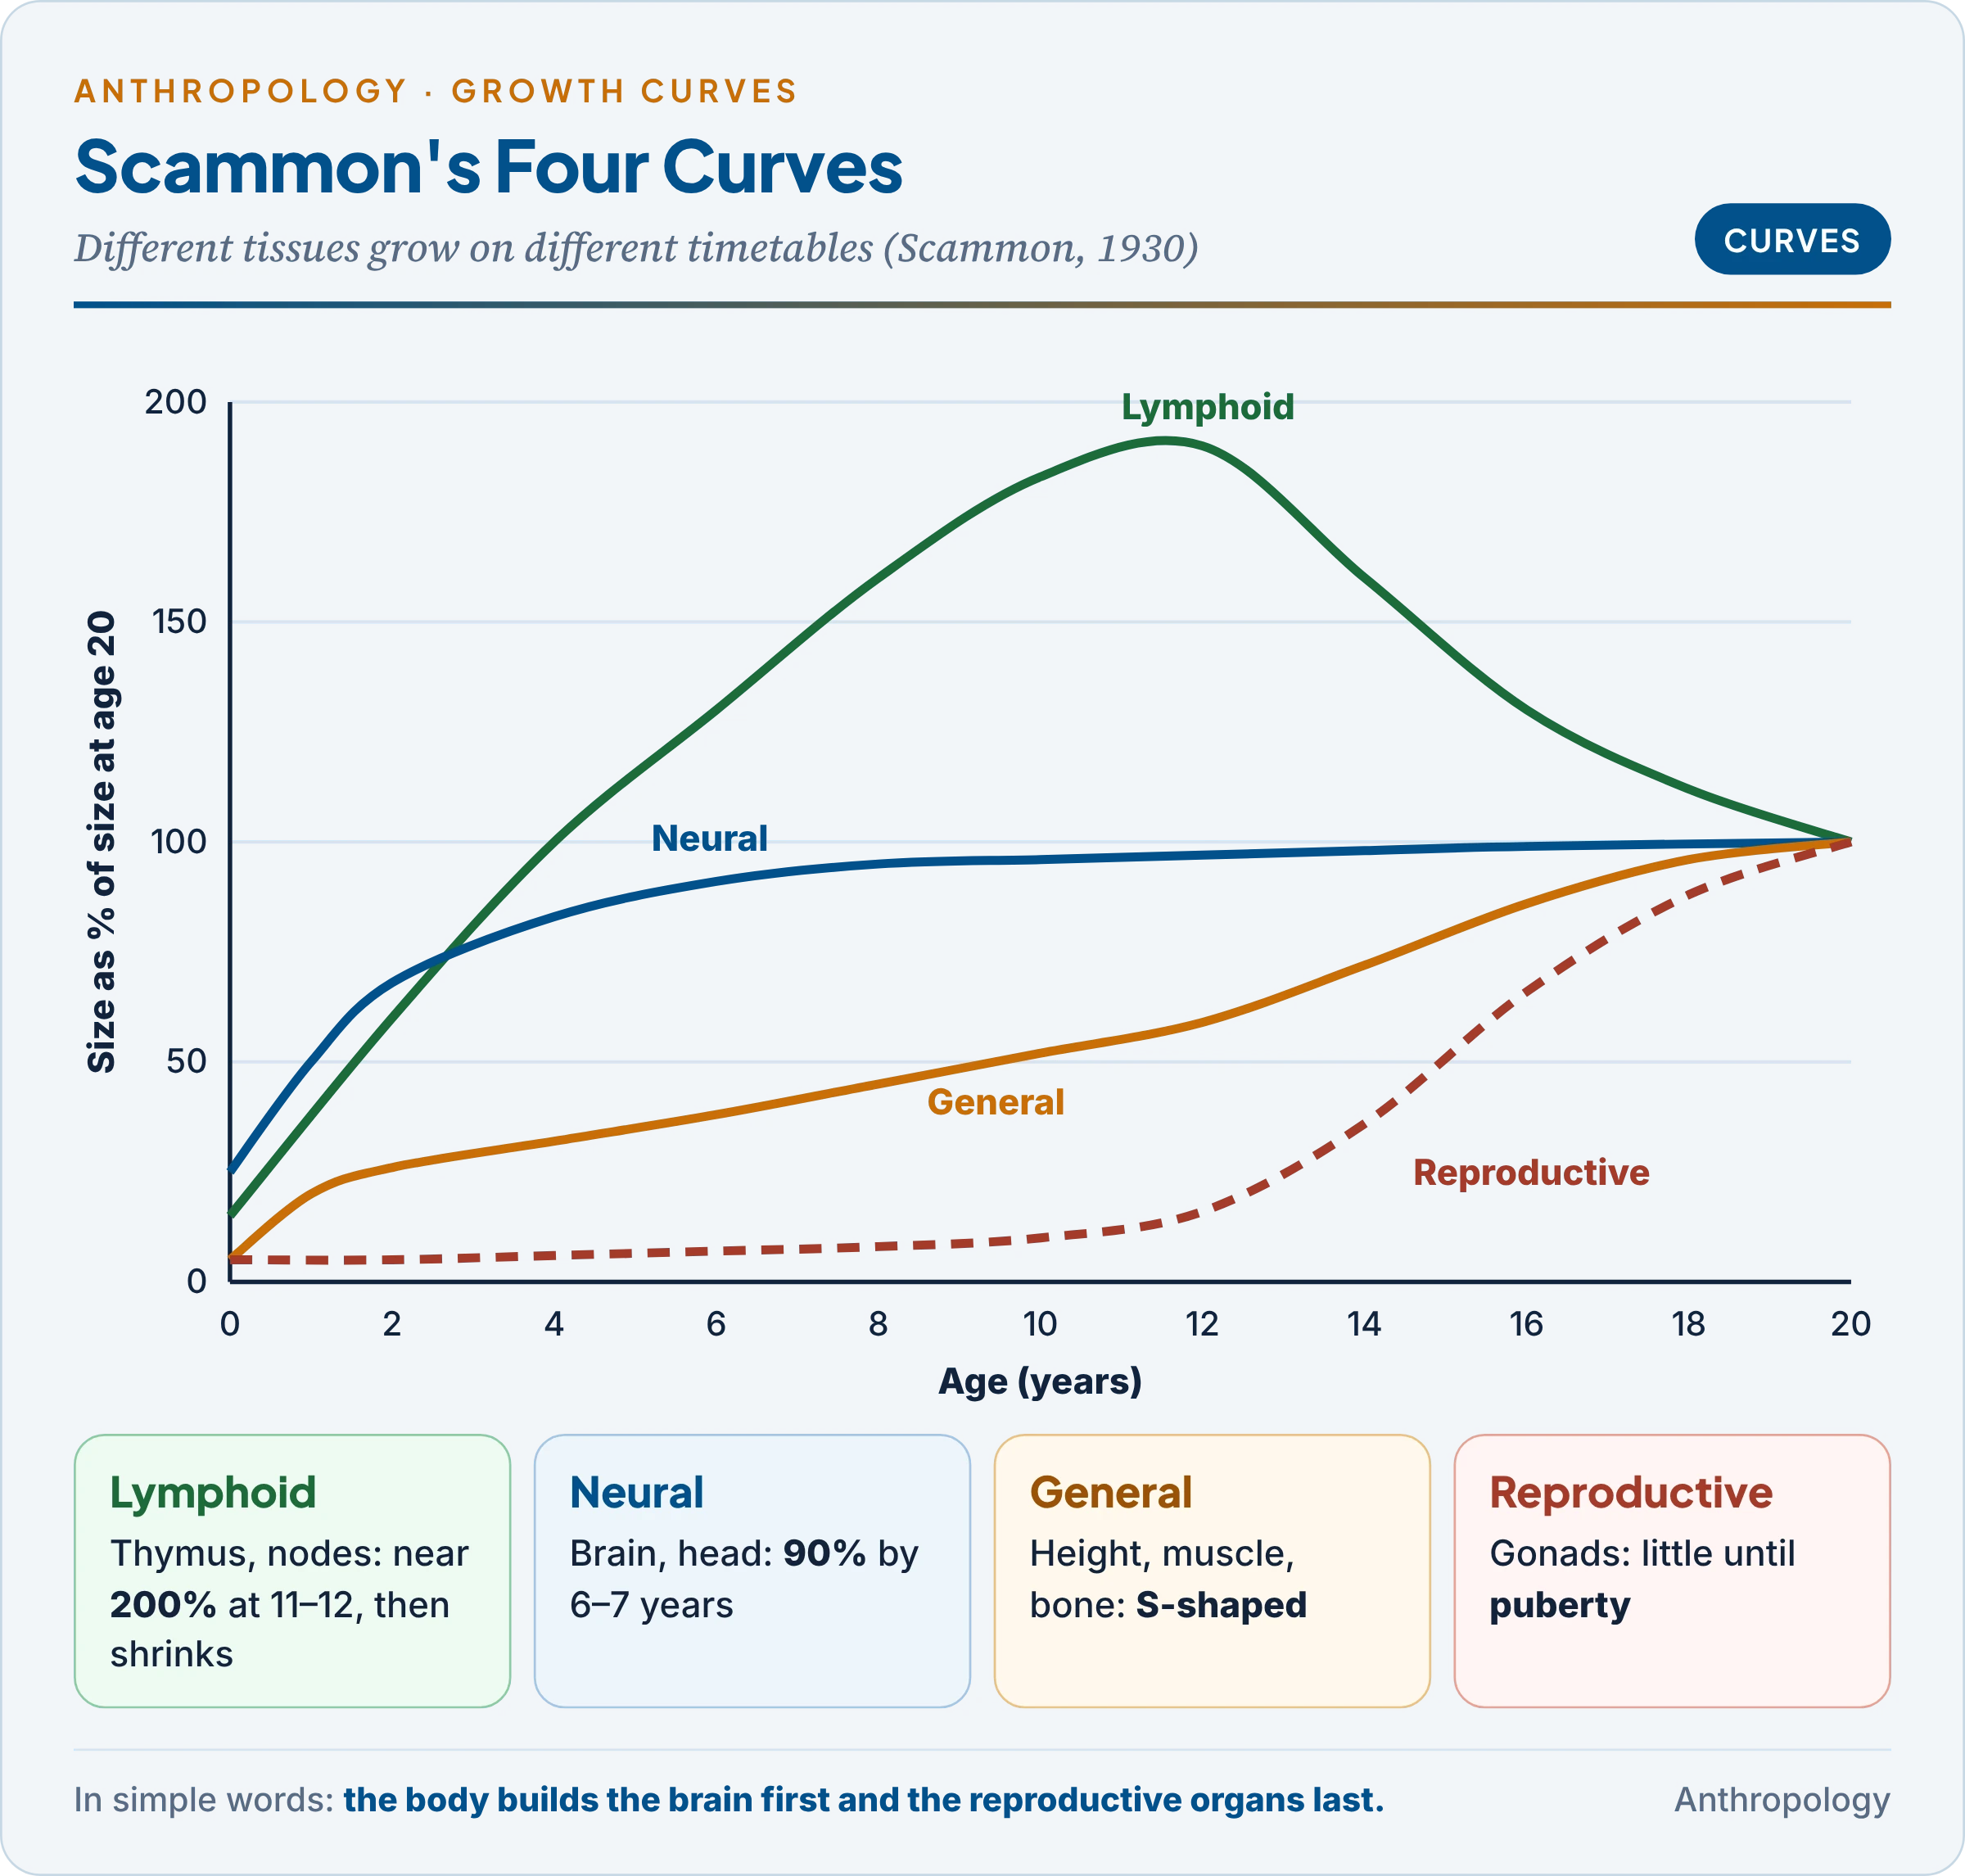
The American anatomist Richard Scammon (1930) showed that body tissues follow four different growth patterns, each drawn as a percentage of its size at age 20.
| Curve | Tissues | Pattern |
|---|---|---|
| General (somatic) | Height, muscles, bones, most organs, blood volume | S-shaped: fast in infancy, steady in childhood, adolescent spurt |
| Neural | Brain, spinal cord, eyes, head | Very early: about 90 per cent of adult size by 6–7 years |
| Lymphoid | Thymus, lymph nodes, tonsils | Rises to nearly 200 per cent of adult size at about 11–12 years, then declines |
| Reproductive (genital) | Testes, ovaries, uterus, prostate | Little growth until puberty, then a steep rise |
What the curves mean: the body invests first in what is needed first. The brain grows early because learning starts at birth; the lymphoid system peaks in childhood, when exposure to new infections is greatest; reproduction is postponed until the body is large enough to support it. The curves also explain why early malnutrition harms the brain more than later malnutrition: the neural curve is almost complete by school age.
3.3 The adolescent growth spurt
- What it is: a sharp acceleration of growth in height, weight and almost all skeletal and muscular dimensions at puberty, lasting about two years.
- Timing and size: in girls it begins at about 9½–14½ years, with PHV at about 12 years of about 8 cm a year; in boys at about 10½–16 years, with PHV at about 14 years of about 9–10 cm a year. The boys’ spurt is later and larger; the extra two years of pre-pubertal growth plus a stronger spurt explain most of the adult sex difference in height.
- Order of parts: hands and feet first, then calves and forearms, then hips and chest, then shoulders, and the trunk last; Tanner noted that a boy grows out of his trousers before his jacket. The temporary disproportion causes teenage awkwardness.
- Body composition: boys gain muscle and heart-lung capacity; girls gain fat. Menarche follows PHV by about a year.
- Hormones: sex steroids raise growth hormone secretion and drive the spurt, then close the epiphyses, ending growth: an early puberty gives an early spurt but often a shorter adult.
- Evolutionary meaning: Bogin argued that a skeletal growth spurt is unique to humans among primates. It lets young people learn adult skills while still small, then reach adult size quickly.
3.4 The secular trend
A secular trend is a change in growth or maturation across generations (from the Latin saeculum, an age).
- Positive: better conditions bring taller adults, larger children and earlier maturation. Average age at menarche in Norway fell from about 17 years in the 1840s to about 13 in the 1950s. Dutch men gained over 15 cm in a century and are now among the world’s tallest.
- Negative: worse conditions reverse the trend. In India, an analysis of NFHS data (Choudhary, Das and Ghodajkar, 2021) found that the average height of men aged 15–25 fell by about 1.1 cm between NFHS-3 (2005–06) and NFHS-4 (2015–16), and that Scheduled Tribe women aged 15–25 and women of the poorest households also became shorter.
- Neutral: once conditions let genetic potential be reached, the trend plateaus, as adult height has in the Netherlands and Scandinavia.
- Causes of the positive trend: better nutrition (especially protein and energy in early childhood), control of infectious disease (vaccination, sanitation, clean water), smaller families, less child labour, and heterosis from more marriages outside small, inbred communities (Unit 9.3).
- Why age at menarche has fallen: better nutrition and higher body fat bring girls to the threshold earlier; fewer childhood infections leave more energy for growth; urban life and psychosocial stress may also contribute. The fall has slowed or stopped where nutrition is already good, which shows that the earlier decline was environmental rather than genetic.
4. Factors Affecting Growth and Development
In simple words
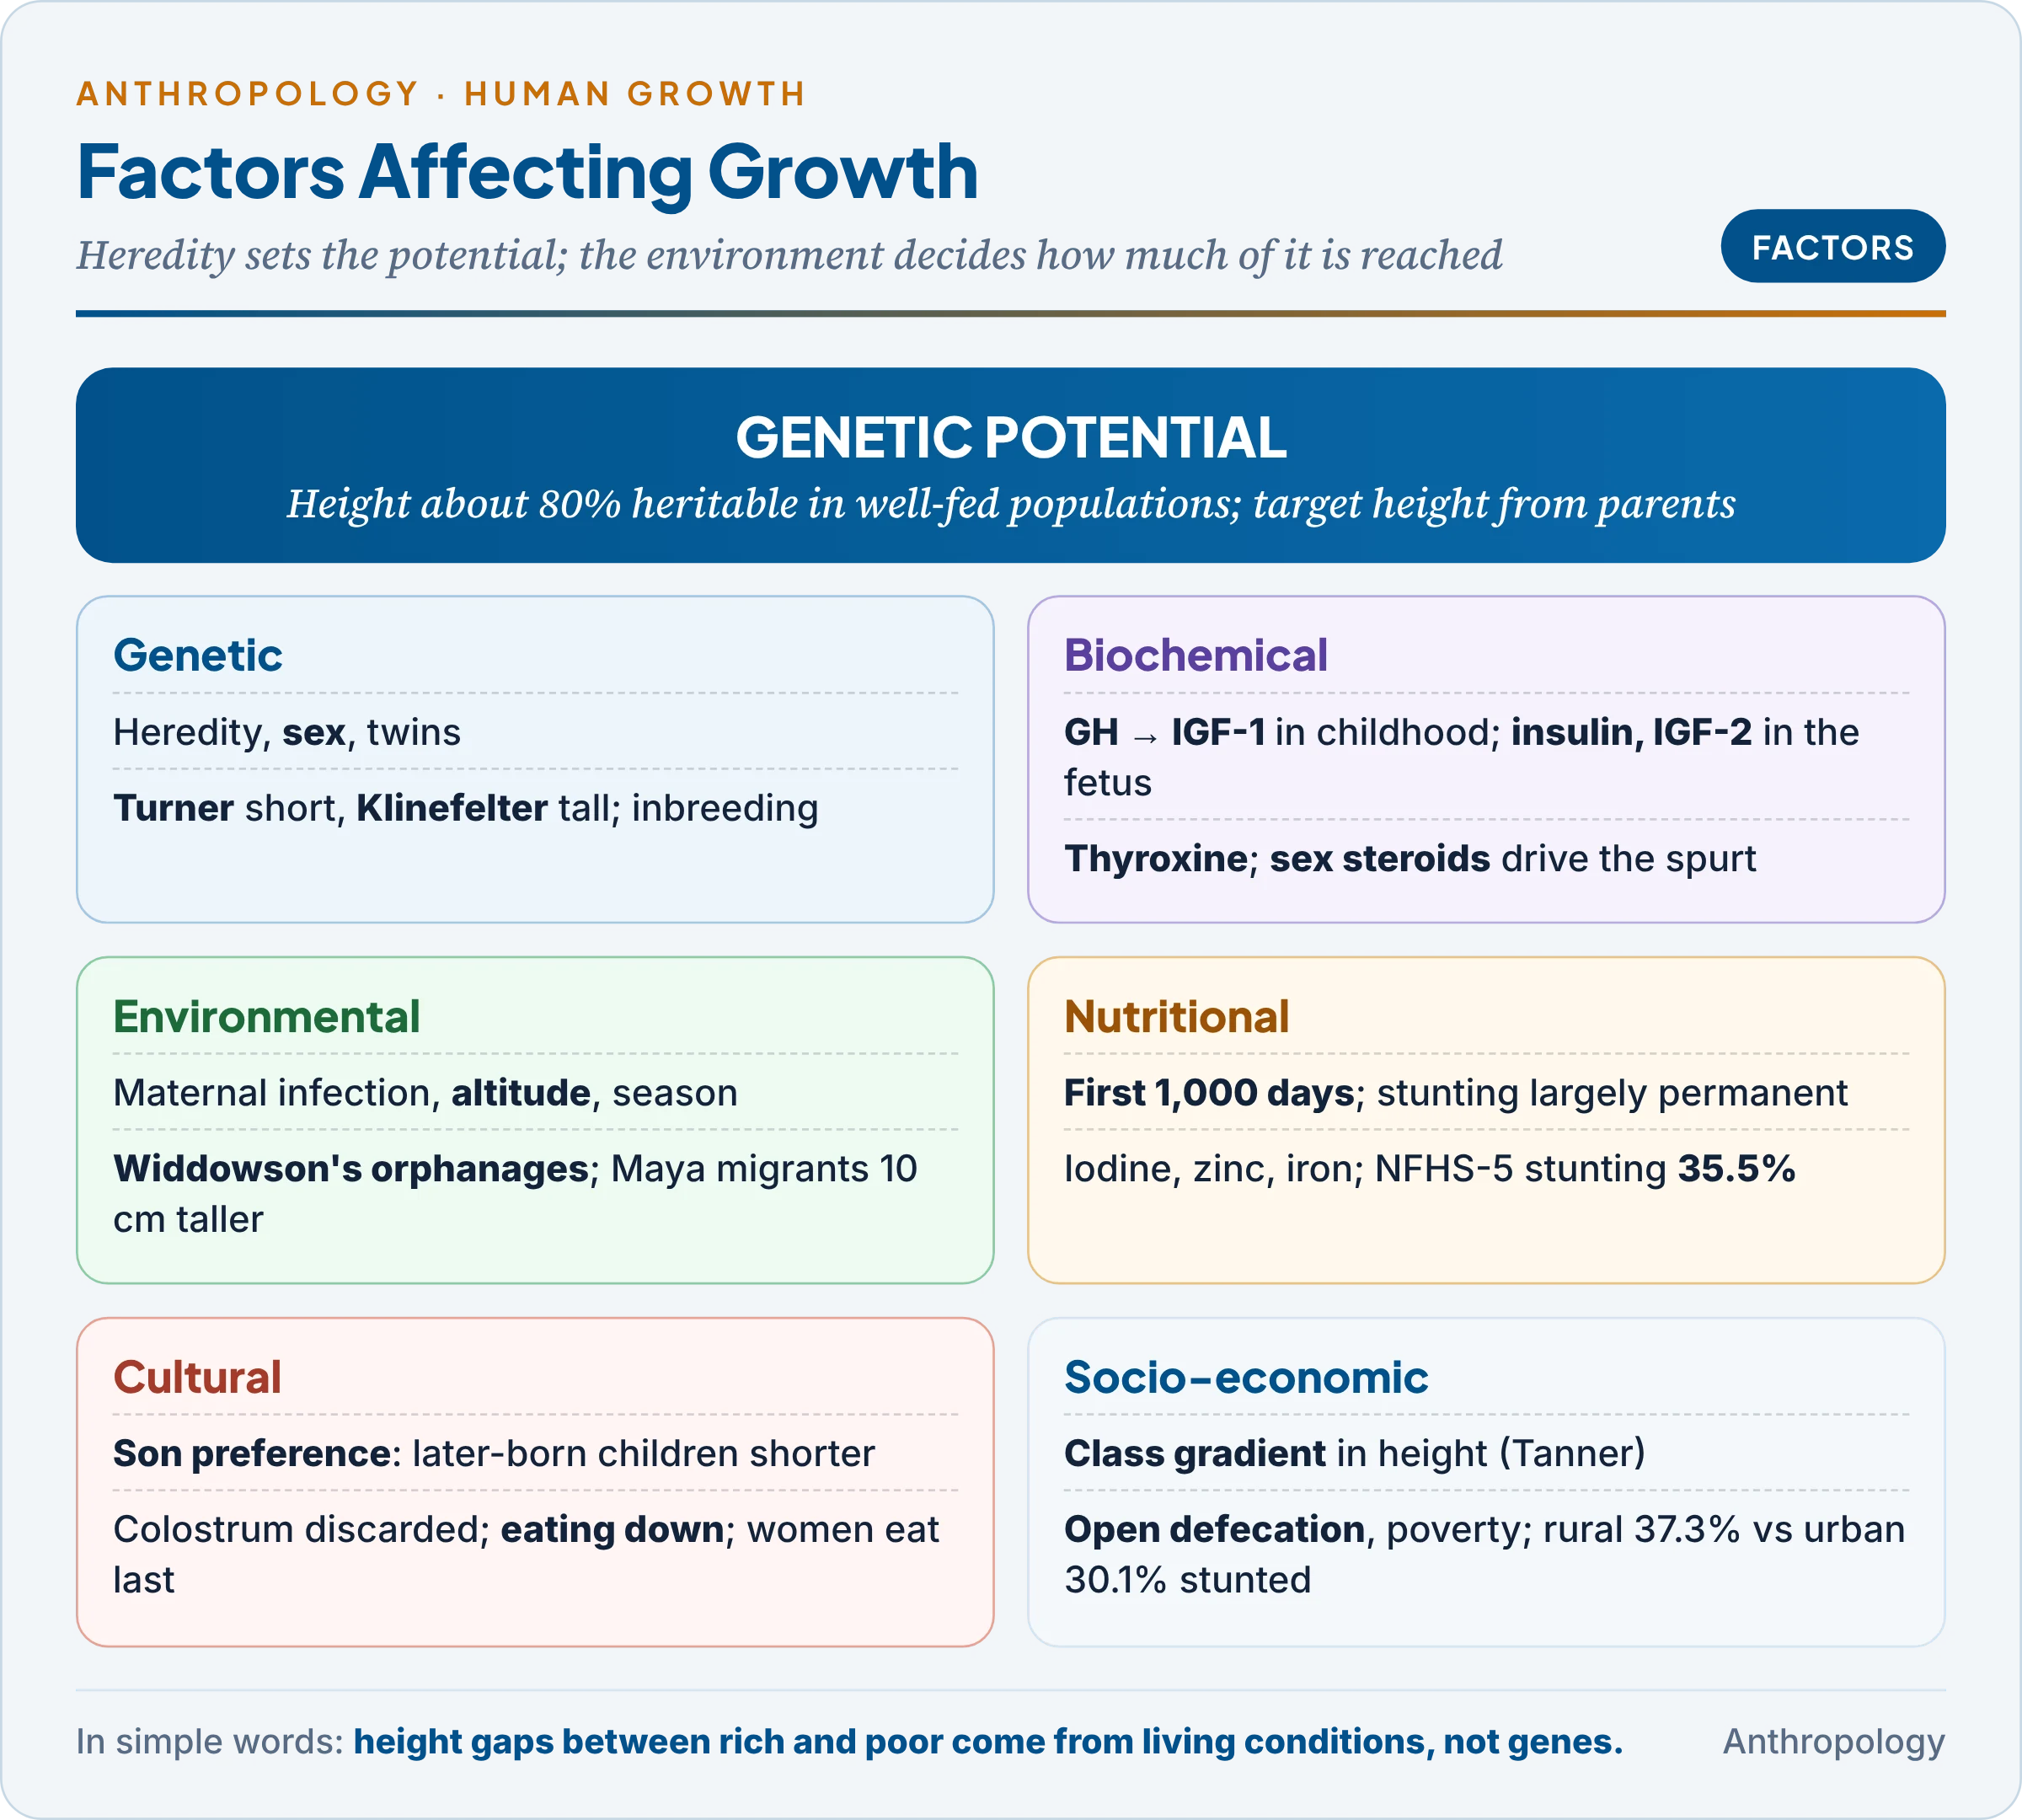
Genes set the range of growth a child can reach, but food, disease, hormones, family care, culture and income decide where in that range the child actually ends up. Most of the difference in height between rich and poor children, and between many countries, comes from these environmental factors rather than from genes.
India’s children are, on average, shorter than children in many poorer countries of sub-Saharan Africa. The economists Seema Jayachandran and Rohini Pande (American Economic Review, 2017) compared data on over 1,68,000 children and found that first-born Indian children are no shorter than African first-borns; the Indian disadvantage appears with the second child and grows with each later birth. They traced it to eldest-son preference: families invest heavily in a first son, and later-born children, especially girls born before a son arrives, receive less care before and after birth. The gap is smaller in matrilineal Kerala and the Northeast. A kinship value, not a gene, shortens millions of children.
4.1 Genetic factors
- Heredity sets the potential: in well-fed populations about 80 per cent of the variation in adult height is heritable. Tall parents tend to have tall children, which is why paediatricians estimate a child’s target height from the parents’ heights (§6). Identical twins grow more alike than fraternal twins; daughters’ age at menarche resembles their mothers’; the Y chromosome sets the male pattern of later, larger growth; and heredity also times dental eruption, skeletal maturity and other biorhythms.
- Genes switched on in sequence: growth requires DNA replication, transcription to messenger RNA and translation to protein, all controlled by transcription factors. Housekeeping genes make proteins every cell needs; luxury (tissue-specific) genes are active only in particular cells, such as insulin genes in the pancreas. One part of the embryo releases inducers that switch on development in neighbouring parts; master homeotic (Hox) genes lay down the head-to-tail body plan.
- Chromosomal and single-gene disorders alter growth: Turner syndrome (45,X) gives short stature; Klinefelter syndrome (47,XXY) tall stature; Down syndrome short stature and delayed development; achondroplasia (a dominant mutation) disproportionate dwarfism (Units 9.2 and 9.4).
- Inbreeding: offspring of consanguineous marriages show more congenital anomalies, fetal loss and illness in Indian hospital studies, and in some studies slightly smaller size (inbreeding depression; Unit 9.3).
- Population differences: some differences in growth pattern between populations are genetic (the short stature of some African forest foragers is linked to their growth-hormone pathway). But an older claim that “Caucasoids grow fastest and Mongoloids slowest” confuses genes with conditions. When children from well-off families are compared, those of different ethnic origins grow remarkably alike up to age five (Habicht and colleagues, 1974), which is why WHO built one international standard (§5).
4.2 Environmental factors
- Pre-natal environment: maternal infections (rubella, syphilis, HIV, toxoplasmosis), intra-uterine growth retardation from maternal malnutrition and anaemia, smoking (lower birth weight), alcohol (fetal alcohol syndrome), drugs (thalidomide), X-rays and environmental toxins.
- Climate and season: children grow faster in height in spring and summer and gain weight faster in autumn. Populations in hot climates tend to be linear and those in cold climates stockier (Bergmann’s and Allen’s rules; Unit 9.7), though diet and disease confound simple climate effects.
- Altitude: in the Andes and Himalayas, low oxygen slows growth in height and delays maturation, while chest size and lung volume become larger (Unit 9.7).
- Migration: Franz Boas (1910–12) found that the head shape of children born to immigrants in America differed from that of their siblings born abroad. Barry Bogin and colleagues (1997, 2003) found that Maya children growing up in the United States were, by the early 2000s, about 10 cm taller than Maya children in Guatemala: a large change within one generation.
- Emotional environment: the British nutritionist Elsie Widdowson (“Mental contentment and physical growth”, 1951) studied two German orphanages after the Second World War. Children under a harsh matron who scolded them at meals gained less weight; when she moved to the other home, just as it began receiving extra bread, its children gained less despite more food, while the eight favourites she brought gained most. Severe neglect can suppress growth hormone and cause psychosocial short stature, which reverses in a caring home.
- Illness: recurrent diarrhoea, worms and malaria divert energy from growth.
4.3 Biochemical (hormonal) factors
Hormones from the endocrine glands control the speed and timing of growth at each stage.
| Hormone (source) | Role in growth | When most important |
|---|---|---|
| Growth hormone (GH) (pituitary) | Acts mainly through insulin-like growth factor 1 (IGF-1) from the liver: cartilage growth at the growth plates, cell division, protein synthesis, muscle growth | Childhood and adolescence |
| Thyroxine (thyroid) | Raises metabolism; essential for brain development and bone maturation | All stages; fetal deficiency causes cretinism |
| Insulin and IGF-2 (pancreas, placenta, fetal tissues) | Main drivers of fetal growth | Pre-natal |
| Human chorionic gonadotropin (placenta) | Maintains pregnancy; stimulates fetal testes to make testosterone for sexual differentiation | Early pre-natal |
| Sex steroids (testosterone, oestrogen) | Drive the adolescent spurt and secondary sex characteristics, then close the epiphyses | Adolescence |
| FSH and LH (pituitary) | Stimulate the gonads: egg follicles and oestrogen; sperm and testosterone | Puberty onwards |
| Cortisol (adrenal cortex) | In excess (stress, steroid drugs) inhibits growth | Any stage |
| Leptin (fat tissue) | Signals energy reserves; permits the onset of puberty | Pre-puberty |
Fetal growth is largely independent of growth hormone: babies lacking pituitary GH are of nearly normal birth size and fall behind only after birth, because fetal growth depends on insulin, IGF-2, the placenta and the mother’s nutrition.
4.4 Nutritional factors
- Energy needs per kilogram are highest in infancy: a young infant needs about three times the energy per kilogram of an adult, partly for growth itself (in the first months a fifth or more of an infant’s energy goes into building new tissue).
- Undernutrition slows the tempo first: a poorly fed child grows slowly and matures late; if deprivation is brief, catch-up follows; if it lasts through the first 1,000 days (conception to the second birthday), stunting becomes largely permanent and the final height is reduced.
- Specific nutrients: protein for tissue building; iodine for thyroid hormones and the brain; zinc for growth and sexual maturation; iron for blood and learning; calcium and vitamin D for bone.
- Overnutrition brings earlier puberty in girls and childhood obesity, a growing problem in Indian cities.
4.5 Cultural factors
- Feeding customs: discarding colostrum (the first, antibody-rich milk) and delaying breastfeeding; NFHS-5 found only 41.8 per cent of children breastfed within an hour of birth and 63.7 per cent exclusively breastfed to six months. Late introduction of solid food after six months stalls growth.
- Food taboos and beliefs: “eating down” (eating less in pregnancy to have a small baby and an easy delivery) lowers birth weight; avoiding “hot” foods such as papaya or eggs in pregnancy or illness narrows diets.
- Food processing: eating polished rice brings thiamine deficiency, and diets of maize or jowar without suitable processing bring pellagra (Unit 9.8).
- Gender and kinship: son preference and birth order (Jayachandran and Pande), the practice of women eating last, and early marriage and adolescent pregnancy, which produce small babies born to mothers who have not finished growing.
- Childrearing patterns: the psychologists Charles Super and Sara Harkness (1986) called the setting a child grows up in its developmental niche: its physical and social settings, customs of care and parents’ beliefs. Cultures differ in who cares for children (mothers alone, or siblings and grandmothers in socially distributed care), in how much they stimulate them, and in their goals. The American anthropologist Robert LeVine and colleagues (1994) contrasted the pediatric goals of Gusii mothers in Kenya (survival, health, calm) with the pedagogical goals of Boston mothers (talk, play and preparation for school).
4.6 Socio-economic factors
- Class gradient: in Britain, Tanner found children of professional and managerial families taller than those of unskilled manual workers, with the gap appearing in early childhood and widening by adolescence; the better-off also matured earlier.
- Poverty works through many channels: less and poorer food, crowded housing, infection, parental illiteracy, child-unfriendly family budgets, parental smoking and emotional strain.
- Sanitation: where open defecation is common, children are exposed to constant gut infection (environmental enteropathy), which reduces nutrient absorption. The economist Dean Spears (2013) and colleagues argued that India’s high rate of open defecation helps explain why its children are shorter than its income level predicts.
- Place and group: NFHS-5 found stunting at 37.3 per cent in rural and 30.1 per cent in urban India; Scheduled Tribe children and the poorest households are the most stunted, and ST women and the poorest show the negative secular trend described in §3.4.
- National income: richer countries have taller children, but loosely: India’s stunting exceeds what its income predicts, pointing to culture, sanitation and inequality.
5. Indian Growth Data and Standards
In simple words
To judge whether a child is growing well, doctors compare the child’s height and weight with a reference chart. India uses the WHO standard for children under five and charts made from Indian children for ages five to eighteen. National surveys show that a third of Indian children under five are too short for their age.
5.1 Growth references
- WHO Child Growth Standards (2006): built from the Multicentre Growth Reference Study of healthy, breastfed children of non-smoking mothers in six countries: Brazil, Ghana, India (South Delhi), Norway, Oman and the United States. Children raised in good conditions grew alike in all six, so the curves are a standard (how children should grow) rather than a mere reference (how a group does grow). India adopted them in 2008 for the ICDS and health system.
- IAP growth charts (2015): the Indian Academy of Pediatrics revised its charts for 5–18-year-olds (Khadilkar and colleagues, Indian Pediatrics, 2015), using data on 33,148 apparently healthy middle- and upper-class children from 14 cities. For overweight and obesity it uses BMI lines equivalent to adult BMI 23 and 27, lower than the international 25 and 30, because Indians face higher metabolic risk at lower BMI. IAP recommends the WHO standards below age 5.
- Older data: ICMR growth studies and the National Nutrition Monitoring Bureau (from 1972) recorded rural and poorer children, showing the gap between potential and actual growth.
5.2 What NFHS-5 shows
| Indicator (NFHS-5, 2019–21) | Value | NFHS-4 (2015–16) |
|---|---|---|
| Children under 5 stunted | 35.5% | 38.4% |
| Children under 5 wasted | 19.3% | 21.0% |
| Children under 5 underweight | 32.1% | 35.8% |
| Children under 5 overweight | 3.4% | 2.1% |
| Women 15–49 with BMI below 18.5 | 18.7% | 22.9% |
| Women 15–49 overweight or obese | 24.0% | 20.6% |
| Children 6–59 months anaemic | 67.1% | 58.6% |
The figures show slow improvement in undernutrition, a rise in overweight and a rise in anaemia: India is undergoing a nutrition transition, carrying both burdens at once. The government’s Poshan Tracker records monthly height and weight of children at anganwadis; its November 2023 data recorded about 37.5 per cent of measured children under six as stunted.
6. Worked Examples
In simple words
A few simple calculations turn growth measurements into judgements: whether an adult’s weight is healthy, how fast a child is growing, and how tall a child is likely to become.
Example 1: Body mass index. BMI = weight (kg) ÷ height² (m²). For an adult of 60 kg and 1.60 m: 1.60 × 1.60 = 2.56; 60 ÷ 2.56 = 23.4 kg/m². By the international WHO cut-offs (18.5–24.9 normal) this is normal; by the Asian Indian cut-offs (normal 18.5–22.9; overweight 23–24.9; obese 25 and above) it is overweight. The same number can lead to different advice depending on the population’s risk.
Example 2: Height velocity. A girl measures 138.2 cm on her 11th birthday and 146.4 cm a year later. Velocity = (146.4 − 138.2) ÷ 1 year = 8.2 cm per year, close to the typical peak height velocity of girls: she is probably at the height of her spurt, and menarche can be expected in about a year. If two measurements are six months apart, the gain is doubled to give an annual rate (a gain of 3.1 cm in 6 months = 6.2 cm per year).
Example 3: Target (mid-parental) height. Father 172 cm, mother 156 cm. For a son: (172 + 156 + 13) ÷ 2 = 170.5 cm; for a daughter: (172 + 156 − 13) ÷ 2 = 157.5 cm. The 13 cm corrects for the average sex difference; most children end within about ±8.5 cm of the target. A child growing well below the line expected from the parents’ heights is more likely to have an environmental or medical cause than a genetic one.
Example 4: Z-score. Z = (child’s measurement − reference median) ÷ reference standard deviation. If a two-year-old boy is 81.0 cm tall and the reference median is 87.0 cm with an SD of 3.0 cm: (81.0 − 87.0) ÷ 3.0 = −2.0. A height-for-age z-score below −2 defines stunting, below −3 severe stunting.
Key Terms
| Term | Meaning in simple words |
|---|---|
| Growth | Increase in body size: more and bigger cells |
| Development | Increase in function and complexity: new skills |
| Maturation | Progress towards the adult state, measured as biological age |
| Cephalocaudal / proximodistal | Development from head to foot / from the centre outwards |
| Low birth weight | Birth weight below 2,500 g |
| Distance curve | A graph of size reached at each age |
| Velocity curve | A graph of growth per year at each age |
| Peak height velocity | The fastest rate of growth during the adolescent spurt |
| Scammon’s curves | Four growth patterns of general, neural, lymphoid and reproductive tissues |
| Canalisation | The tendency of growth to stay on a genetically set path |
| Catch-up growth | Faster-than-normal growth after illness or hunger ends |
| Secular trend | Change in growth or maturation across generations |
| Stunting | Low height for age, a sign of long-term undernutrition |
| Z-score | How many standard deviations a measurement lies from the reference median |
| Target height | Expected adult height calculated from the parents’ heights |
Contemporary Developments
- Negative secular trend in India: a 2021 analysis of NFHS data found average height of young Indian men, Scheduled Tribe women and women of the poorest households falling between 2005–06 and 2015–16.
- NFHS-5 (2019–21): stunting fell to 35.5 per cent, but child overweight rose to 3.4 per cent and child anaemia to 67.1 per cent, signs of a double burden.
- Poshan Tracker: monthly digital growth monitoring of children at anganwadis, used to identify stunted and wasted children.
- Son preference and child height: research published in 2017 showed that India’s height deficit relative to Africa emerges among later-born children, linking growth to kinship and gender.
Diagrams to Master
- Topic map: concept → stages → curves and trends → factors → Indian data → worked examples.
- Stages timeline: germinal (0–2 weeks) → embryonic (3–8) → fetal (9–38) → birth → infancy → childhood → adolescence → maturity → senescence, with one key event per stage.
- Distance and velocity curves: S-shaped distance curve; velocity peak girls about 12 years, boys about 14; the cross-over when girls are taller.
- Scammon’s curves: neural (90 per cent by 6–7), lymphoid (near 200 per cent at 11–12), general (S-shaped), reproductive (late).
- Factors web: genetic potential at the centre; hormones; environmental, nutritional, cultural and socio-economic factors around it, each with an Indian example.
Revision Grid
| Scholar | Work (year) | Key idea |
|---|---|---|
| Montbeillard and Buffon | Record of a son’s growth (1759–77) | First longitudinal growth record |
| Franz Boas | Immigrant study (1910–12) | Body form changes with environment |
| Richard Scammon | “The measurement of the body in childhood” (1930) | Four tissue growth curves |
| Elsie Widdowson | “Mental contentment and physical growth” (1951) | Emotional environment affects growth |
| C. H. Waddington | The Strategy of the Genes (1957) | Canalisation; epigenetic landscape |
| Prader, Tanner and von Harnack | Journal of Pediatrics (1963) | Catch-up growth |
| Rose Frisch | Critical weight and fat hypotheses (1970, 1974) | Body fat and the timing of menarche |
| James Tanner | Foetus into Man (1978) | Growth as target-seeking; class and growth |
| Beatrice Whiting and Carolyn Edwards | Children of Different Worlds (1988) | Lap, knee, yard and community children |
| Bogin and colleagues | Maya migrant studies (1997, 2003) | About 10 cm height gain in one generation |
| Barry Bogin | Patterns of Human Growth (1999) | Childhood and adolescence as human-specific stages |
| Jayachandran and Pande | American Economic Review (2017) | Birth order, son preference and stunting |
Previous Year Questions
Unit 10a: Concept of growth and development; stages of growth; growth curves; factors affecting growth and development
- 2026Write notes on: Canalization and catch-up growth.
- 2022Write notes on: Stages of human pre-natal development.
- 2022Critically evaluate the reasons of reduction in age at menarche in human females over the successive generations.
- 2021Write notes on: Human adolescent growth spurt. (in about 150 words).
- 2020Secular trend in human growth can be positive, negative or neutral. Illustrate with examples.
- 2019Write a note in 150 words on Genetico -environmental factors affecting human growth.
- 2016Discuss different factors affecting growth and development in human beings.
- 2014What are the different stages of Growth? Describe any one of them in detail.
- 2013Write a note in 150 words on Differentiate between Child Growth & Development.
- 2009Differentiate between ‘growth’ & development’. List the factors affecting human growth and development.
- 2005Critically discuss the factors affecting human growth and development.
- 2004Critically examine the role of nutritional, socio-economic and cultural factors on human growth and development.
- 2003Differentiate between human growth and development and describe the various stages of human growth.
- 2001Define growth and maturation and discuss the different factors affecting them. ·.
- 1999What is meant by physical growth: norms? How are these made and how do they depict the growth status of a population?
- 1998Write a note on Growth curves.
- 1995Describe the patterns of human physical growth and development from birth to maturity.
- 1991Describe the stages of human physical growth and development and discuss the effect of nutrition and inbreeding on growth and development.
- 1990Describe the methods of studying growth and physical development of children. Discuss the role of hormonal and nutritional factors on human growth and development.
- 1985Give a short account of the present-day growth studies in India.
Related questions from other units
- 2023Unit 9.8: Elucidate the different forms of malnutrition. Describe protein-calorie malnutrition with suitable examples.
- 2021Unit 12: What is Anthropometry ? Discuss its role in assessing the nutritional status and sports capability of a person.
- 2017Unit 11.1: Write a note in 150 words on Age at menarche.
- 2013Unit 9.7: Justify “Though human growth is under tight genetic control but it is influenced by various environmental factors.” (250 words).
- 2001Unit 11.1: Write a note on Menarche and Menopause.
- 1983Unit 9.7: Stature is susceptible to environmental influences. Substantiate.
- 1981Unit 9.8: “Nutrition affects several physical features. ” Exemplify. (200 words).