

10 Concept of human growth and development: Aging and senescence. Theories and observations -biological and chronological longevity. Human physique and somatotypes. Methodologies for growth studies.
Official Syllabus: Paper I, Unit 10
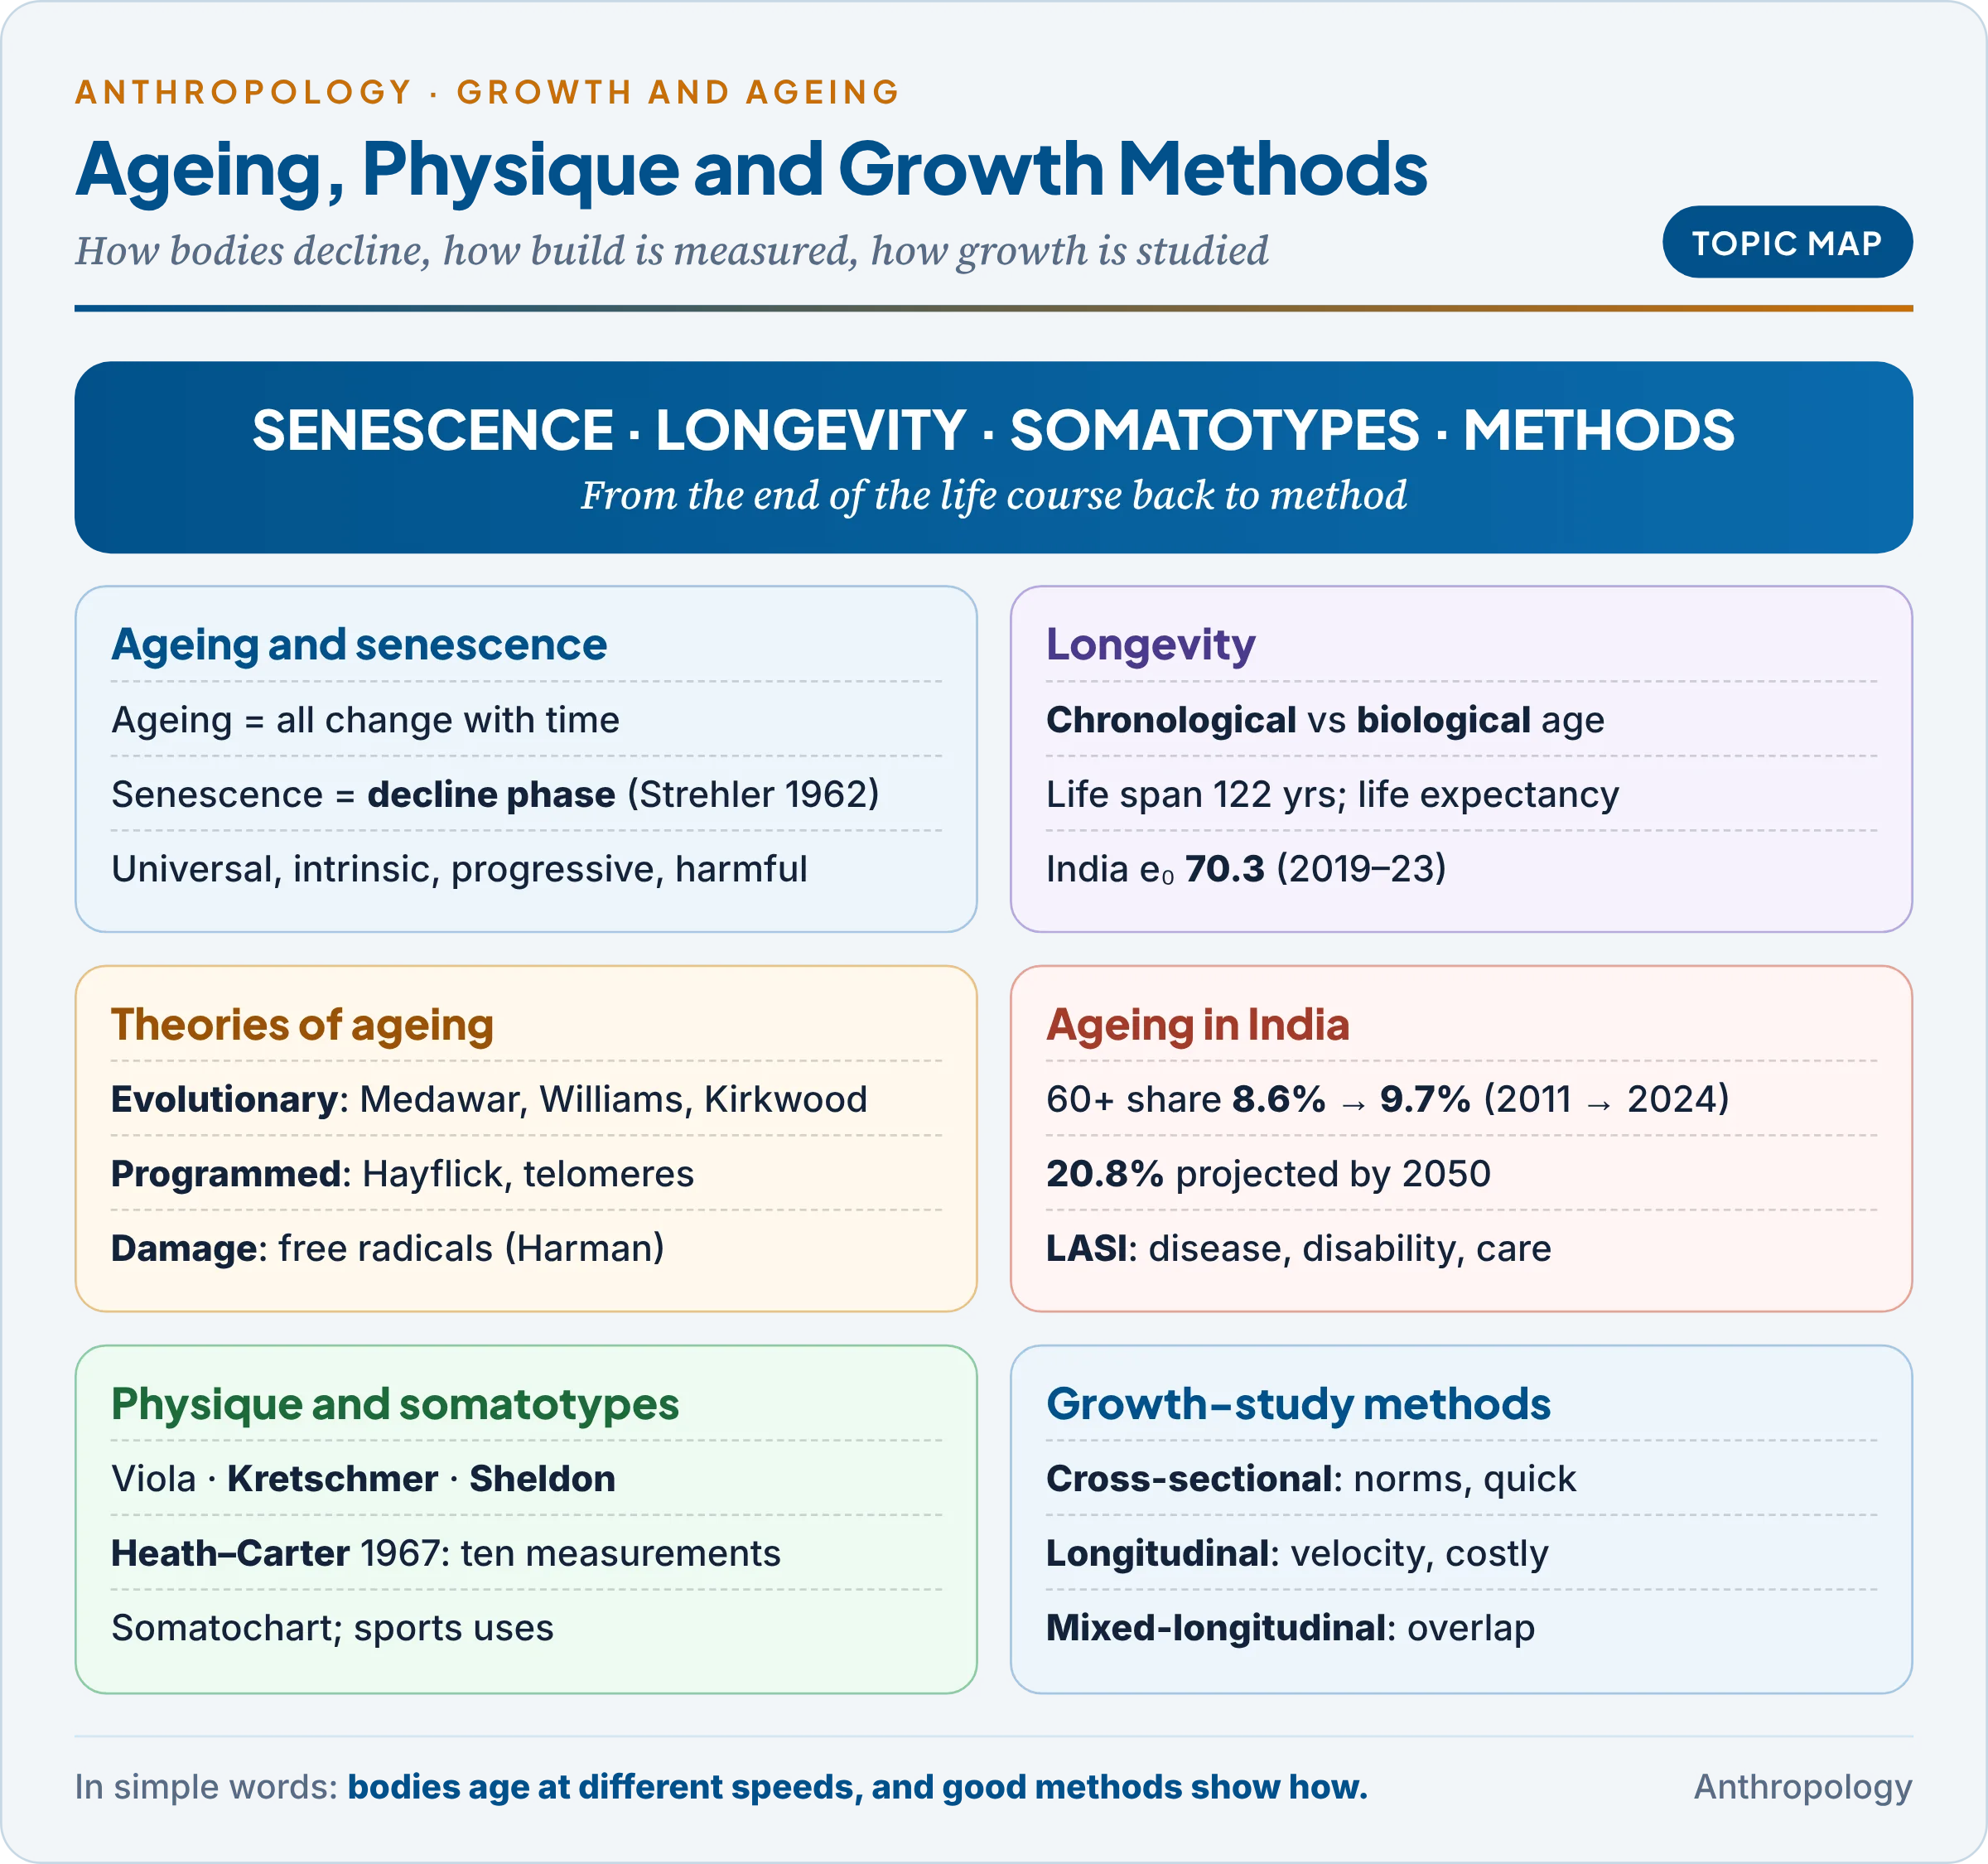
Unit 10a traced growth from the prenatal stage through infancy, childhood and the adolescent spurt to maturity, and showed how genes, hormones, nutrition, culture and income speed it up or slow it down. This unit takes the story to its end and steps back to method, asking why bodies decline with age, how long people live, how body form can be described and measured, and how growth itself is studied.
1. Ageing and Senescence: Meaning and Observations
In simple words
Ageing simply means growing older; everything that changes with the passing years is part of it. Senescence is the later part of ageing, when the body slowly loses strength, repair and reserve, and the chance of dying rises year by year.
An example first. Two men of eighty sit in the same village courtyard. One hears every word of a whispered conversation; the other cannot follow speech even when people shout. Both are the same age by the calendar, but their bodies have aged at different speeds. This gap between calendar age and bodily condition is the central puzzle of the study of ageing, called gerontology (the science of ageing; geriatrics is the branch of medicine that treats the elderly).
1.1 Definitions
- Ageing is any change that comes with time, from birth onward. Puberty is an ageing change, but not a senescent one.
- Senescence is the phase of functional decline. The American gerontologist Bernard Strehler (Time, Cells and Aging, 1962) defined it as the changes that occur generally in the post-reproductive period and result in decreased survival capacity.
- The British biologists John Maynard Smith (1962), Peter Medawar (1952) and Alex Comfort (1956) similarly framed senescence as rising susceptibility to death with age.
Strehler’s four criteria. A change counts as true senescence only if it is universal (found in every member of the species: greying hair is, a cancer is not), intrinsic (from within, not from an accident or infection), progressive (gradual; death may be sudden, but the processes behind it are slow) and deleterious (it raises the probability of death). These criteria separate ageing itself from the diseases of old age: gerontologists speak of primary ageing (universal, intrinsic decline) and secondary ageing (decline from disease, disuse and environment, which is preventable).
1.2 How senescence proceeds
Senescence begins at the molecular level long before visible signs appear: damage builds up in molecules (DNA, proteins, lipids) → sub-cellular repair weakens → cells lose efficiency or die → tissues and organs lose capacity → the organism copes less well with stress → the probability of death rises. The British actuary Benjamin Gompertz (1825) observed that the adult death rate rises roughly exponentially with age; it doubles about every eight years after early adulthood.
1.3 Observations: what changes in the body
Each common observation of senescence reflects this slow loss of cells and reserve.
| System | Typical change with age | Why it matters |
|---|---|---|
| Senses | Farsightedness from about 40–45; cataract; glaucoma; loss of high-frequency hearing; weaker taste and smell | Isolation, accidents, poor appetite |
| Skin and hair | Loss of elastic fibres and collagen, so wrinkling; greying, often from the thirties | Visible social markers of age |
| Muscle and bone | Sarcopenia (loss of muscle); grip strength falls after early adulthood; osteoporosis, sharpest in women after menopause; stature shrinks | Falls and fractures |
| Heart and lungs | Stiffer arteries, higher blood pressure; lower lung capacity | Cardiovascular disease becomes the main killer |
| Nervous system and temperature | Slower reactions; poorer control of body heat | Accidents; hypothermia and heat-stroke |
| Reserve capacity | Organs can normally work 4–10 times harder than at rest; this reserve shrinks | Stress, illness or surgery are survived less well |
The last row is the key idea. Reserve capacity keeps homeostasis (the steady internal balance of temperature, blood sugar and pressure) during stress; its decline explains why an old person who manages daily life may collapse with a fever or a fall that a young person would shrug off. Genes, diet, work, disease and wealth make the pace of decline highly individual, as in the opening example.
Common confusion
Is every age-related change a sign of senescence? No. Ageing covers all change with time, including growth and puberty. Senescence is only the decline phase, and a change counts as senescent only if it is universal, intrinsic, progressive and harmful. A disease common in old age, such as diabetes, is part of secondary ageing, not of senescence itself.
2. Biological and Chronological Longevity
In simple words
Chronological age is the number of years since birth. Biological age is how old the body actually is, judged from how well it works. People of the same calendar age can differ widely in biological age, and longevity is how long a person or a population actually lives.
An example first. India’s life expectancy at birth was 49.7 years in 1970–75 and 70.3 years in 2019–23 (SRS Abridged Life Tables). The gain came mostly from fewer deaths of infants and young adults (vaccines, clean water, food, medical care), while the maximum human lifespan hardly changed, which is why demographers separate average longevity from maximum lifespan.
The key terms.
- Chronological age: calendar age, the years lived since birth.
- Biological (physiological) age: the functional state of the body compared with population norms, estimated from blood pressure, lung function, grip strength, bone density and, recently, epigenetic clocks (age-linked chemical tags on DNA, first combined into a clock by the biostatistician Steve Horvath, 2013).
- Life span: the longest a member of the species can live; the oldest verified human, Jeanne Calment of France, died in 1997 aged 122.
- Life expectancy: the average years a person of a given age can expect to live under current death rates; at birth (e₀) it is pulled down by infant deaths.
- Chronological longevity is how long people actually live; biological longevity is the potential span set by genetic and physiological limits, which actual lives rarely reach.
The crucial difference: chronological age advances one year per year for everyone, while biological age varies with genes, diet, work and disease. This is why two people of 70 can have very different health, why fixed retirement ages fit some people poorly, and why a child’s skeletal or dental age can run ahead of or behind calendar age (Unit 10a).
Indian longevity data (verified). Expectation of life at birth, 2019–23: 70.3 years (males 68.5, females 72.5; rural 69.1, urban 73.1; Kerala 75.1, Chhattisgarh 64.6). Expectation of life at 60: 18.4 years. Men outlived women in India in 1970–75; the female advantage appeared in the 1980s and is now about four years.
What shapes longevity.
- Biological factors: sex (women live longer almost everywhere, probably helped by hormonal protection of the heart); heredity (long-lived parents tend to have long-lived children, though the heritable share is modest).
- Diet: in 1935 the American nutritionist Clive McCay showed that rats on a restricted-calorie diet lived longer; calorie restriction remains the most consistent life-extending intervention in laboratory animals.
- Socio-ecological factors: income, education, sanitation, health care, occupation, tobacco and social support, which is why urban Indians outlive rural Indians.
- Rectangularisation: the American physician James Fries (1980) argued that as early deaths fall, the survival curve becomes rectangular (most people live to near the maximum), and illness can be compressed into the last years of life.
3. Theories of Ageing
In simple words
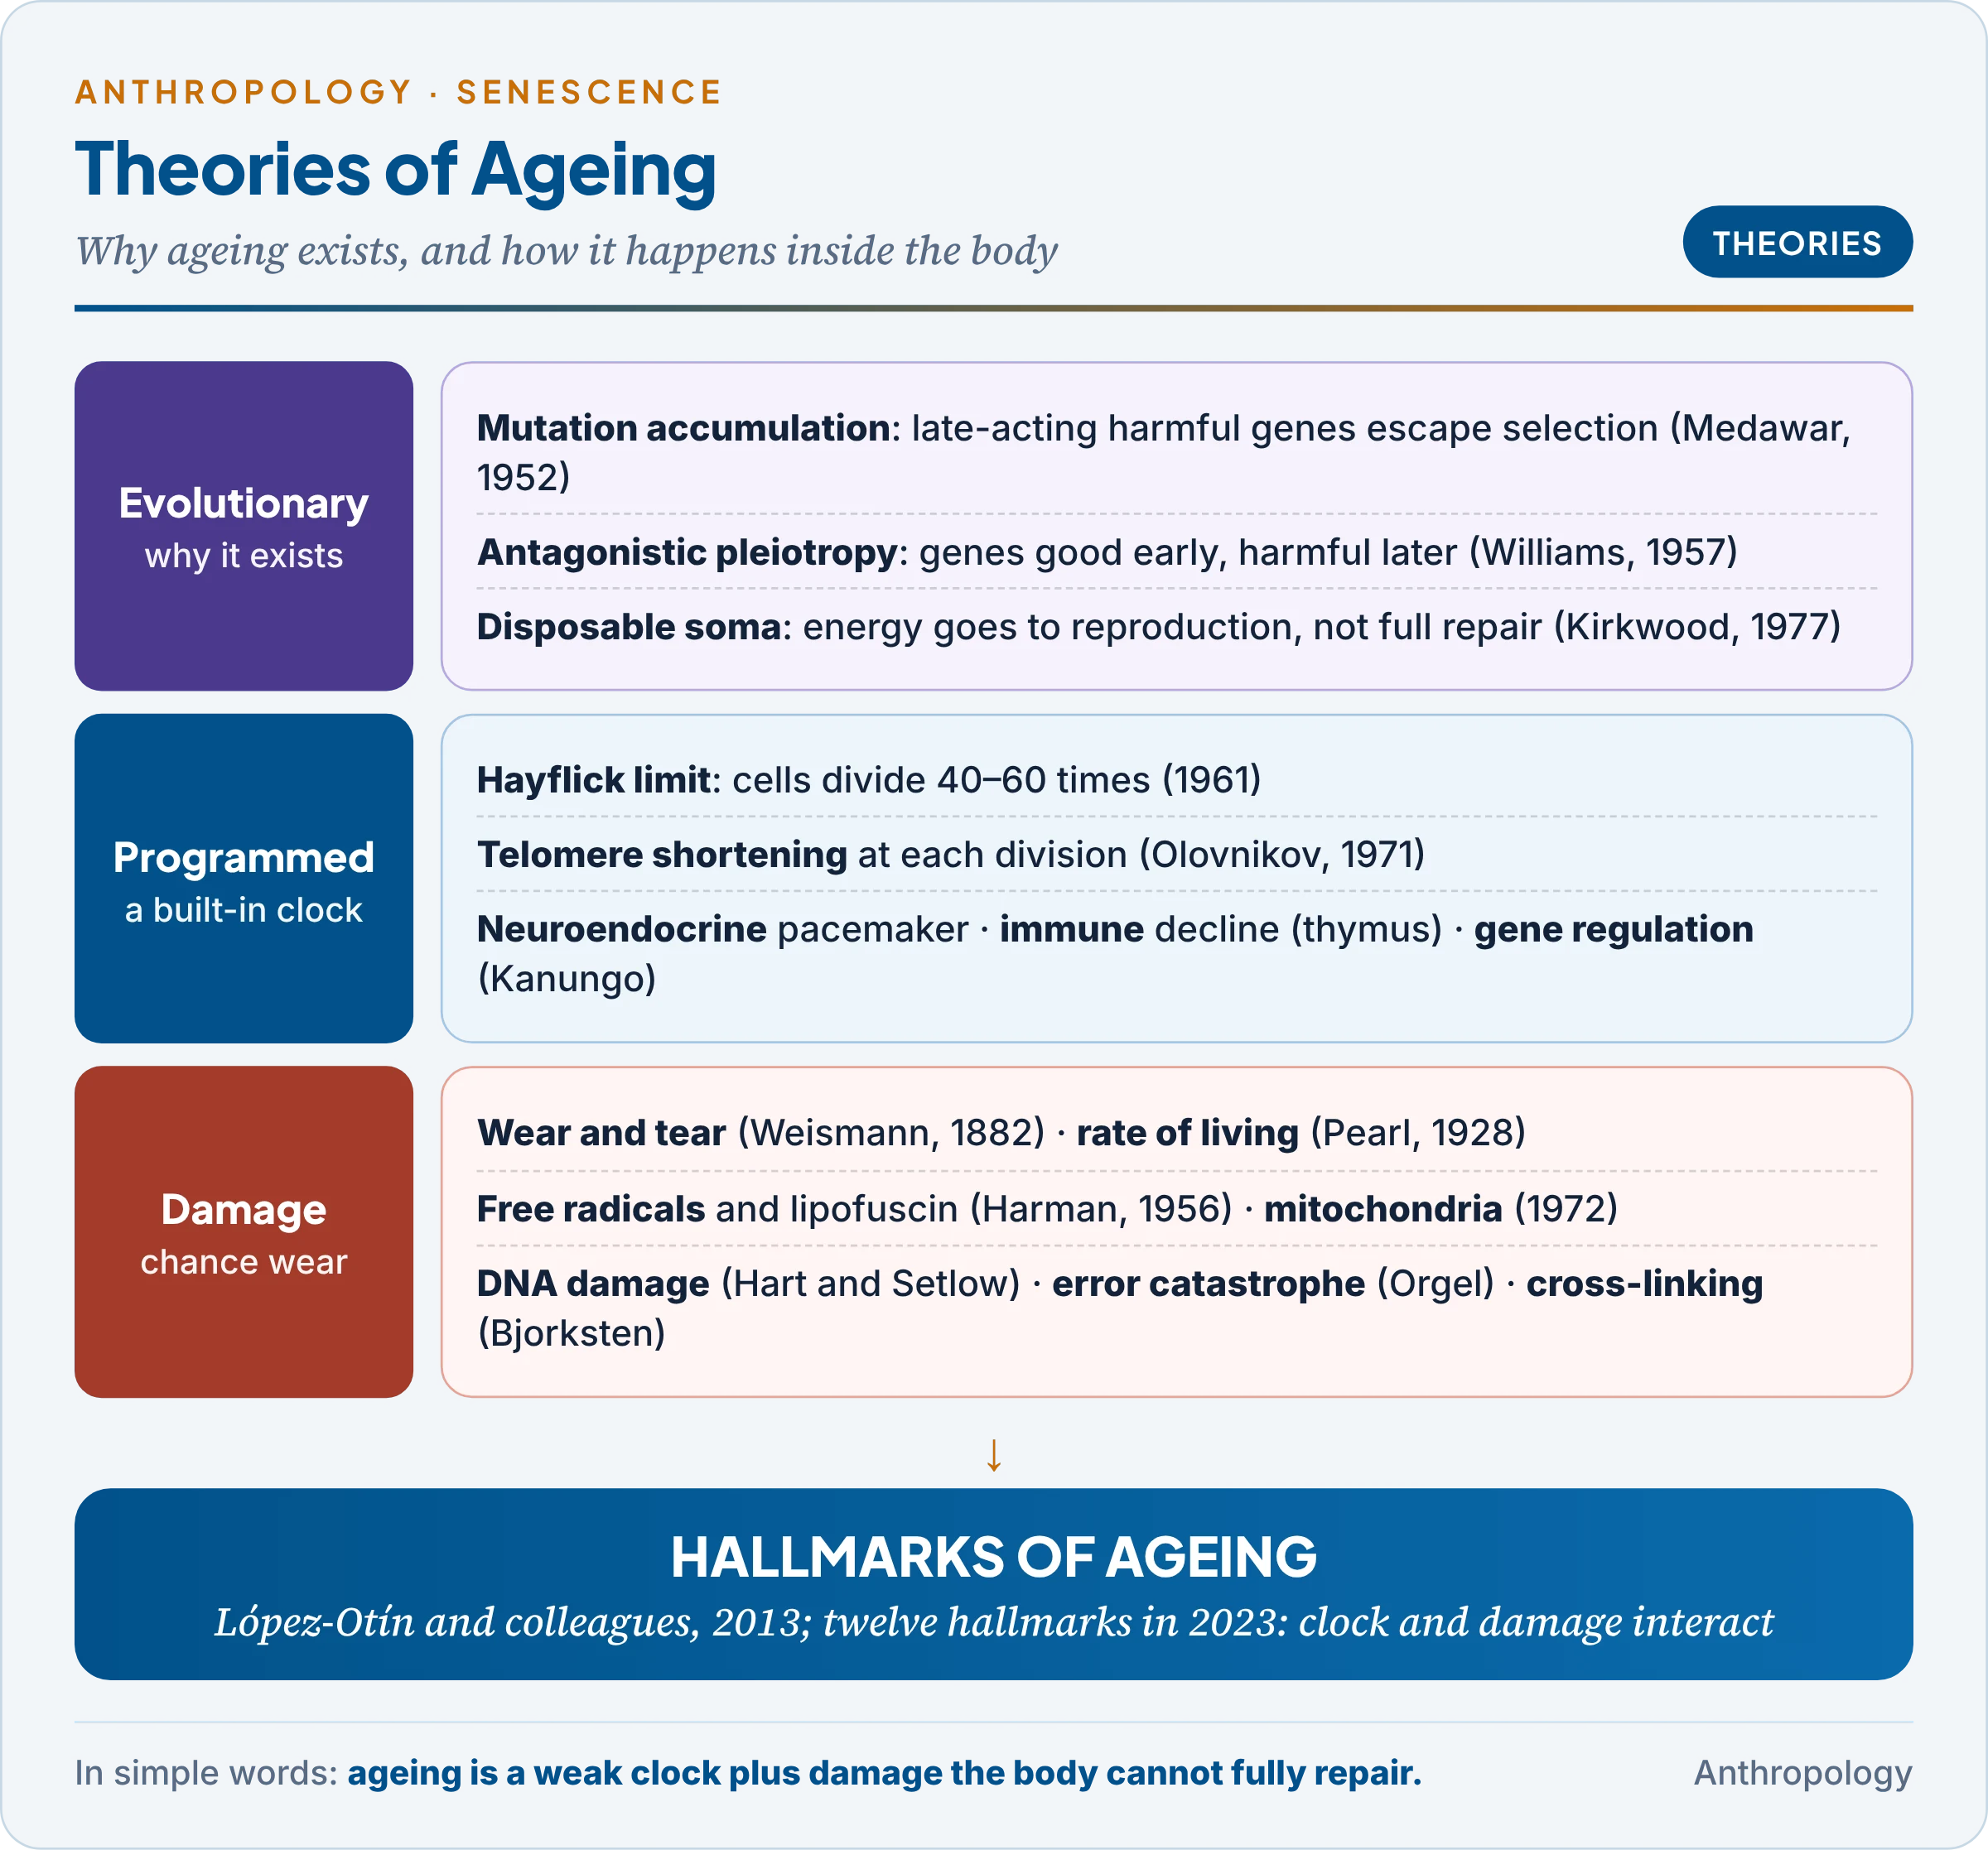
Scientists ask two questions about ageing: why it exists at all, and how it happens inside the body. Some theories say ageing is built into a biological clock; others say it is the slow pile-up of damage that the body fails to repair. Most scientists now think both kinds of process work together.
An example first. In 1961 the American cell biologist Leonard Hayflick and Paul Moorhead grew human fibroblasts (connective-tissue cells) in laboratory dishes. The cells did not divide forever. Cells from a fetus divided about 40–60 times and then stopped, and cells from older donors stopped sooner. This Hayflick limit suggested that cells carry some kind of counter, and launched the modern search for the mechanisms of ageing.
The theories fall into three families: evolutionary theories (why ageing exists), programmed theories (a built-in clock) and damage or stochastic theories (accumulated wear). Physiologists often call the last two together the physiological theories.
3.1 Evolutionary theories: why ageing exists
If natural selection favours fitness, why has it not removed ageing? The answer is that selection weakens with age: in the wild most animals die of predators, hunger or disease before they grow old, so genes that act late in life are hardly tested by selection.
- Mutation accumulation (Peter Medawar, 1952): harmful mutations that act only after reproduction are passed on before they do harm, so they accumulate in the gene pool. Huntington’s disease, which usually appears in middle age, is often cited as an illustration.
- Antagonistic pleiotropy (George C. Williams, an American evolutionary biologist, 1957): pleiotropy means one gene affecting several traits. A gene that helps early reproduction will be favoured even if it harms the body later. Genes that raise sex hormones and early fertility, for example, may also raise later cancer risk.
- Disposable soma (Thomas Kirkwood, a British biologist, 1977): soma means the body as distinct from the germ cells. Energy is limited, so an organism must divide it between reproduction and body repair. Investing fully in repair would cost reproduction, so the body is maintained only “well enough”, and damage slowly builds up.
Why they matter: they explain why species age at different rates (animals safe from outside dangers, such as tortoises and bats, evolve slower ageing) and why senescence follows reproduction (menopause, Unit 11a), but not which molecules fail.
3.2 Programmed theories: a built-in clock
- Hayflick limit and telomere theory. At each division the telomeres (repeated DNA sequences, TTAGGG in humans, that cap chromosome ends) are not fully copied and shorten. The Russian biologist Alexey Olovnikov proposed in 1971 that this is the counter behind the Hayflick limit: when telomeres become too short, the cell stops dividing (replicative senescence) or dies. The enzyme telomerase, active in germ cells and most cancers, rebuilds them; Blackburn, Greider and Szostak shared the 2009 Nobel Prize for its discovery.
- Neuroendocrine (pacemaker) theory. The hypothalamus and pituitary act as a clock: falling hormone receptors and hormones (growth hormone, oestrogen, testosterone) pace the ageing of other organs. Menopause is the clearest hormonal timer.
- Immunological theory. The American pathologist Roy Walford and the Australian immunologist Macfarlane Burnet linked ageing to immunity: the thymus shrinks after puberty, T-cell output falls, infections become dangerous and autoimmune errors (antibodies against one’s own tissues) increase.
- Gene regulation theory. The Indian gerontologist M.S. Kanungo (Banaras Hindu University) argued that ageing follows changes in the switching on and off of genes: after reproduction, genes that maintain adult function are expressed less, so the factors sustaining adulthood go missing.
- Strict programmed ageing (a genetic timetable of decline) is doubted, because no “death genes” have been found and selection has little reason to program death (§3.1).
3.3 Damage (stochastic) theories: accumulated wear
Stochastic means governed by chance. These theories see ageing as the random build-up of damage that repair systems cannot keep pace with.
- Wear and tear (August Weismann, German biologist, 1882): tissues wear out from use, like a machine. Limit: the body repairs itself, and exercise, which “uses” it more, actually slows decline.
- Free radical theory (Denham Harman, American chemist-physician, 1956): free radicals are molecules with an unpaired electron (superoxide, hydroxyl), made mainly in mitochondria as by-products of using oxygen. They steal electrons from DNA, proteins and membrane lipids (oxidation), distorting them. Oxidised fats and proteins form lipofuscin, the yellow-brown “age pigment” of heart and nerve cells. Antioxidants (vitamins C and E, beta-carotene) neutralise radicals. Limit: antioxidant-supplement trials have not extended human life.
- Mitochondrial theory (Harman, 1972): mitochondria are both the main source and the main victims of free radicals; their poorly repaired DNA lets energy supply falter.
- DNA damage (somatic mutation) theory: if damage from radiation, chemicals and copying errors outpaces DNA repair, mutations accumulate in body cells. Ronald Hart and Richard Setlow (1974) showed that longer-lived species repair DNA faster.
- Error catastrophe (Leslie Orgel, British chemist, 1963): an error in the protein-making machinery yields faulty enzymes that make still more errors. Limit: the predicted runaway of errors was not found.
- Cross-linking or collagen theory (Johan Bjorksten, 1942): with age, collagen fibres (about a third of body protein) become chemically linked to one another, helped by glucose, so tissues stiffen, arteries harden, skin wrinkles and the flow of nutrients and wastes is obstructed.
- Waste accumulation (“clinker”): by-products such as lipofuscin and amyloid (the protein of Alzheimer’s plaques) slowly clog cells.
- Rate of living (Raymond Pearl, 1928): faster metabolism means a shorter life. Limit: birds and bats burn energy fast yet outlive mammals of their size.
3.4 Evaluating the theories
The table compares the families; the main point is that each captures part of a single process.
| Family | Main idea | Strength | Weakness |
|---|---|---|---|
| Evolutionary | Selection is weak after reproduction | Explains why species age at different rates | Silent on molecular mechanism |
| Programmed | A clock (telomeres, hormones, immunity, gene switching) times decline | Fits regular stages such as menopause and thymic shrinkage | No general “ageing gene” found |
| Damage | Random harm outpaces repair | Strong laboratory evidence (oxidation, DNA repair, cross-links) | Repair varies; single causes over-simplify |
Modern synthesis. In 2013 the Spanish biologist Carlos López-Otín and colleagues grouped the evidence into the “hallmarks of ageing”, expanded to twelve in 2023: among them genomic instability, telomere attrition, epigenetic change, mitochondrial dysfunction, cellular senescence, stem-cell exhaustion and chronic inflammation (“inflammaging”). Clock-like and damage-driven processes interact, so no single theory is accepted alone.
3.5 Social and cultural theories of ageing
Biology explains decline; anthropology and sociology explain how societies define, value and treat old people.
- Disengagement theory (Elaine Cumming and William Henry, Growing Old, 1961): old people and society withdraw from each other by mutual consent, easing the transfer of roles. Criticism: withdrawal is often forced by retirement rules and poverty, not natural.
- Activity theory (Robert Havighurst, 1961): staying active and keeping roles brings satisfaction; continuity theory (Robert Atchley, 1989): people try to keep earlier habits and identities.
- Modernisation theory (Donald Cowgill and Lowell Holmes, Aging and Modernization, 1972): the status of the elderly falls as societies modernise, because urbanisation, schooling and new occupations devalue their knowledge and control over land.
- Indian ethnography. The American anthropologist Sylvia Vatuk showed how the north Indian ideal of care by sons coexists with the fear of being “a burden on others”. Lawrence Cohen, in No Aging in India (1998), showed that in Varanasi the “weak brain” of the old is read through family relations and household conflict, not only as dementia. Old age is a cultural category as well as a biological stage.
4. Ageing in India: Data and Issues
In simple words
India is ageing fast because people live longer and couples have fewer children. The share of people aged 60 and above is about one in ten today and is expected to reach about one in five by 2050, bringing more chronic disease, disability and need for care.
The numbers (verified).
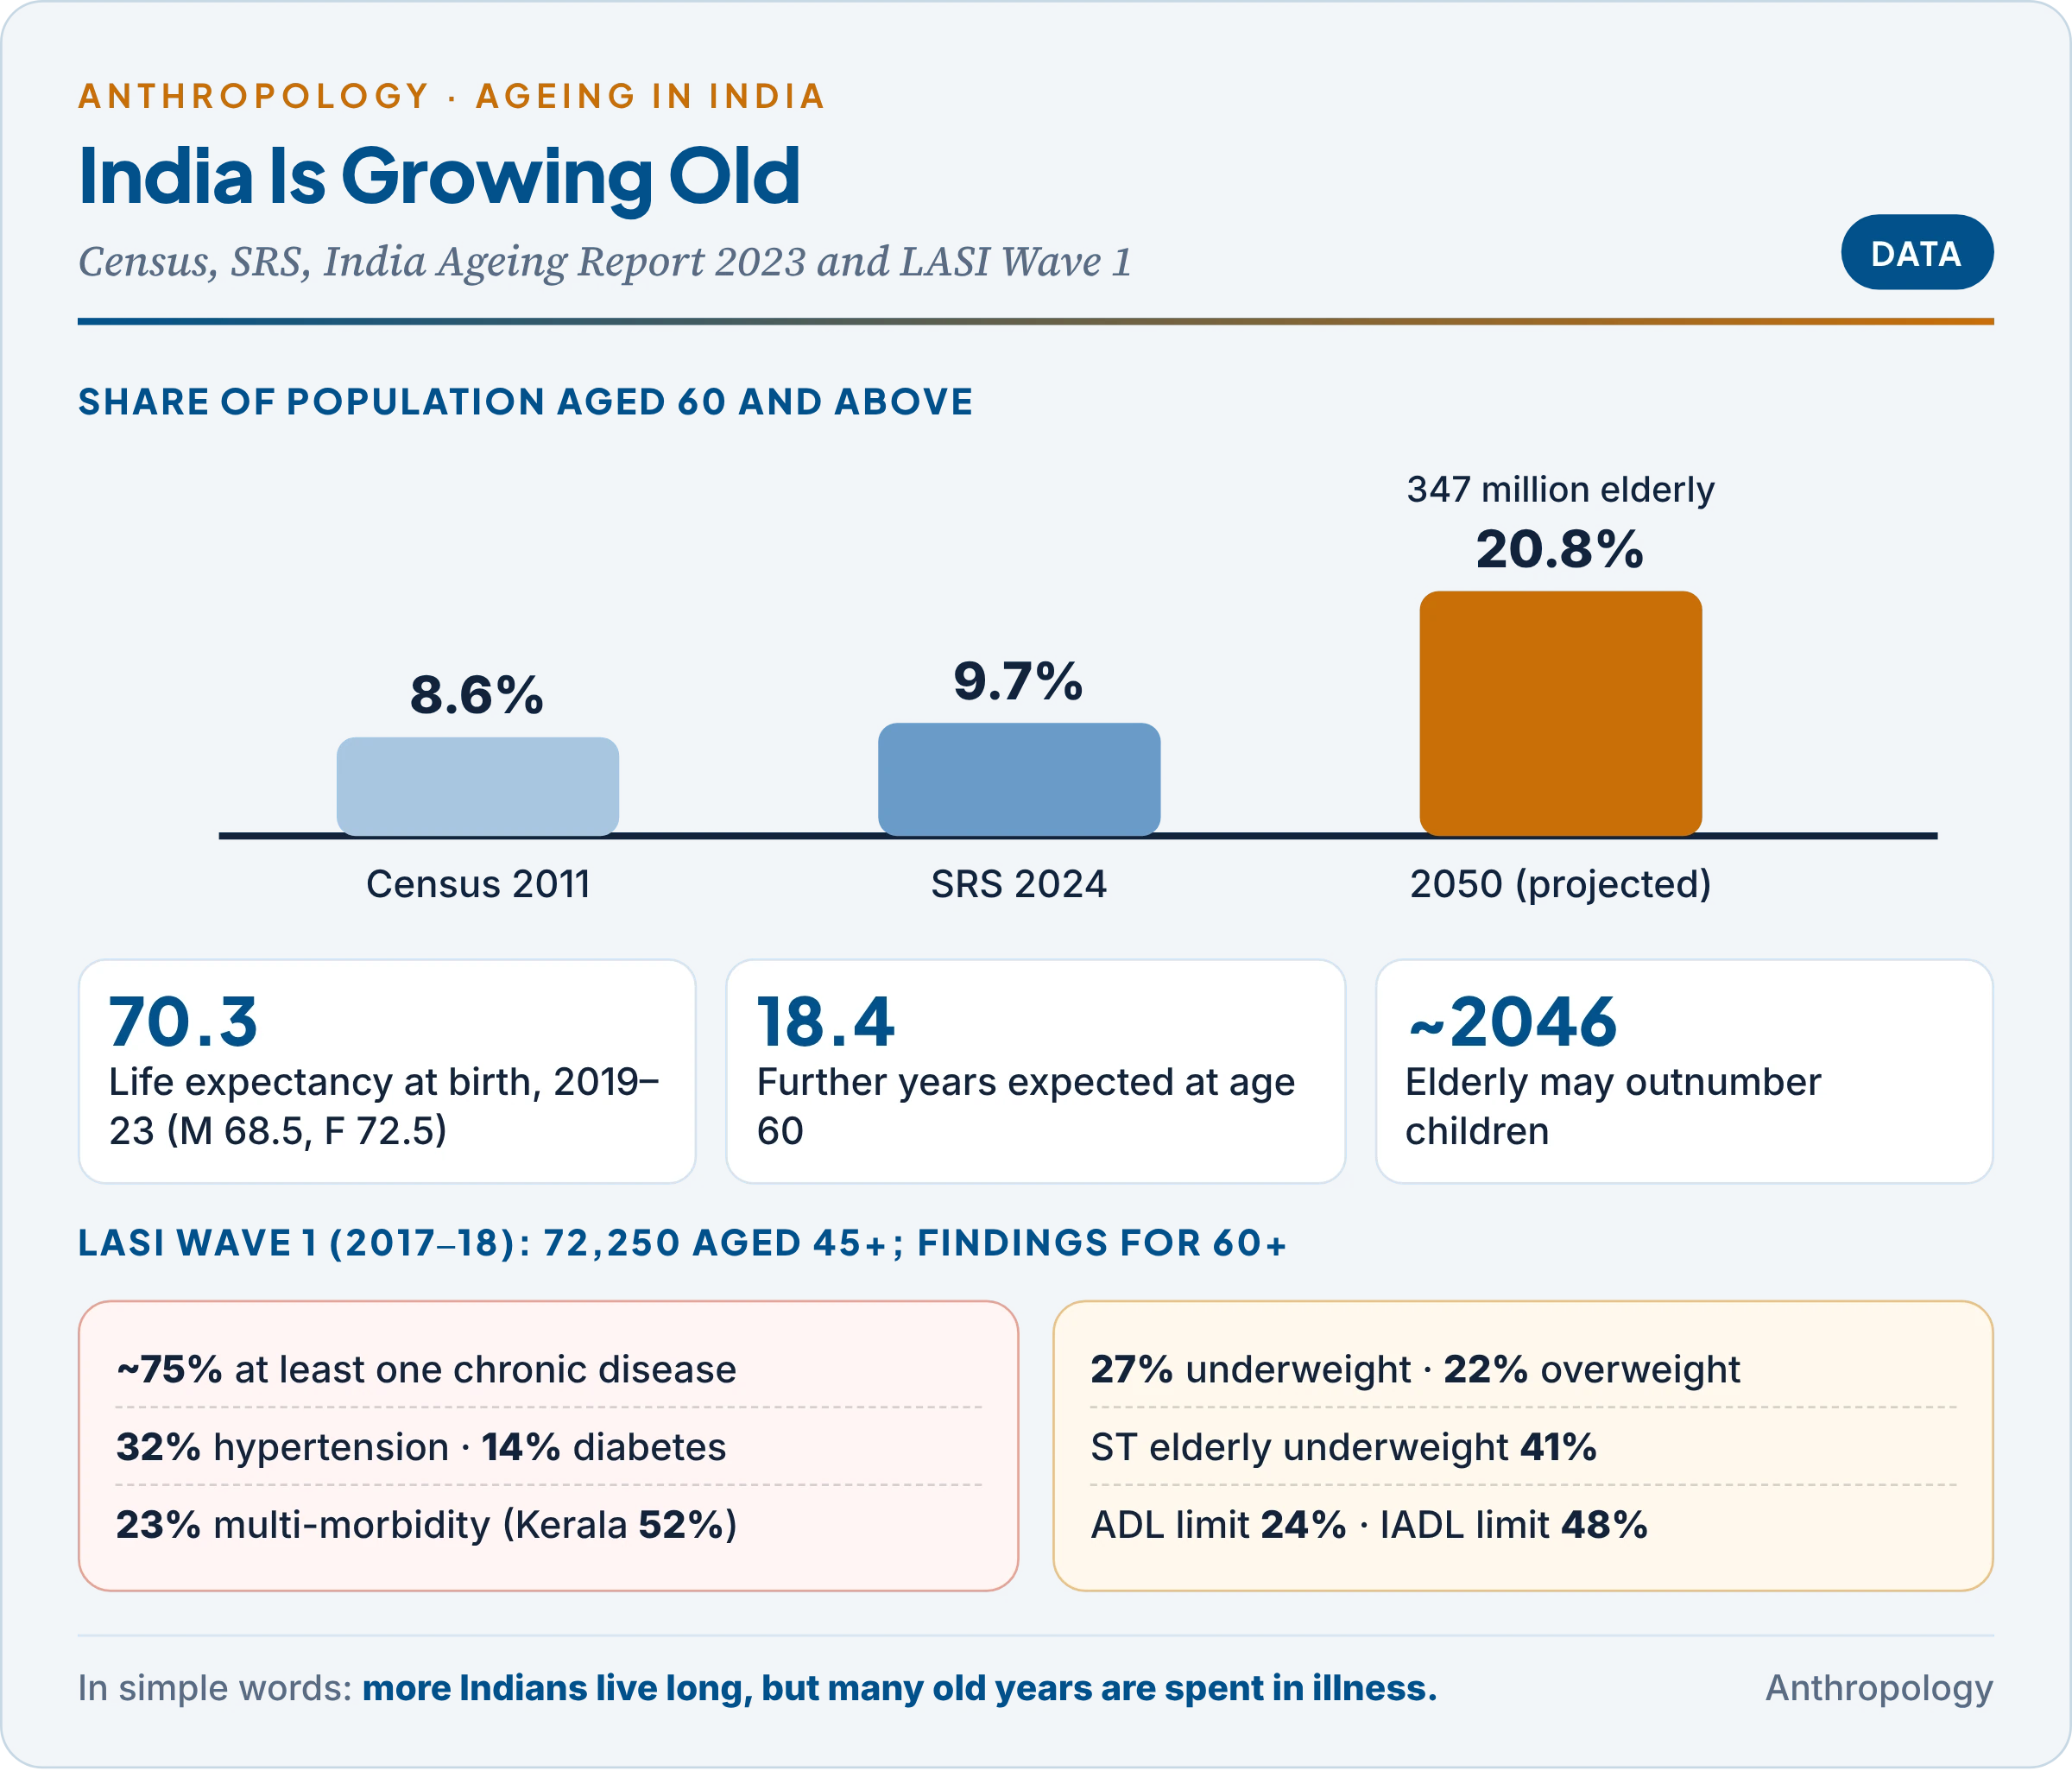
- Census 2011: about 104 million aged 60+, 8.6% of the population.
- SRS Statistical Report 2024 (May 2026): the 60+ share has reached 9.7%, while children aged 0–14 are down to 24.0%.
- India Ageing Report 2023 (UNFPA and the International Institute for Population Sciences, IIPS): 149 million elderly in 2022 (10.5%), projected to reach 347 million (20.8%) by 2050; the elderly may outnumber children by about 2046, and the 80+ group may grow by about 279%, mostly widowed, dependent older women.
- Why: falling fertility (TFR 1.9 in 2024) and rising survival. Kerala and Tamil Nadu are ageing earliest; Bihar and Uttar Pradesh remain younger.
The Longitudinal Ageing Study in India (LASI).
- What it is: India’s first nationally representative panel survey of ageing (one that follows the same people over time), run by IIPS, Mumbai with the Harvard T.H. Chan School of Public Health and the University of Southern California, and harmonised with the American Health and Retirement Study.
- Wave 1 (2017–18; report January 2021): 72,250 people aged 45+ and their spouses, including 31,464 aged 60+, from all states and union territories except Sikkim, with interviews plus biomarkers (blood pressure, lung function, vision, anthropometry, dried blood spots).
- Key findings for those aged 60+:
- about 75% live with at least one chronic disease, about 40% with some disability, and about 20% with mental-health problems (government summary);
- 32% were diagnosed with hypertension and 14% with diabetes; 23% had multi-morbidity (two or more chronic conditions), rising to 52% in Kerala;
- 27% were underweight and 22% overweight or obese: a double burden of malnutrition; underweight reached 41% among Scheduled Tribe elderly;
- 24% had at least one limitation in activities of daily living (bathing, dressing, eating) and 48% in instrumental activities (shopping, managing money).
Issues of the elderly: developing and developed countries. The comparison below explains why the same demographic change has different consequences.
| Issue | Developed countries | Developing countries such as India |
|---|---|---|
| Pace | Aged slowly, after becoming rich | Ageing fast at low income: “old before rich” |
| Income | Universal pensions | Informal-sector work, no pension; reliance on children |
| Care | Institutions, paid carers | Family care by daughters-in-law and daughters, weakened by migration |
| Health | Chronic disease, dementia; strong systems | Double burden of infection, undernutrition and chronic disease; out-of-pocket costs |
| Status | Isolation, loneliness | Loss of authority (§3.5); elder abuse, neglect of widows |
The contrast shows that India must build pensions and long-term care while families are still the main carers. The Maintenance and Welfare of Parents and Senior Citizens Act, 2007 makes children and heirs legally responsible for maintaining parents, and the National Programme for Health Care of the Elderly (2010–11) builds geriatric care into public health services.
5. Human Physique and Somatotypes
In simple words
People differ in build: some are rounded, some muscular, some long and thin. A somatotype is a short code, three numbers, that describes how much of each of these three qualities a body has. It is used in sports, health and growth studies.
An example first. Stand a sumo wrestler, a weightlifter and a marathon runner side by side: heavy and rounded, broad and muscular, long and lean. Each body suits its sport, and each can be described by how much fat, muscle and bone, and linearity it shows. Describing this systematically is somatotyping (Greek soma, body).
Physique (or constitution) means the overall form and make-up of the body, fairly stable in adult life; heredity shapes it most, but nutrition, exercise, disease and age alter it.
5.1 Early typologies
The Greek physician Hippocrates already contrasted a thick-set type prone to stroke with a thin type prone to tuberculosis. The twentieth-century systems differ in method and in what they claimed.
| System | Types | Basis | Main problem |
|---|---|---|---|
| Giacinto Viola (Italian physician) | Longitype, brachitype, normotype, mixed | Measurements and indices | Crude; fell into disuse |
| Ernst Kretschmer (German psychiatrist), Physique and Character (1921) | Pyknic (round, stocky), leptosome or asthenic (long, thin), athletic (muscular), dysplastic | Visual inspection (anthroposcopy) of psychiatric patients | Tied pyknics to manic-depressive illness and leptosomes to schizophrenia; discrete boxes; age confounded the link |
| William Sheldon (American psychologist), The Varieties of Human Physique (1940) | Three continuous components rated 1–7 | Standardised photographs | Subjective; “fixed”; temperament claims |
The table shows the main advance: Kretschmer sorted people into boxes; Sheldon described every person as a mixture of three components. This shift from types to continuous ratings is what made later, measurement-based somatotyping possible.
5.2 Sheldon’s somatotyping
Method. Sheldon, with S.S. Stevens and W.B. Tucker, photographed about 4,000 male college students (aged about 16–20) from front, side and back, examined five body regions (head and neck; thoracic trunk; arms and hands; abdominal trunk; legs and feet), and rated three components on a 1–7 scale, written in fixed order: endomorphy–mesomorphy–ectomorphy.
The three components (named after the three embryonic germ layers):
- Endomorphy: softness and roundness; abdomen larger than chest, soft contours, tapering limbs. Extreme endomorph: 7-1-1.
- Mesomorphy: muscle and bone; hard, rectangular build, broad shoulders, chest dominant over abdomen. Extreme mesomorph: 1-7-1.
- Ectomorphy: linearity and fragility; long, slender limbs, thin bones, flat chest, large skin surface for its mass. Extreme ectomorph: 1-1-7. An average build is about 4-4-4.
Temperament claims. In The Varieties of Temperament (1942) Sheldon tied endomorphy to a relaxed, sociable temper (viscerotonia), mesomorphy to an assertive one (somatotonia) and ectomorphy to a restrained, intellectual one (cerebrotonia). These links have not been confirmed and are regarded as pseudo-scientific.
Critique.
- Subjective: ratings depended on the observer’s eye.
- Narrow sample: young white males only.
- “Fixed for life”: Sheldon held the somatotype to be genetically fixed; growth and training studies show that it changes.
- Ignores size, and the closed 1–7 scale could not fit extreme athletes.
- Ethics: the nude “posture photographs” taken at American universities later became a public controversy.
The British physician R.W. Parnell (1958) took the first step towards objectivity with an anthropometric version (the M.4 deviation chart).
5.3 The Heath–Carter anthropometric somatotype
Who and when. The American anthropologist Barbara Honeyman Heath, once Sheldon’s collaborator, criticised his method from 1963 and, with the physical educationist J.E. Lindsay Carter, published “A modified somatotype method” in 1967, now the world standard. It treats the somatotype as a description of present shape, not a fixed genetic destiny:
- Endomorphy: relative fatness, the amount of fat relative to height.
- Mesomorphy: relative musculo-skeletal robustness per unit of height.
- Ectomorphy: relative linearity or slenderness.
Ratings can be anthropometric (most used), photoscopic or combined, on an open-ended scale from 0.5 upward, so extreme physiques (a sumo wrestler’s endomorphy above 10) fit.
The ten measurements.
- Height and body weight;
- four skinfolds (with calipers): triceps, subscapular, supraspinale, medial calf;
- two bone breadths: humerus (elbow) and femur (knee);
- two girths: flexed upper arm and calf, each corrected by subtracting the skinfold at that site.
The equations.
- Endomorphy = −0.7182 + 0.1451X − 0.00068X² + 0.0000014X³, where X = (triceps + subscapular + supraspinale skinfolds, in mm) × 170.18 ÷ height in cm (the correction scales fatness to height).
- Mesomorphy = 0.858 × humerus breadth + 0.601 × femur breadth + 0.188 × corrected arm girth + 0.161 × corrected calf girth − 0.131 × height + 4.5 (breadths and girths in cm).
- Ectomorphy uses the height–weight ratio (HWR) = height ÷ ∛weight. If HWR ≥ 40.75, ectomorphy = 0.732 HWR − 28.58; if HWR is between 38.25 and 40.75, ectomorphy = 0.463 HWR − 17.63; if HWR ≤ 38.25, ectomorphy = 0.1.
5.4 Worked example and the somatochart
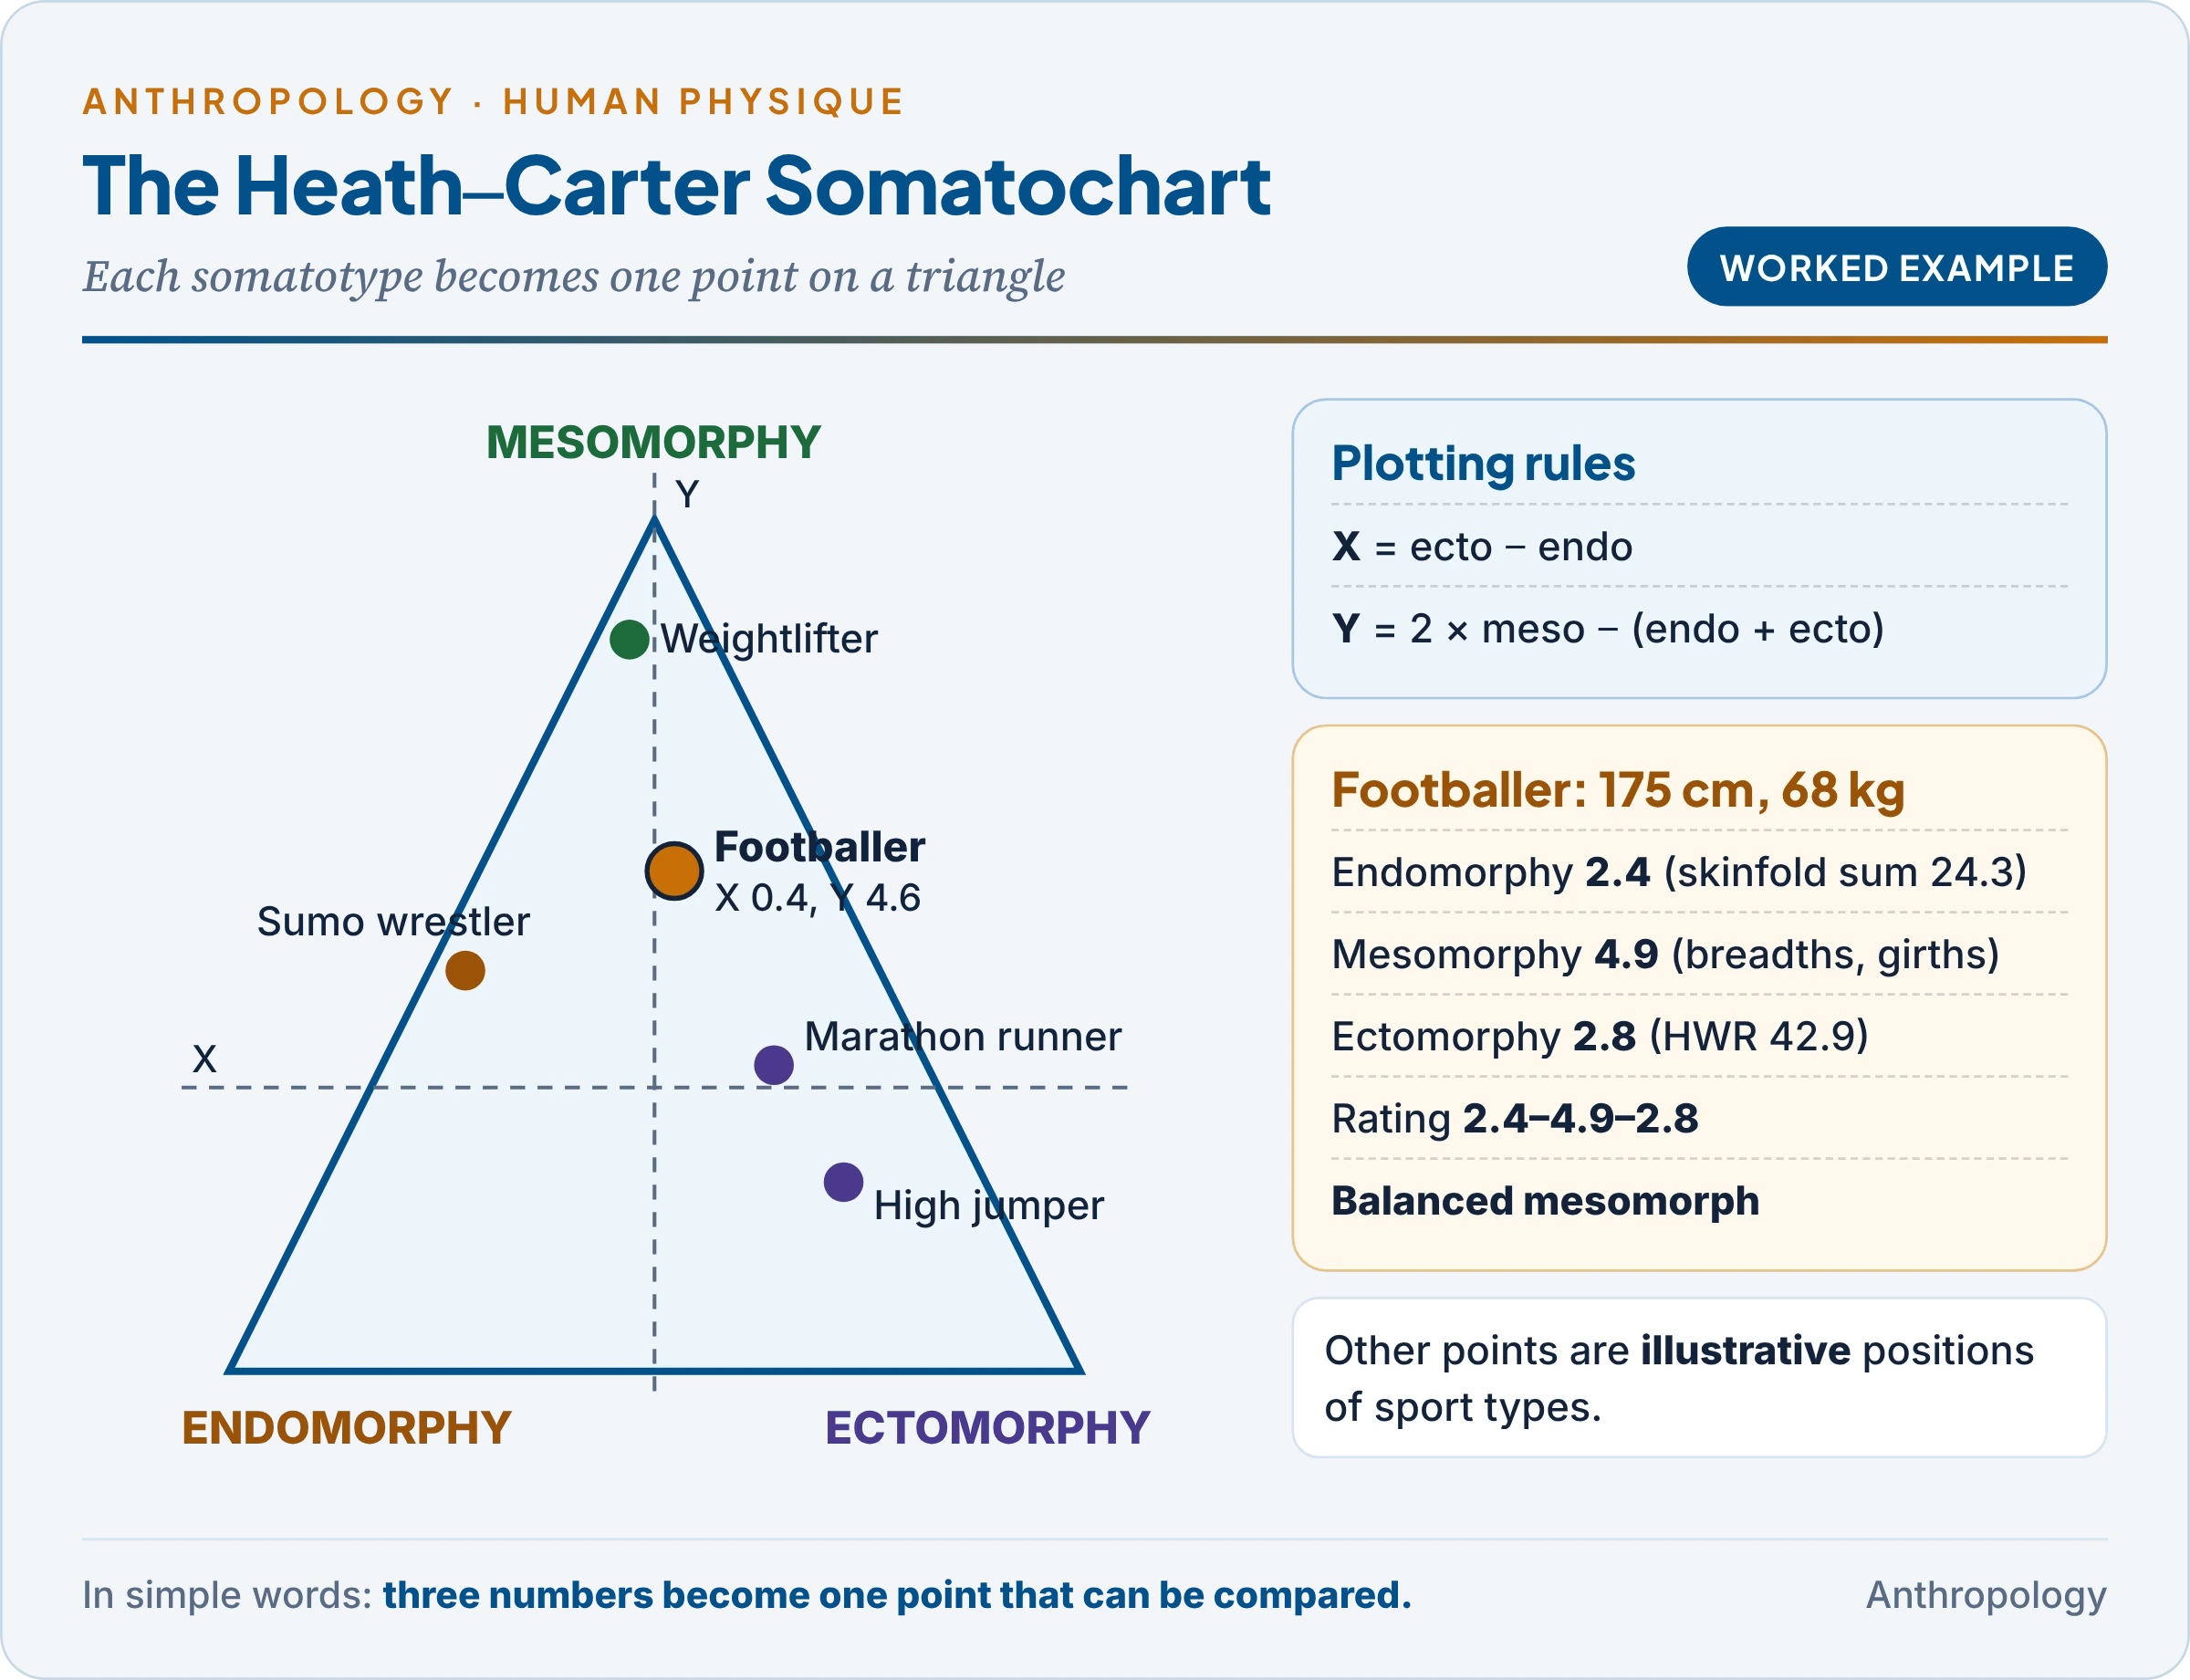
A young male footballer has these measurements: height 175 cm, weight 68 kg; skinfolds triceps 8 mm, subscapular 10 mm, supraspinale 7 mm, medial calf 6 mm; humerus breadth 7.0 cm, femur breadth 9.6 cm; flexed arm girth 32 cm, calf girth 36 cm.
The table works through each step.
| Step | Calculation | Result |
|---|---|---|
| Corrected skinfold sum (X) | (8 + 10 + 7) × 170.18 ÷ 175 | 24.3 |
| Endomorphy | −0.7182 + 0.1451(24.3) − 0.00068(24.3)² + 0.0000014(24.3)³ | 2.4 |
| Corrected girths | Arm 32 − 0.8 = 31.2 cm; calf 36 − 0.6 = 35.4 cm | 31.2; 35.4 |
| Mesomorphy | 0.858(7.0) + 0.601(9.6) + 0.188(31.2) + 0.161(35.4) − 0.131(175) + 4.5 | 4.9 |
| HWR | 175 ÷ ∛68 = 175 ÷ 4.08 | 42.9 |
| Ectomorphy | 0.732(42.9) − 28.58 | 2.8 |
| Somatotype | Endo–meso–ecto | 2.4–4.9–2.8 |
| Somatochart X | Ectomorphy − endomorphy = 2.8 − 2.4 | 0.4 |
| Somatochart Y | 2 × mesomorphy − (endomorphy + ectomorphy) = 9.8 − 5.2 | 4.6 |
Reading the result. Mesomorphy dominates and the other two are nearly equal (within half a unit), so this footballer is a balanced mesomorph, typical of team-sport players. On the somatochart (a triangular graph on which each somatotype is one point) he plots at X = 0.4, Y = 4.6, up towards the mesomorphy corner. The chart shows at a glance how an individual compares with the average of his sport and how far two somatotypes lie apart.
5.5 Why measurements instead of photographs: Sheldon and Heath–Carter compared
The comparison below answers the question of why Heath and Carter replaced Sheldon’s photographs with anthropometry.
| Point | Sheldon (1940) | Heath–Carter (1967) |
|---|---|---|
| Data | Nude photographs, judged by eye | Ten anthropometric measurements, with formulas (photos optional) |
| Objectivity | Subjective; rater-dependent | Objective and repeatable; trained measurers agree closely |
| Nature of somatotype | Fixed genetic “morphogenotype” | Present phenotype, which changes with age, diet and training |
| Scale | Closed, 1–7 | Open-ended, from 0.5 upward |
| Who | Young white males | Both sexes, all ages, all populations |
| Field use | Studio photography needed | Portable calipers and tapes; works in villages and sports grounds |
| Analysis | Descriptive | Somatochart, X–Y coordinates, distances; suitable for statistics |
The reasons in short: measurements remove observer bias, allow change over time to be tracked, avoid the ethical problem of nude photographs, and produce numbers that can be compared statistically across sexes, ages and populations. The cost is that anthropometric ratings depend on careful, standardised technique, and skinfolds vary with hydration and caliper type.
5.6 Applications
- Sports science (kinanthropometry): weightlifters, wrestlers and sprinters are mesomorphic; marathon runners and high jumpers ectomorphic; throwers and sumo wrestlers endo-mesomorphic (Carter and Heath, Somatotyping: Development and Applications, 1990). Somatotyping aids talent identification, choice of playing position and monitoring of training, though skill and physiology matter as much as build.
- Growth, ageing and health: somatotypes shift through childhood; adults gain endomorphy with age; high endomorphy goes with obesity, diabetes and heart-disease risk.
- Population comparison and ergonomics: comparing groups shows the effect of environment and work on body form and informs equipment design (Unit 12).
Common confusion
Is a somatotype the same as body composition? No. Body composition divides weight into compartments, usually fat mass and fat-free (lean) mass, measured by skinfolds, impedance or scanning. A somatotype describes overall shape on three scales, of which only endomorphy reflects fatness; mesomorphy and ectomorphy describe robustness and linearity.
6. Methodologies for Growth Studies
In simple words
There are two basic ways to study growth. You can measure many children of different ages once, or you can follow the same children and measure them again and again as they grow. A third way mixes the two to get most of the benefits at lower cost.
An example first. To learn how girls in a Jharkhand district grow from 6 to 15, a researcher can (A) measure 1,000 girls aged 6–15 this year and plot average height at each age, in a few months; or (B) measure 100 six-year-olds every year until 15, taking nine years but showing when each girl’s spurt began and how fast she grew. Plan A is cross-sectional; Plan B is longitudinal. Every growth study chooses between, or combines, the two.
The science of human growth is called auxology (from Greek auxein, to grow).
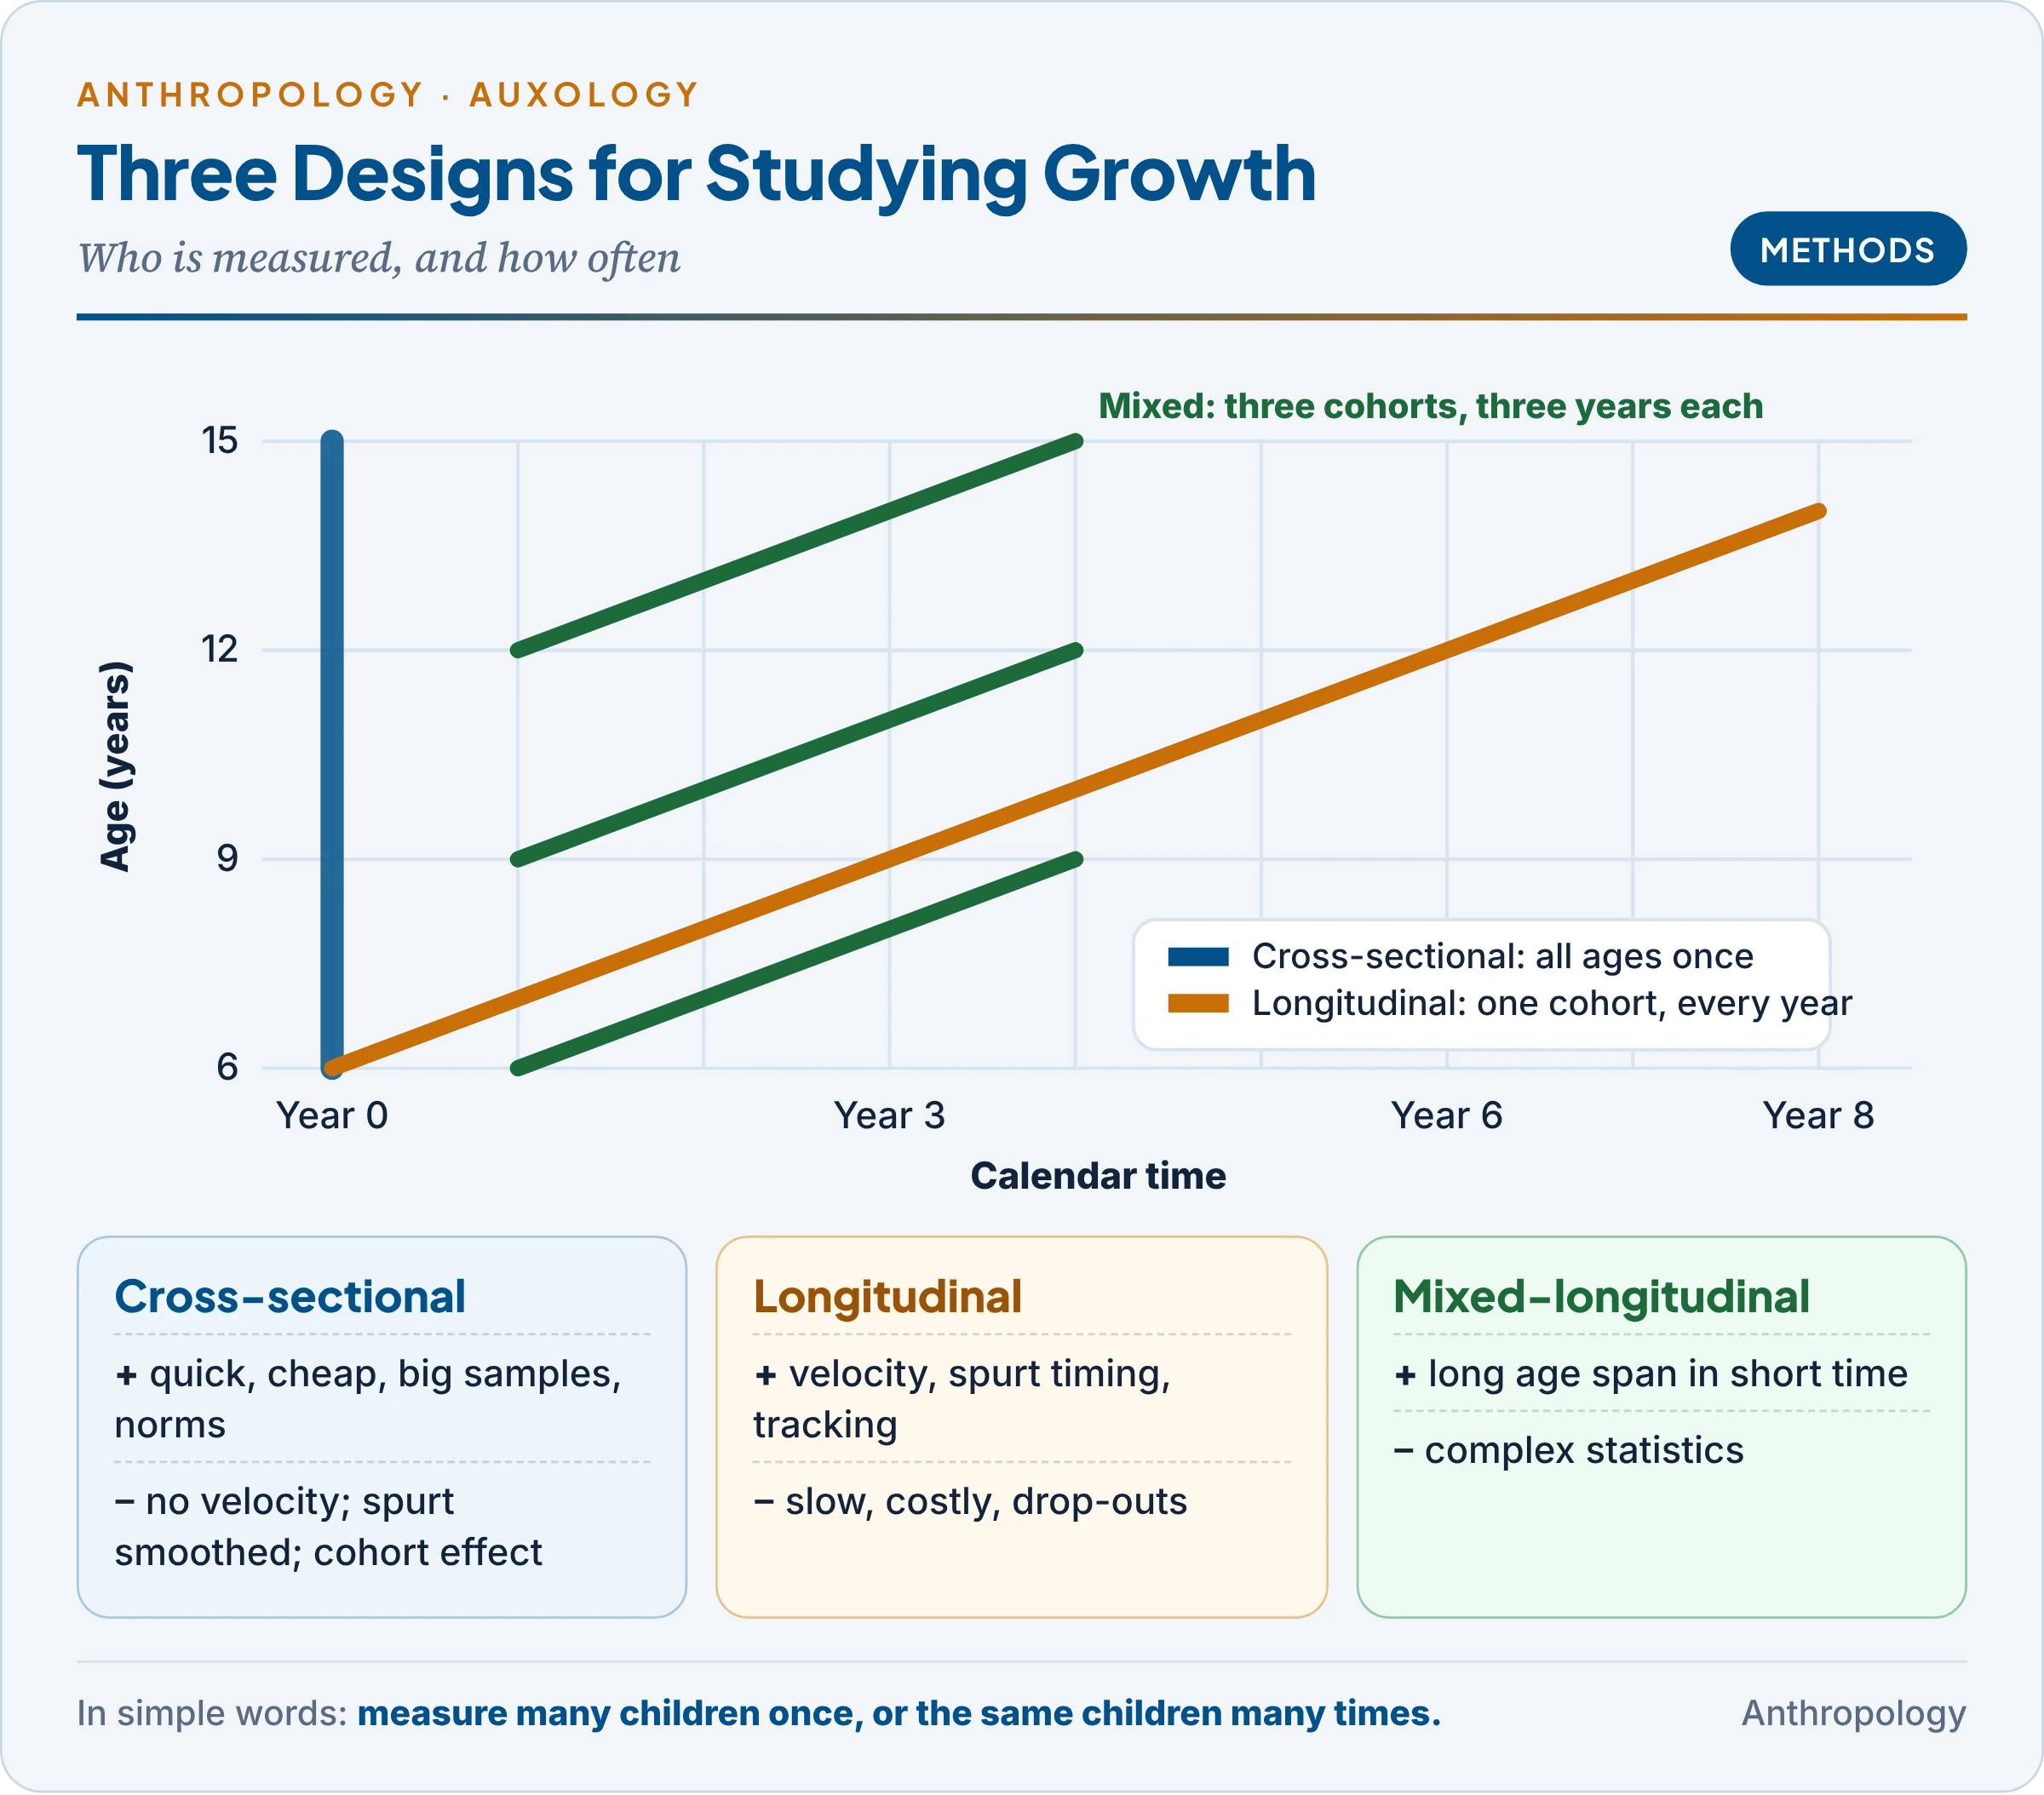
6.1 Cross-sectional method
- What it is: different individuals of different ages are measured once, at about the same time; averages for each age are joined into a growth curve.
- What it yields: a distance curve (size attained at each age) and norms: percentiles or average values for each age and sex, used as growth charts.
- Examples: the ICMR nationwide survey of Indian children (1956–65); the Indian Academy of Pediatrics growth charts revised in 2015; the height and weight data of every NFHS round.
Merits: quick and cheap; large samples, so norms for many ages, regions and groups; no drop-outs and no practice effect.
Limits.
- Cannot measure velocity (rate of growth) or the timing of the spurt for any individual: averaging children who spurt at different ages smooths the spurt away, so the average curve is flatter than any real child’s.
- Hides individual variation and says nothing about tracking (whether a tall child stays tall) or catch-up growth.
- Cohort effect: with a secular trend (each generation growing taller, Unit 10a), part of the difference between ages is really a difference between birth cohorts.
6.2 Longitudinal method
- What it is: the same individuals are measured repeatedly, at fixed intervals (often every three, six or twelve months), over a long period.
- What it yields: individual velocity curves, the age at peak height velocity, the timing of puberty, tracking and canalisation (the tendency of a child to return to his or her growth path after a set-back), and links between early growth and later health.
- Classic examples: the Fels Longitudinal Study (Ohio, USA, from 1929), the Harpenden Growth Study in England led by the British auxologist James Tanner (from 1949), which produced the Tanner–Whitehouse standards and stages of puberty; and in India the New Delhi Birth Cohort, about 8,000 babies born in 1969–72 and measured at short intervals through childhood, later used to show that thin infants who gained weight rapidly in childhood had higher adult diabetes risk.
Merits: shows change within individuals (velocity, spurts, tracking, catch-up); reveals differences in tempo between early and late maturers that averages hide; supports cause-and-effect inferences about what early factor predicts later growth or disease.
Limits.
- Slow and expensive: results take years, and funding and staff must last decades.
- Attrition: families drop out, and those who stay are often better-off or healthier, biasing results.
- Measurement drift: repeated testing and changes of measurers or instruments add errors.
- Small samples, and a cohort that grew up in unusual times (famine, war) may not represent later generations.
6.3 Mixed-longitudinal method
- What it is: several cohorts of different starting ages are followed for a few years each, so that their age ranges overlap. For example, children aged 6, 9 and 12 are each followed for three years, covering ages 6 to 15 in just three years. Also called semi-longitudinal; the psychological version is the cross-sequential or cohort-sequential design of the American psychologist K. Warner Schaie.
- Example: the WHO Multicentre Growth Reference Study (1997–2003), in six countries including India (New Delhi), followed children longitudinally from birth to 24 months and studied children aged 18 to 71 months cross-sectionally. Its result, the WHO Child Growth Standards (2006), is now used in India’s child-nutrition programmes.
Merits: covers a long age span in a short time at moderate cost; gives velocity data within each segment as well as norms for every age; separates age effects from cohort effects, because overlapping cohorts can be compared at the same ages.
Limits: complex statistics are needed to join the segments; some attrition and a need for standardisation across cohorts; no child is followed across the whole of childhood.
6.4 The three designs compared
The table brings the three designs together; the trade-off is always between time and cost on one side and information about individual change on the other.
| Point | Cross-sectional | Longitudinal | Mixed-longitudinal |
|---|---|---|---|
| Subjects | Different people at each age, measured once | Same people, measured repeatedly | Several overlapping cohorts, each followed a few years |
| Time needed | Months | Years to decades | A few years |
| Cost | Low | High | Moderate |
| Main output | Distance curves, norms, prevalence | Velocity, spurt timing, tracking, causes | Norms plus segment velocities |
| Cohort effects | Confounded with age | Single cohort | Can be separated |
| Best for | Growth charts; nutrition surveys | Individual patterns; life-course research | Large age span in short time |
The question decides the design: counting stunted children needs a cross-sectional survey; asking why some children spurt early needs a longitudinal one; existing school or clinic records allow a cheaper retrospective study.
6.5 What is measured, and norms
- Anthropometry: height, weight, sitting height, head and mid-upper-arm circumference, skinfolds, breadths and girths, with standard instruments (anthropometer, stadiometer, calipers).
- Maturity indicators: skeletal age from a hand–wrist X-ray (Greulich–Pyle atlas, Tanner–Whitehouse method), dental age, and sexual maturity on Tanner’s five stages.
- Growth curves: distance curves (size at each age) and velocity curves (gain per year), described in Unit 10a.
- Norms, references and standards: a growth norm or reference describes how a particular population actually grew, built from a large cross-sectional sample and expressed as percentiles (3rd, 50th, 97th) or z-scores (standard deviations from the median). A growth standard shows how healthy children should grow under good conditions (the WHO 2006 charts). A child’s position on the chart shows growth status; the share of children below −2 z-scores of height-for-age measures a population’s stunting.
Key Terms
| Term | Meaning in simple words |
|---|---|
| Ageing | All change in the body that comes with passing time |
| Senescence | The phase of decline in which the chance of dying rises with age |
| Chronological age | Years lived since birth |
| Biological age | How old the body is, judged from how well it works |
| Life expectancy | Average years a person of a given age can expect to live |
| Hayflick limit | The fixed number of times a normal cell can divide |
| Telomere | The protective cap at the end of a chromosome, shortened at each division |
| Disposable soma | The idea that the body is maintained only well enough to reproduce |
| Antagonistic pleiotropy | A gene that helps early in life but harms later |
| Somatotype | A three-number code for body shape: fatness, muscularity, linearity |
| Endomorphy | Relative fatness and roundness |
| Mesomorphy | Relative muscle and bone robustness |
| Ectomorphy | Relative linearity and slenderness |
| Cross-sectional study | Measuring different people of different ages once |
| Longitudinal study | Measuring the same people repeatedly over years |
| Mixed-longitudinal study | Following several overlapping age groups for a few years each |
Contemporary Developments
- Faster ageing in India: the SRS Statistical Report 2024 (May 2026) puts the 60+ share at 9.7%, and the SRS Abridged Life Tables 2019–23 give life expectancy at birth of 70.3 years and at 60 of 18.4 years.
- India Ageing Report 2023: projects 347 million elderly (20.8%) by 2050, with elderly outnumbering children by about 2046 and a rapid rise in very old, widowed women.
- LASI as a panel: Wave 1 (72,250 respondents aged 45+) is being followed in further waves, making it India’s main source for tracking the health, income and care of the same older people over time.
- Hallmarks of ageing (2023): the framework of López-Otín and colleagues expanded to twelve hallmarks, adding disabled autophagy, chronic inflammation and gut-microbe imbalance.
Diagrams to Master
- Topic map: senescence → longevity → theories → India’s ageing → somatotypes → growth-study designs.
- Theories of ageing: three families with Medawar, Williams, Kirkwood, Hayflick, Olovnikov, Harman, converging on the hallmarks.
- India’s ageing: 8.6% (2011) → 9.7% (2024) → 20.8% (2050); e₀ 70.3, e₆₀ 18.4; LASI findings.
- Somatochart: three poles, X and Y formulas, one plotted rating (2.4–4.9–2.8 at X 0.4, Y 4.6).
- Growth-study designs: age-by-year grid with a column (cross-sectional), a long diagonal (longitudinal) and short overlapping diagonals (mixed-longitudinal).
Revision Grid
| Scholar | Work (year) | Key idea |
|---|---|---|
| Benjamin Gompertz | 1825 | Adult death rate rises exponentially with age |
| Peter Medawar | 1952 | Mutation accumulation |
| Denham Harman | 1956; 1972 | Free radical and mitochondrial theories |
| George C. Williams | 1957 | Antagonistic pleiotropy |
| Hayflick and Moorhead | 1961 | Limited division of cultured cells |
| Bernard Strehler | Time, Cells and Aging (1962) | Universal, intrinsic, progressive, deleterious |
| Alexey Olovnikov | 1971 | Telomere shortening as cell counter |
| Cowgill and Holmes | Aging and Modernization (1972) | Elderly status falls with modernisation |
| Thomas Kirkwood | 1977 | Disposable soma |
| Lawrence Cohen | No Aging in India (1998) | Old age and senility as family and cultural categories |
| López-Otín and colleagues | 2013; 2023 | Hallmarks of ageing |
| William Sheldon | The Varieties of Human Physique (1940) | Endomorphy, mesomorphy, ectomorphy on 1–7 |
| Heath and Carter | “A modified somatotype method” (1967) | Anthropometric, open-ended somatotype; somatochart |
| James Tanner | Harpenden Growth Study (from 1949) | Longitudinal growth; puberty stages |
| WHO MGRS | 1997–2003; standards 2006 | Mixed design; international growth standard |
Previous Year Questions
Unit 10: Ageing and senescence, longevity, physique and somatotypes, methodologies for growth studies
- 2026What is meant by a somatotype? Discuss the Heath-Carter anthropometric method, giving its advantages over that of Sheldon’s method. How can somatotyping be applied in sports sciences?
- 2023What is mixed-longitudinal method of studying human growth? Discuss its merits and demerits.
- 2022Why Heath and Carter used anthropometric measurements instead of photographs of an individual to assess the somatotype? Elaborate their method.
- 2021Discuss the physiological and evolutionary theories of aging.
- 2020Write notes on the Senescence in about 150 words.
- 2019Discuss the methods of studying human growth with their merits and demerits.
- 2018Write a note in 150 words on Issues of Elderly and Senescence in Developing and Developed Countries.
- 2017Discuss Sheldon’s method of somatotyping.
- 2017Describe the various methods of studying growth highlighting their merits and demerits.
- 2015Write a note in 150 words on Longitudinal method of studying growth.
- 2015What is an anthropometric somatotype? Describe Heath and Carter’s method of somatotyping.
- 2014Write a note in 150 words on Cross-sectional methods of studying human growth.
- 2014Discuss Ageing and Senescence. Describe either the biological or social theories of Ageing.
- 2013Write a note on Aging and Senescence in 150 words.
- 2012Explain any two biological theories of aging based on purposeful events.
- 2011Describe different methods of studying human growth.
- 2011Define somatotype. Describe the salient features of different components of somatotype.
- 2010Write a note in 150 words on Senescence and socio-economics in contemporary times.
- 2009Discuss the theories of ‘Aging’
- 2006Describe various methods of studying Human Growth specifying their merits and demerits.
- 2005Write a note on Aging.
- 2002Write a note on Methods for the study of human growth.
- 1999What is meant by physical growth: norms? How are these made and how do they depict the growth status of a population?
- 1998Write a note on Growth curves.
- 1997Write a note on Longitudinal growth.
- 1995Write a note on Senescence.
- 1990Describe the methods of studying growth and physical development of children. Discuss the role of hormonal and nutritional factors on human growth and development.
- 1985Give a short account of the present-day growth studies in India.
Related questions from other units
- 2026Unit 10: Write notes on: Canalization and catch-up growth.
- 2021Unit 12: What is Anthropometry ? Discuss its role in assessing the nutritional status and sports capability of a person.
- 2020Unit 10: Secular trend in human growth can be positive, negative or neutral. Illustrate with examples.
- 2015Unit 12: Elucidate the role of Anthropology in selection and monitoring of sports persons.
- 2013Unit 9.7: Justify “Though human growth is under tight genetic control but it is influenced by various environmental factors.” (250 words).
- 2011Unit 12: Explain the application of anthropological knowledge in genetic counseling, forensic science, sports and nutrition.
- 2004Unit 12: Write a note on Anthropology of Sports.
- 1997Unit 12: Write a note on Anthropology of Sports.