

Official syllabusPaper II · Unit 2 · Psychological Well Being and Mental Disorders
Happiness disposition.
Definition
“I use the term happiness to refer to the experience of joy, contentment, or positive well-being, combined with a sense that one’s life is good, meaningful, and worthwhile.”
Lyubomirsky (2007)
A happiness disposition is the stable, trait-like level of subjective well-being around which a person’s moods rise and fall. Whether genes and temperament fix that level, or circumstance, effort and policy can move it, decides two applied debates: whether happiness improves health, and whether economic growth makes nations happier.
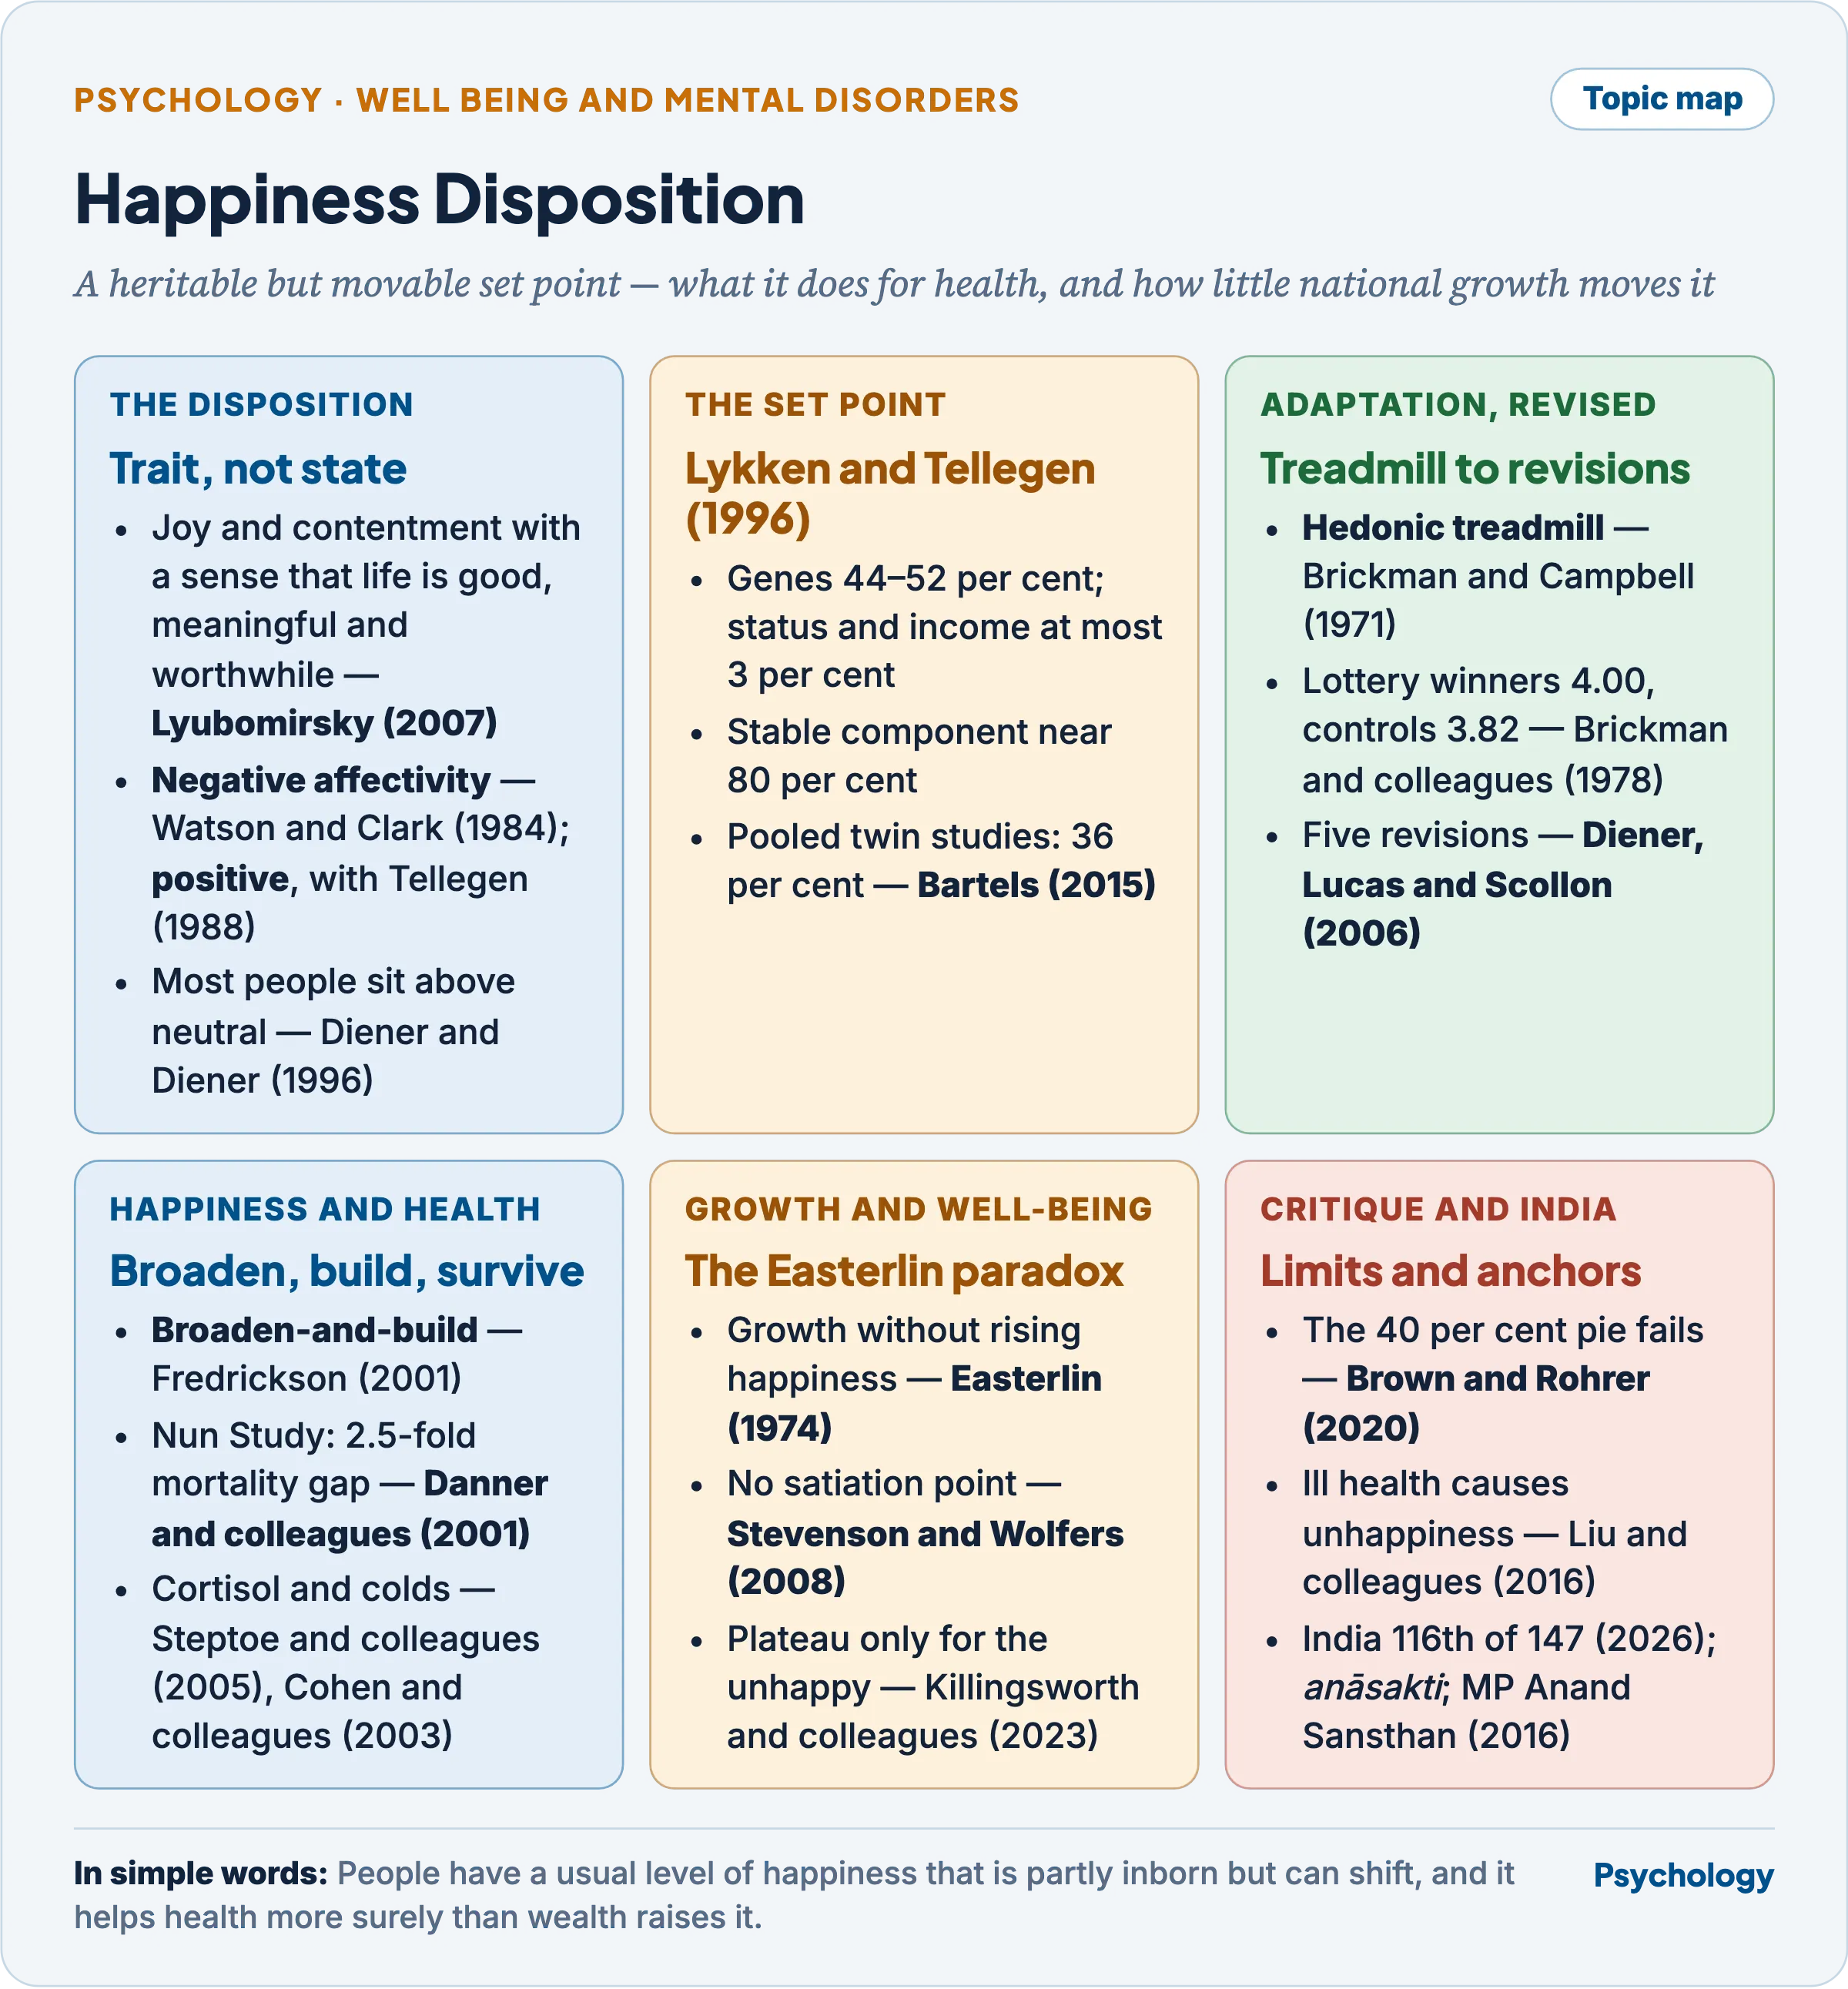
A heritable but movable set point is central; its effects on health are real, and its tie to national income is weaker than growth promises.
Happiness disposition: trait and state
- State happiness is momentary positive feeling; trait or dispositional happiness is the average level over months and years, measured by the Subjective Happiness Scale (Lyubomirsky and Lepper, 1999), the Oxford Happiness Questionnaire (Hills and Argyle, 2002) or averaged experience samples.
- Its components are those of subjective well-being — life satisfaction, positive affect, low negative affect (Diener, 1984).
- Watson and Clark (1984) defined negative affectivity as “the disposition to experience aversive emotional states”; its counterpart is positive affectivity (Watson, Clark and Tellegen, 1988). The two are largely independent, so a happy disposition means much positive affect, not merely little distress.
- Theories fall into three families (Diener, Oishi and Lucas, 2002): need and goal satisfaction; process or activity, such as flow (Csikszentmihalyi, 1975); and genetic and personality predisposition — the disposition view.
- Most samples report above-neutral well-being (Diener and Diener, 1996): the typical disposition is mildly positive.
Set-point theory and the heritability of happiness
- Set-point theory holds that each person has a genetically influenced baseline of well-being; events push happiness up or down, and it drifts back.
- Lykken and Tellegen (1996) — the classic twin study, using the Multidimensional Personality Questionnaire’s Well-Being scale.
- Design: 1,380 pairs of middle-aged Minnesota twins reared together, 111 pairs reared apart, and 127 younger pairs retested ten years later.
- Status, education, income, marital status and religiosity explained at most about 3 per cent of the variance, genes 44–52 per cent (Lykken and Tellegen, 1996). Identical twins reared apart correlated .52; fraternal twins reared together .08.
- Retest data put the heritability of the stable component — trait happiness — near 80 per cent (Lykken and Tellegen, 1996).
- Their line: “It may be that trying to be happier is as futile as trying to be taller and therefore is counterproductive.” Lykken (1999) withdrew it: habits and absorbing activity let people live above their set point.
- Limitations: heritability describes differences within one population, not one person’s share; the 80 per cent figure (Lykken and Tellegen, 1996) rests on small retest samples from an almost wholly white registry.
- Bartels (2015), pooling twin studies (N = 55,974), put heritability lower: 36 per cent for well-being, 32 for life satisfaction.
The hedonic treadmill
- Brickman and Campbell (1971) proposed the hedonic treadmill: emotions adapt to circumstances as senses do, so people return to neutrality and keep striving for gains that will not last — adaptation-level theory (Helson, 1964) applied to happiness.
- Brickman, Coates and Janoff-Bulman (1978) — the classic test.
- 22 major Illinois lottery winners, 22 neighbourhood controls and 29 paralysed accident victims rated present happiness on a 0–5 scale.
- Winners (4.00) were no happier than controls (3.82) and took less pleasure in mundane events (3.33 against 3.82) — a contrast effect. Victims (2.96) stayed above the midpoint and idealised their past.
- Limitations: tiny samples, response rates of 41 and 52 per cent (controls, winners), one interview within 18 months of the event. Victims were about 0.75 standard deviations less happy (Diener, Lucas and Scollon, 2006), so the study never showed complete adaptation.
- Lindqvist, Östling and Cesarini (2020) surveyed 3,362 Swedish lottery players 5–22 years after their win: large prizes raised life satisfaction for over a decade without fading, while effects on happiness and mental health were smaller and not significant.
Revisions to set-point theory
- Diener, Lucas and Scollon (2006) proposed five revisions to the treadmill.
- Non-neutral set points — most people’s baselines are positive.
- Individual set points, partly dependent on temperament.
- Multiple set points — life satisfaction, pleasant and unpleasant emotions can move in different directions.
- Set points can change under some conditions.
- Individual differences in adaptation — some people’s set point shifts after an event and others’ does not.
- Fujita and Diener (2005) followed Germans for 17 years: 24 per cent changed significantly between the first and last five years, almost 9 per cent by 3 or more points on a 0–10 scale.
- Adaptation is incomplete for major losses: lasting drops after unemployment (Lucas, Clark, Georgellis and Diener, 2004) and after disability, 0.40–1.27 standard deviations with little recovery (Lucas, 2007). Marriage gave only a short-lived boost (Lucas and colleagues, 2003).
- Headey and Wearing (1989) proposed the dynamic equilibrium model: personality fixes one’s usual pattern of life events and well-being, and only departures from that pattern move well-being.
Personality correlates of the happiness disposition
- Costa and McCrae (1980), with 1,100 men aged 35–85, found that extraversion predicts positive affect and neuroticism negative affect — and that both predicted happiness ten years later, ruling out a passing mood as the cause.
- Steel, Schmidt and Shultz (2008) meta-analysed the Big Five: extraversion correlated .44 with positive affect, neuroticism .54 with negative affect, and agreeableness and conscientiousness .20–.30 with some components. Personality explained up to 39 per cent of the variance (63 per cent corrected for unreliability).
- Seligman (2002) compressed the position into H = S + C + V — enduring happiness as set range plus circumstances plus voluntary control — with circumstances accounting for only 8–15 per cent of variance.
Can the happiness disposition be raised?
The “40 per cent” claim and its critique
- Lyubomirsky, Sheldon and Schkade (2005) proposed the sustainable happiness model, popularised as a pie: about 50 per cent of differences genetic, 10 per cent circumstances, leaving 40 per cent for intentional activity.
- Brown and Rohrer (2020) found little evidence for that decomposition.
- Between-person variance says nothing about how far one person can change.
- Genes, circumstances and activity are not independent additive parts, and the model omits measurement error, which inflates the residual “40”.
- The 10 per cent came from studies of demographic variables only; with other defensible figures — 80 genetic, 15 circumstances — the activity share falls to 5 per cent (Brown and Rohrer, 2020).
- Sheldon and Lyubomirsky (2021) conceded that “the pie chart part may have outlived its usefulness”, but maintained that intentional behaviour can raise well-being and sustain the gain, with effects “weaker than we initially believed”.
Interventions that raise happiness
- Gratitude — Emmons and McCullough (2003): 192 students listing up to five blessings weekly for ten weeks rated life more favourably and reported fewer physical symptoms than comparison groups.
- Kindness — Dunn, Aknin and Norton (2008): spending on others raised happiness more than spending on oneself. A registered replication (Aknin and colleagues, 2020) confirmed it in 712 students (d = .36), but the effect was null or tiny (d = .06) when adults merely recalled spending.
- Best possible self — King (2001): 81 undergraduates who wrote for 20 minutes on four days about a future in which all had gone well gained in well-being and made fewer illness visits over five months.
- Pooled effects shrink once small-study bias is corrected — the meta-analyses are in Factors Influencing Positive Health, Well-Being, Lifestyle and Quality of Life. Gains last when activities fit the person and are practised with sustained, varied effort (Sheldon and Lyubomirsky, 2021).

Each claim of fixity met a later correction: the set point is real but positive, plural, movable and individual.
Happiness, psychological well-being and health
Broaden-and-build: from happiness to psychological well-being
- Fredrickson (2001): “experiences of positive emotions broaden people’s momentary thought-action repertoires, which in turn serves to build their enduring personal resources, ranging from physical and intellectual resources to social and psychological resources.”
- Negative emotions narrow attention to a survival action — flee, attack. Joy creates the urge to play, interest to explore, contentment to savour and integrate.
- The broadening hypothesis concerns the moment; the building hypothesis, resources that accumulate and are drawn on later.
- Fredrickson, Mancuso, Branigan and Tugade (2000) showed an undoing effect: after an anxiety-inducing speech task, 170 participants shown contentment or amusement films regained cardiovascular baseline faster than those shown neutral or sad films.
- Fredrickson, Cohn, Coffey, Pek and Finkel (2008) tested building in 139 working adults, half randomly assigned to loving-kindness meditation.
- Daily positive emotions rose over the weeks of practice and built resources — mindfulness, purpose in life, environmental mastery, self-acceptance, positive relations, social support, fewer illness symptoms — which raised life satisfaction and cut depressive symptoms.
- Several are Ryff’s dimensions of psychological well-being: happiness builds eudaimonic well-being, not only pleasure.
- Limitations: a waiting-list control, self-report, 63 of 202 enrolled excluded.
- Lyubomirsky, King and Diener (2005) pooled 225 papers (over 275,000 participants): cross-sectional, longitudinal and experimental data show happiness preceding success in work, relationships and health.
- The “positivity ratio” later attached to the theory collapsed; see Health, Ill-Health, Positive Health and Well-Being.
Happiness and longevity
- Danner, Snowdon and Friesen (2001) — the Nun Study.
- 180 School Sisters of Notre Dame wrote autobiographies on entering the order at a mean age of 22; sentences were coded for emotion and survival tracked at ages 75–95.
- Mortality fell stepwise with positive content — a 2.5-fold risk difference between lowest and highest quartiles, median age at death 86.6 against 93.5 years (Danner and colleagues, 2001). Negative content, rare in the essays, predicted nothing.
- Strength: the sisters shared reproductive and marital histories, work and social life, and did not smoke or drink heavily.
- Limitations: no independent personality measure; writing skill is a possible confound, though adjusting for idea density left a 2.2-fold gap; one cohort of women.
- Diener and Chan (2011) reviewed seven types of evidence — prospective, physiological, experimental, animal, quasi-experimental, intervention, quality-of-life — and judged the case for longer life in healthy populations “compelling”, but controversial for diseases such as cancer.
- The meta-analytic mortality estimate (Chida and Steptoe, 2008) is in Health, Ill-Health, Positive Health and Well-Being.
The physiological pathways
- Neuroendocrine and inflammatory — Steptoe, Wardle and Marmot (2005) sampled happiness through a working day in 216 Whitehall II civil servants: cortisol was 32 per cent higher in the least than the most happy fifth, and fibrinogen rose less under laboratory stress in the happy.
- Immune — Cohen, Doyle, Turner, Alper and Skoner (2003) gave 334 healthy volunteers rhinovirus drops in quarantine. The lowest third in positive emotional style were 2.9 times as likely as the highest to develop a verified cold; negative style predicted nothing.
- Cardiovascular — the undoing effect (Fredrickson and colleagues, 2000).
- Behavioural and social — positive emotional style accompanies better sleep and exercise, though these did not explain its link with colds (Cohen and colleagues, 2003); positive emotions build social support, which buffers stress (Fredrickson and colleagues, 2008).
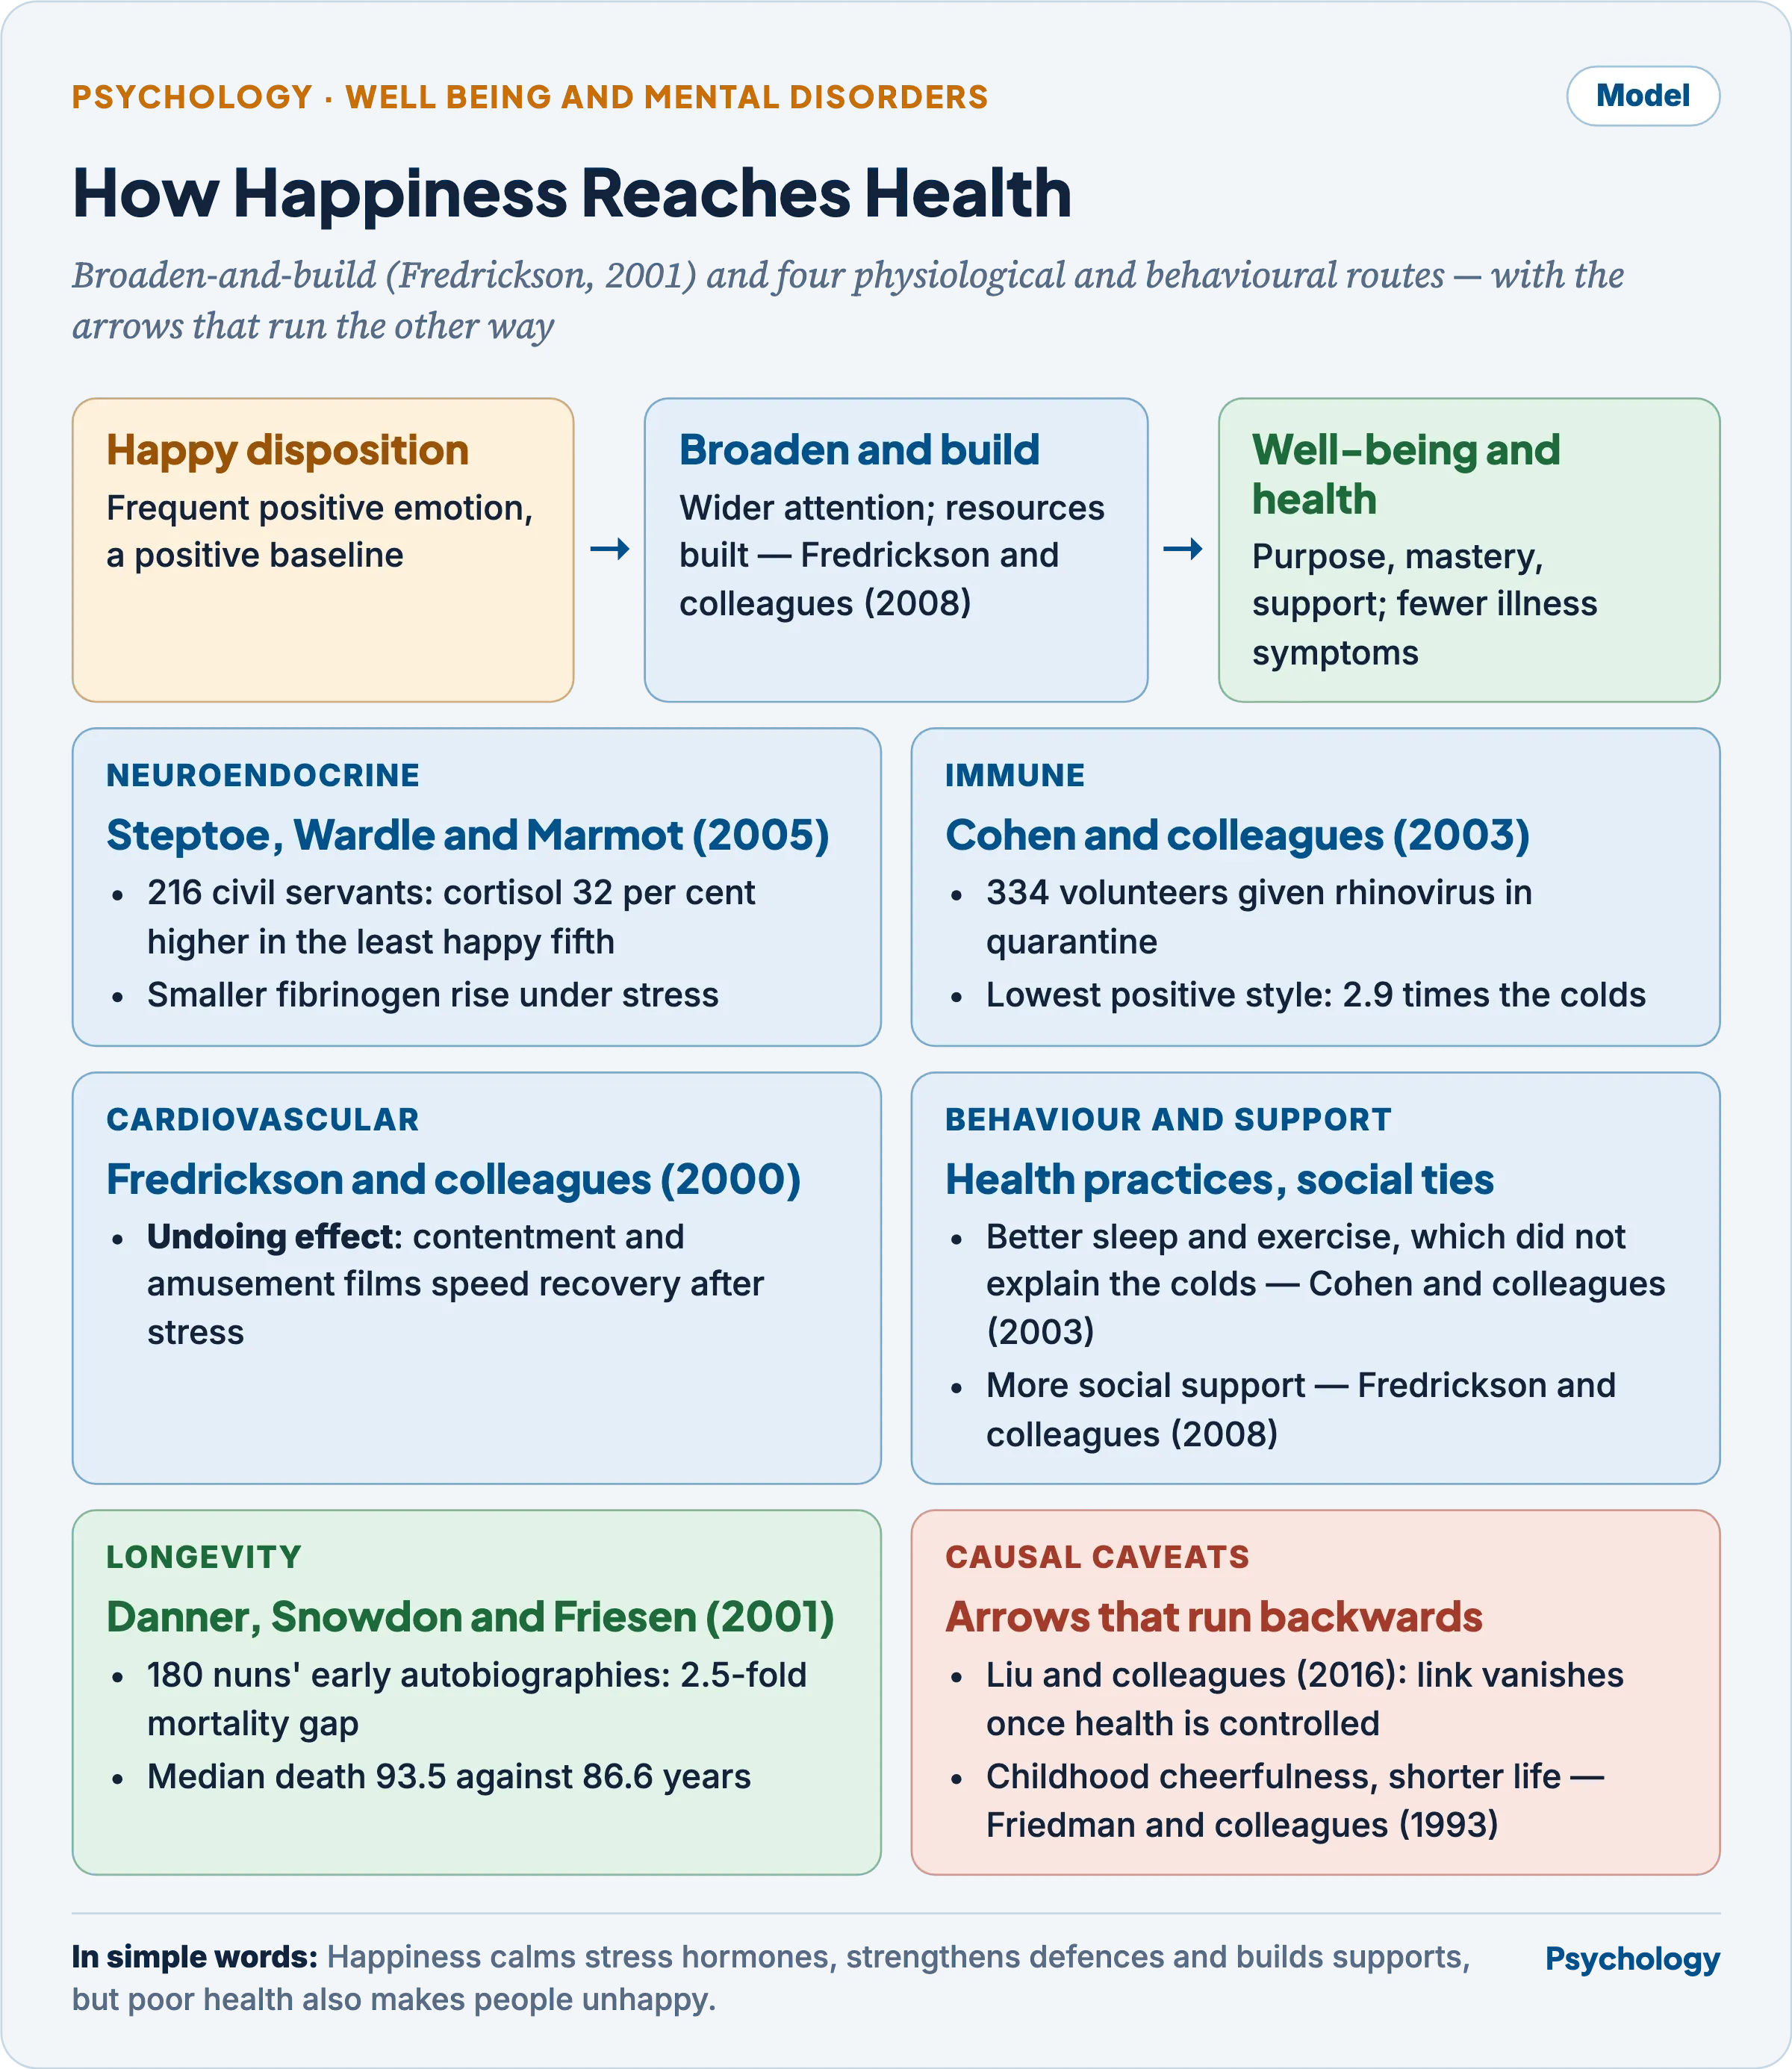
Four routes lead from a happy disposition to health, but each arrow can also run backwards.
The causal caveats
- Reverse causation — Liu and colleagues (2016) followed 719,671 initially healthy British women for ten years. Unhappiness raised age-adjusted mortality (rate ratio 1.29) but not after adjusting for self-rated health and lifestyle (0.98): “poor health can cause unhappiness”. Limitation: one happiness item.
- Cheerfulness can mislead — in Terman’s 1,178 gifted children, childhood cheerfulness predicted shorter lives and conscientiousness longer ones (Friedman and colleagues, 1993), plausibly through carefree risk-taking.
- Intensity — intensely aroused or manic positive affect may harm health (Diener and Chan, 2011).
- Weighing Diener and Chan (2011) against Liu and colleagues (2016): the pathways are real, but whether happiness itself lengthens life stays open once illness, lifestyle and personality are controlled.
Economic growth and human well-being
The Easterlin paradox
- Easterlin (1974) examined 30 surveys from 19 countries (1946–1970). Within every country the rich were happier, yet richer countries were not clearly happier than poorer ones, and Americans in 1970 were no happier than in 1947: the Easterlin paradox.
- His explanation was relative income: people judge their lot against a social norm that rises with average income, so general growth leaves satisfaction unchanged.
- Easterlin and colleagues (2010) extended the test to 37 countries over 12–34 years: no significant relation between growth rate and rise in life satisfaction, although happiness tracked booms and recessions in the short run.
The challenge from absolute income
- Stevenson and Wolfers (2008) reanalysed the major datasets: well-being rises with log GDP per capita across countries with “no evidence of a satiation point”, the cross-country gradient matches the within-country one, and growth accompanies rising happiness.
- On a log scale each doubling of income buys a similar gain, so a flat trend in a rich country can hide a real income effect; Easterlin’s reply is that critics confuse short-run fluctuations with the long-run trend (Easterlin and colleagues, 2010).
Income and emotional well-being
- Kahneman and Deaton (2010) analysed over 450,000 American responses: life evaluation rose steadily with log income, but emotional well-being stopped rising beyond about $75,000 a year. Their verdict: “high income buys life satisfaction but not happiness”.
- Killingsworth (2021), using 1,725,994 experience samples from 33,391 employed Americans, found experienced well-being rising linearly with log income, with no plateau.
- Killingsworth, Kahneman and Mellers (2023), an adversarial collaboration, reconciled them: the plateau exists only for the least happy 15–20 per cent, beyond about $100,000; for the happier majority happiness keeps rising, fastest among the happiest. The 2010 measure had captured unhappiness.
- Most of this evidence is cross-sectional; the strongest causal test, lottery wealth (Lindqvist and colleagues, 2020), moved evaluation far more than affect.
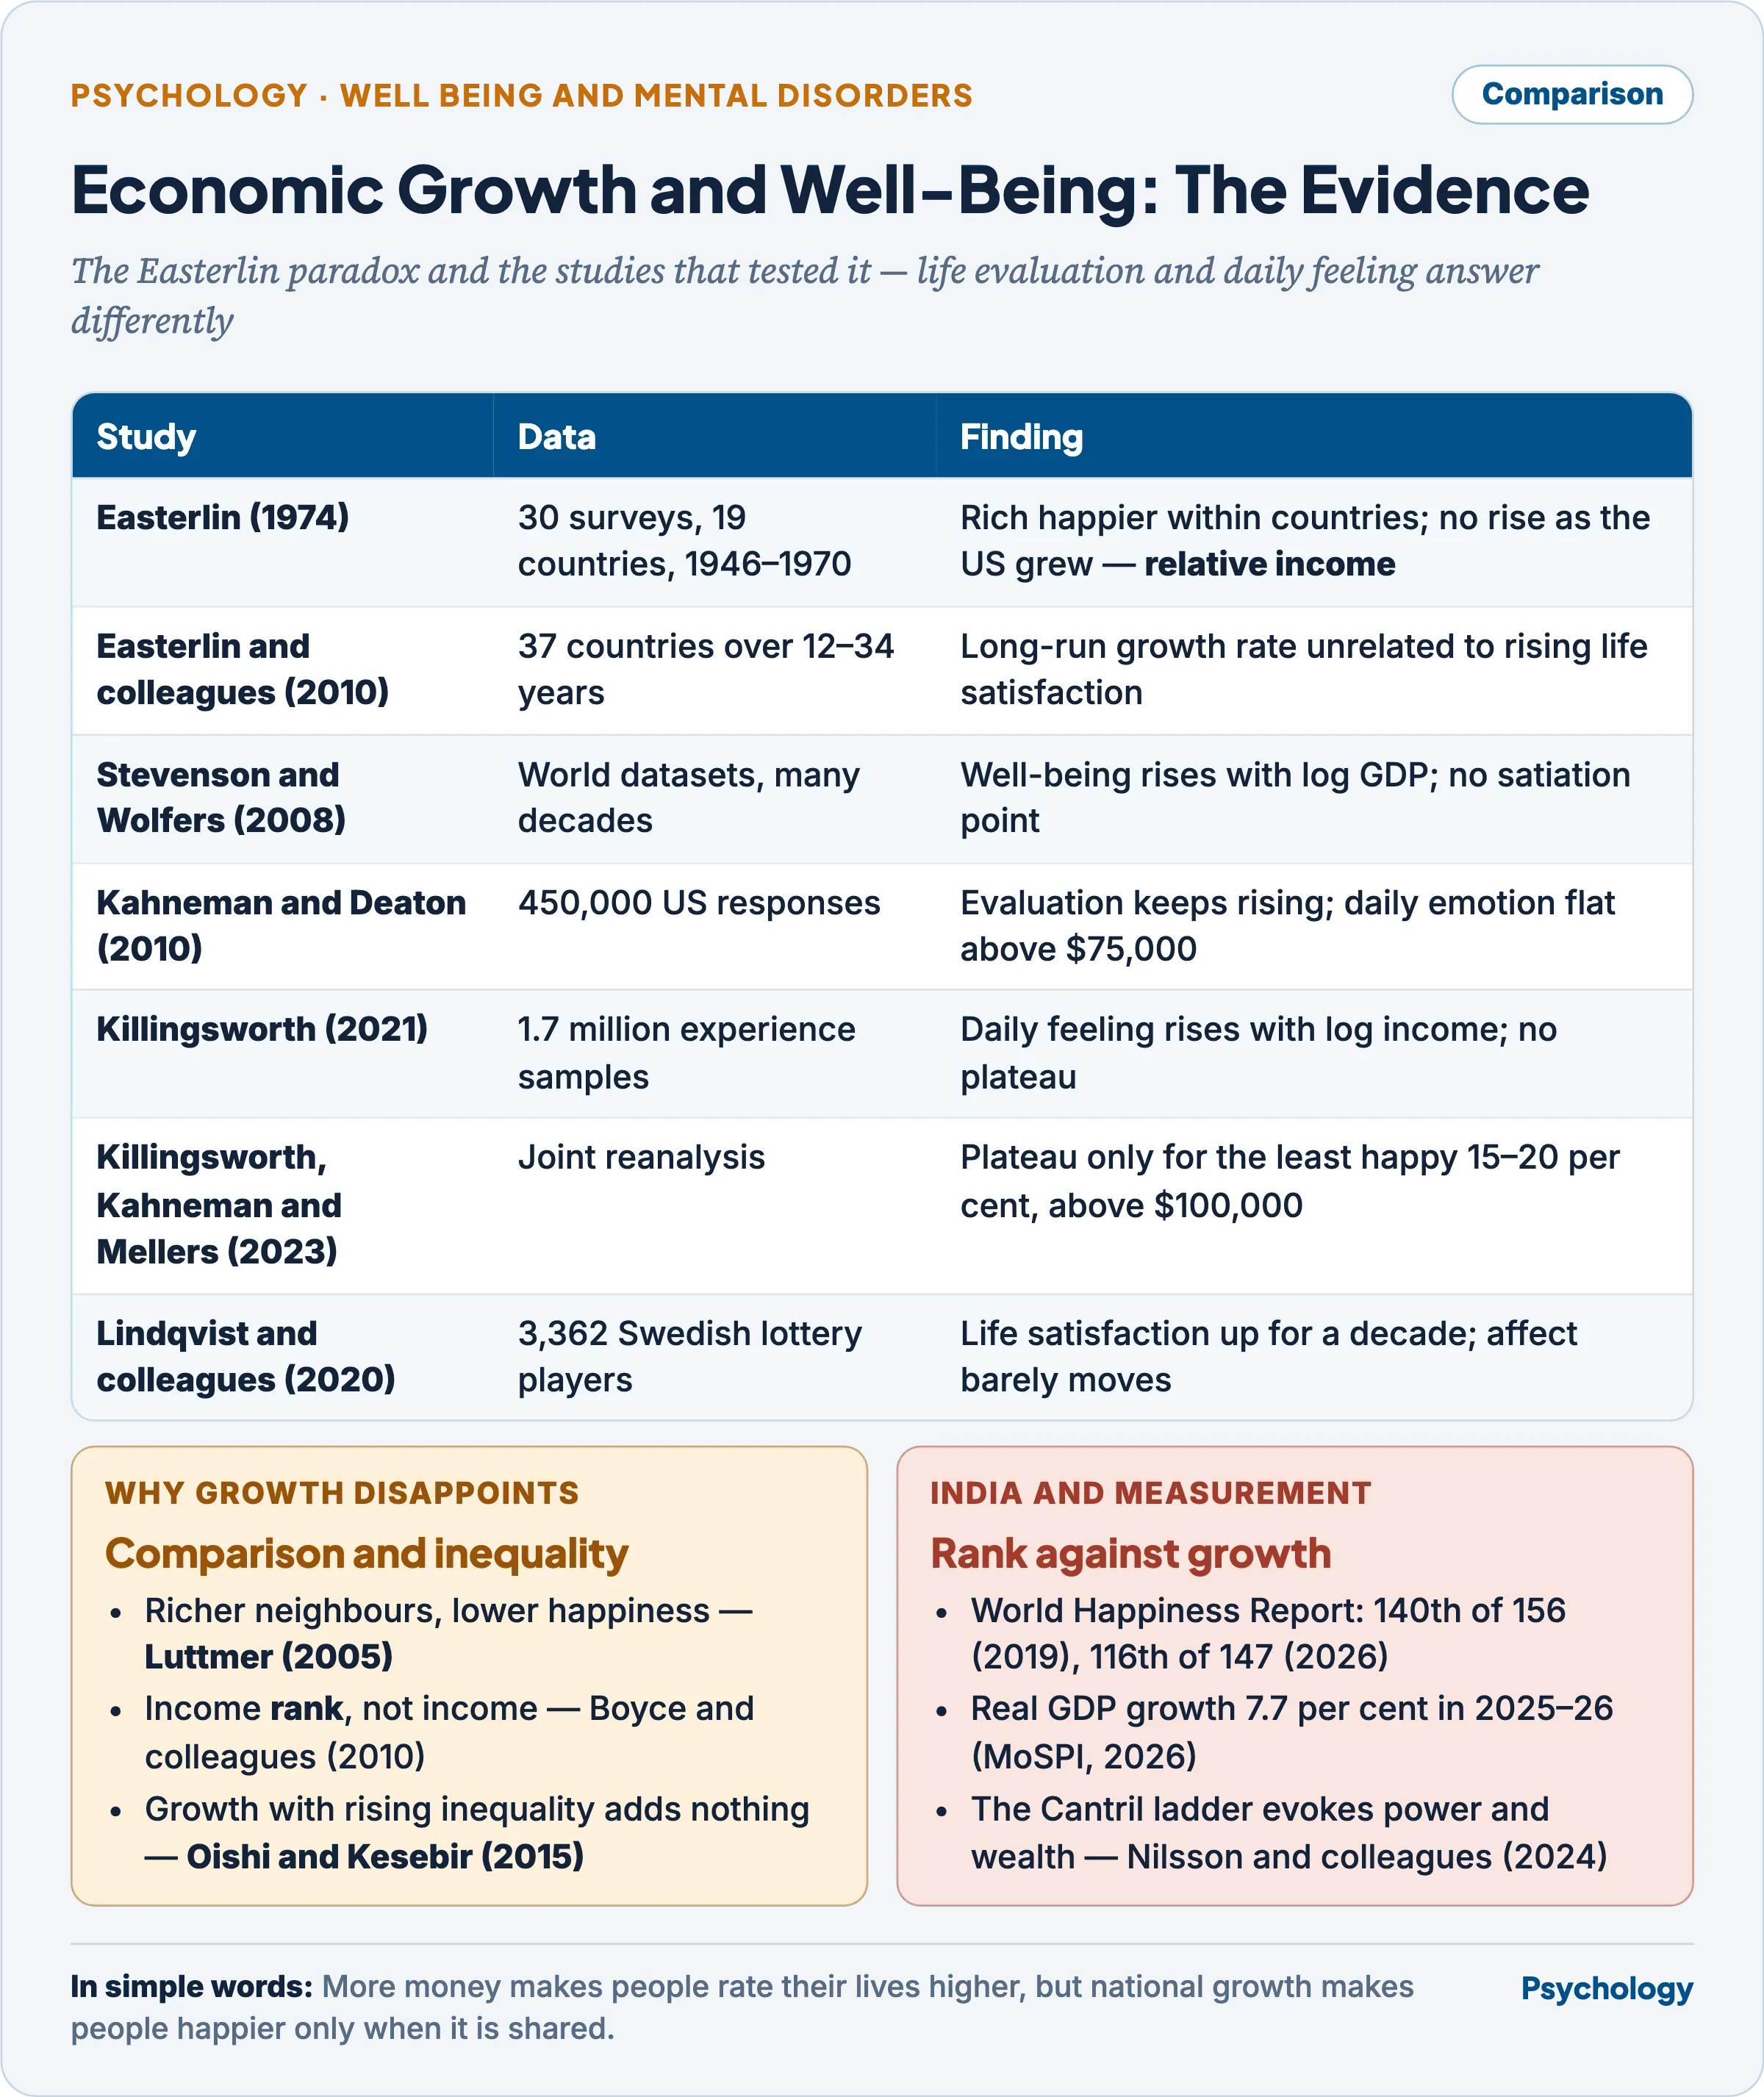
Income lifts how people rate their lives more surely than how they feel day to day, and growth lifts nations only when it is shared.
Relative income and inequality
- Luttmer (2005): holding own income constant, higher earnings among one’s neighbours predicted lower happiness.
- Boyce, Brown and Moore (2010): the rank of income within a comparison group predicted life satisfaction, while absolute income did not; upward comparisons weighed more than downward.
- Oishi and Kesebir (2015), across 34 countries: growth was not associated with rising happiness when income inequality grew with it — the paradox appears where growth is unequal.
Evaluation
- Income raises life evaluation at every level on a log scale; its effect on daily affect is smaller and, for the unhappy, bounded.
- National growth raises happiness when broad-based and joined by health, social support and freedom — three of the World Happiness Report’s six explanatory variables.
- The paradox therefore survives as a claim about unshared and positional growth rather than about income as such — the ground for Diener’s (2000) proposal of a national index of well-being alongside GDP.
Criticisms and limitations
- Measurement — Nilsson and colleagues (2024) asked 1,581 British adults to interpret the Cantril ladder: 17.3 per cent of words describing its top concerned power and money, more than without the ladder imagery — so ladder rankings may overweight wealth.
- Self-report — scales are transparent and open to mood and cultural display rules; cultural meanings of happiness are in Health, Ill-Health, Positive Health and Well-Being.
- Fixity, then plasticity, overstated — the “futile” claim (Lykken and Tellegen, 1996) and the 40 per cent pie (Brown and Rohrer, 2020) both outran their data.
- Small samples and replication — the classic lottery study had 22 winners; prosocial-spending effects shrank under registered replication (Aknin and colleagues, 2020).
- Ideology — Cabanas and Illouz (2019) argue that the happiness industry turns structural problems such as inequality into individual responsibility.
Indian context
- World Happiness Report (Gallup ladder ratings, about 1,000 respondents per country a year; editions 2019–2026) — India ranked 140th of 156 in 2019, 136th of 146 in 2022 and 116th of 147 in 2026.
- Its fall of more than 1.1 points between 2005–08 and 2016–18 was among the world’s five largest, and the six factors, GDP among them, failed to predict it (Helliwell, Huang and Wang, 2019).
- The mean has since recovered, from 3.777 (2022) to 4.536 (2026), as real GDP grew 7.1 and 7.7 per cent in 2024–25 and 2025–26 (Ministry of Statistics and Programme Implementation, June 2026): long-run divergence, short-run co-movement.
- Biswas-Diener and Diener (2001) interviewed 83 poor residents of Kolkata — slum dwellers, sex workers, pavement dwellers — living on about US$60 a month. Global life satisfaction was slightly negative but every domain rating positive; slum dwellers, in settled communities, were most satisfied.
- Carlsson, Gupta and Johansson-Stenman (2009), by choice experiment with Indian students, found slightly more than half the marginal utility of income to be relative; low-caste and low-income respondents cared most, and a rise in their own caste’s mean income lowered utility.
- Pande and Naidu (1992) built a scale of anāsakti (non-attachment) from the Gītā’s sthitaprajña. Among 465 participants, those high on it felt less distress for the same number of life events and showed fewer strain symptoms; anāsakti predicted strain better than stress scores.
- Singh and Raina (2015) built a newer 22-item test of six factors — outcome vulnerability, faith in God, empathy, frustration tolerance, effort orientation and emotional equipoise — correlating .23–.38 with flourishing.
- Santoṣa — Yoga Sūtra II.42: santoṣād anuttamaḥ sukhalābhaḥ, “from contentment, unsurpassed happiness is attained”. The prescription lowers the aspiration level rather than raising income — the Indian answer to the treadmill and to Easterlin’s rising norm.
- Rajya Anand Sansthan (Government of Madhya Pradesh; Anand Vibhag constituted 6 August 2016) — India’s first state happiness department, merged into a spirituality department in 2018–19 and separated again in January 2022.
- Mechanism: Alpvirām reflection workshops for public servants, Ānandam points where unwanted goods are left for anyone to take, Ānand Utsav games each 14–28 January, trained Ānandak volunteers.
- Principle: intentional activity and prosocial giving over circumstance. The state happiness index promised in 2016 was still unpublished in March 2026, so its effects are unmeasured.
- The Delhi Happiness Curriculum (2018) applies the same activity logic in schools; see Factors Influencing Positive Health, Well-Being, Lifestyle and Quality of Life.
Previous Year Questions
- 2015Critically evaluate the relationship between economic growth and human well-being in the light of contemporary research on happiness.
- 2014Discuss how happiness may influence psychological well-being and health.