

- Climate is one of the most powerful factors deciding where plants and animals can live. As the global climate changes, the map of life is being redrawn in real time.
- Rising temperatures, altered rainfall and other climatic stresses are shifting species ranges on a global scale, with deep effects on biodiversity, ecosystems and human well-being.
- These shifts test both the resilience of ecosystems and conservation built around static protected-area boundaries.
Climate Change as a Distribution Driver

Why it matters for distribution theory
- Classical biogeography treats climate (temperature, precipitation, light) as a largely stable factor governing a species’ range.
- Human-driven climate change removes that stability: ranges are no longer fixed reference points but moving targets. This is the central idea of the biogeography of climate change.
- Conservation must therefore adapt to moving distributions by maintaining ecological connectivity, protecting climate refugia and building ecosystem resilience.
- Observed shifts span every major biome, terrestrial to marine, and every major group: plants, animals and micro-organisms.
- IPCC AR6 Working Group II (2022): about half of the species assessed have shifted polewards or to higher elevations, and seasonal timing has shifted widely.
- Climate change alters distribution through five principal mechanisms:
- range shifts;
- changes in habitat availability and quality;
- range contraction and extinction;
- phenological mismatch;
- disruption of ecosystem services.
Latitudinal and altitudinal shifts
- The best-documented impact is the movement of species towards the poles (latitudinal shift) and to higher elevations (altitudinal shift) in search of cooler conditions. It is seen on land and at sea alike.
- Camille Parmesan and Gary Yohe (2003), in a meta-analysis of about 1,700 species, found average shifts of 6.1 km per decade poleward (or 6.1 m per decade upslope), and spring events advancing 2.3 days per decade.
- A later meta-analysis (I-Ching Chen and colleagues, 2011) found faster median shifts: 16.9 km per decade poleward and 11.0 m per decade upslope.
- Butterflies: of 35 non-migratory European species, 63% shifted their ranges north by 35–240 km during the 20th century (Camille Parmesan and colleagues, 1999).
- Marine fish: in the North Sea, nearly two-thirds of species shifted in mean latitude or depth over 25 years of warming. Of the species whose range edges lie in the North Sea, half moved those edges, all but one northward (Allison Perry and colleagues, 2005).
- The shifts are not uniform: range shifts vary widely between species. Species with narrow niches or specialised habitat needs are the most vulnerable, because they may find no suitable conditions in any newly available area.
Distribution-level Impacts
Bioclimatic envelopes and species distribution models
- A species’ niche is the set of conditions it can live in.
- Joseph Grinnell (1917) saw it as a species’ habitat requirements.
- G. Evelyn Hutchinson (1957) defined it as an n-dimensional hypervolume of environmental conditions. He distinguished the fundamental niche (what physiology allows) from the realised niche (what competitors, predators and dispersal leave).
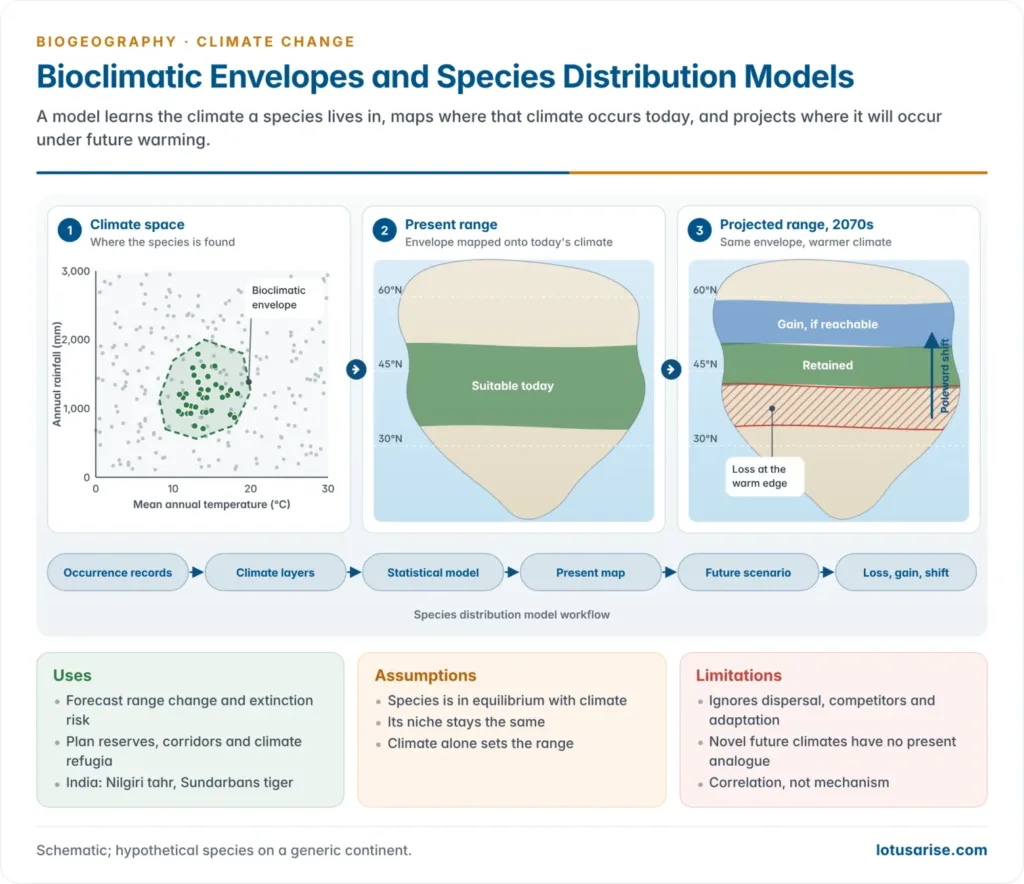
- The bioclimatic envelope is the climatic part of the realised niche: the range of temperature and rainfall across the places where a species now occurs.
- A species distribution model (SDM), or ecological niche model, turns this idea into maps:
- occurrence records from surveys, museums, herbaria and citizen science;
- climate layers for the same places (mean temperature, rainfall, seasonality);
- a statistical model linking the two, such as MaxEnt (Steven Phillips and colleagues, 2006), regression or machine learning;
- a map of present suitability, then a projection onto future climates under IPCC emission scenarios;
- a comparison showing range loss, range gain and range shift.
- Uses:
- forecasting range change and extinction risk: Chris Thomas and colleagues (2004) projected that 15–37% of species in sample regions covering a fifth of Earth’s land would be “committed to extinction” by 2050 under mid-range warming;
- choosing reserves, corridors and climate refugia;
- predicting the spread of invasive species, pests and disease vectors.
- Indian applications:
- Nilgiri tahr: a 2018 niche model projected a loss of up to about 61% of suitable habitat by the 2030s under extreme warming, in an already fragmented range.
- Bengal tiger: a 2019 MaxEnt study projected that climate change and sea-level rise would leave no suitable tiger habitat in the Bangladesh Sundarbans by 2070.
- Limitations:
- SDMs assume a species is in equilibrium with climate and that its niche will not evolve;
- they usually ignore dispersal limits, biotic interactions and adaptation;
- they must extrapolate into novel climates with no present analogue;
- they show correlation, not mechanism, so results vary with the algorithm and scenario.
- Richard Pearson and Terence Dawson (2003) argued that envelope models are useful as a first approximation only. Mechanistic models, built from physiology and population processes, and hybrid models add realism.
Changes in habitat availability and quality
- Climate change also alters the availability and quality of habitats, reshaping distributions independently of any direct thermal limit.
- Changing rainfall lets deserts spread into once-fertile areas.
- Forests may contract, or shift to higher latitudes and altitudes, as their climatic envelope moves.
| Region or system | Projected or observed change |
|---|---|
| Amazon rainforest | A bioclimatic-envelope model of 69 Amazonian flowering-plant species found 43% becoming non-viable by 2095 as rainfall and temperature changed; species with narrow ranges responded most |
| North American temperate forest | Tree ranges are projected to shift northward; the sugar maple may disappear from the southern part of its present range |
| Sundarbans mangroves (India and Bangladesh) | Sea-level rise and rising salinity squeeze freshwater-loving species and the tiger’s prey base |
- The two classic cases show a key distinction:
- in the Amazon, the driver is a change in precipitation regime (drying);
- in North America, it is a change in the thermal envelope, pushing a species’ suitable range poleward.
- Both mechanisms operate together across most of the world’s biomes.
- Habitat quality can decline without any visible loss of area: droughts, fires, pest outbreaks and marine heatwaves degrade forests and reefs from within.
Range contractions and local extinctions
- Not all species can shift their ranges. Species with limited dispersal, those confined to isolated habitats and those with specialised requirements are most at risk. For them, climate change brings range contraction and, in some cases, local or global extinction.
- Contraction starts at the warm edge, the lower latitudes and elevations of a range. A 2016 review found such climate-related local extinctions in 47% of 976 species studied, more often in tropical than temperate species.
| Species | Mechanism of decline |
|---|---|
| American pika (Ochotona princeps), a small mammal of the mountains of western North America | Very sensitive to heat; retreats to higher elevations as the climate warms, but suitable habitat is limited, so populations have died out, especially at lower, hotter sites |
| Golden toad (Incilius periglenes), Monteverde cloud forest, Costa Rica | Last seen in 1989 and declared extinct in 2004, probably from drought linked to a strong El Niño, warming and drying of its cloud forest, and chytrid fungal disease |
| Bramble Cay melomys (Melomys rubicola), a rodent of a 4–5 ha coral cay in the Torres Strait, Australia | Repeated storm-surge flooding as sea level rose destroyed its vegetation; last seen in 2009 and declared extinct by Australia in February 2019, the first mammal extinction attributed to human-caused climate change |
The escalator to extinction
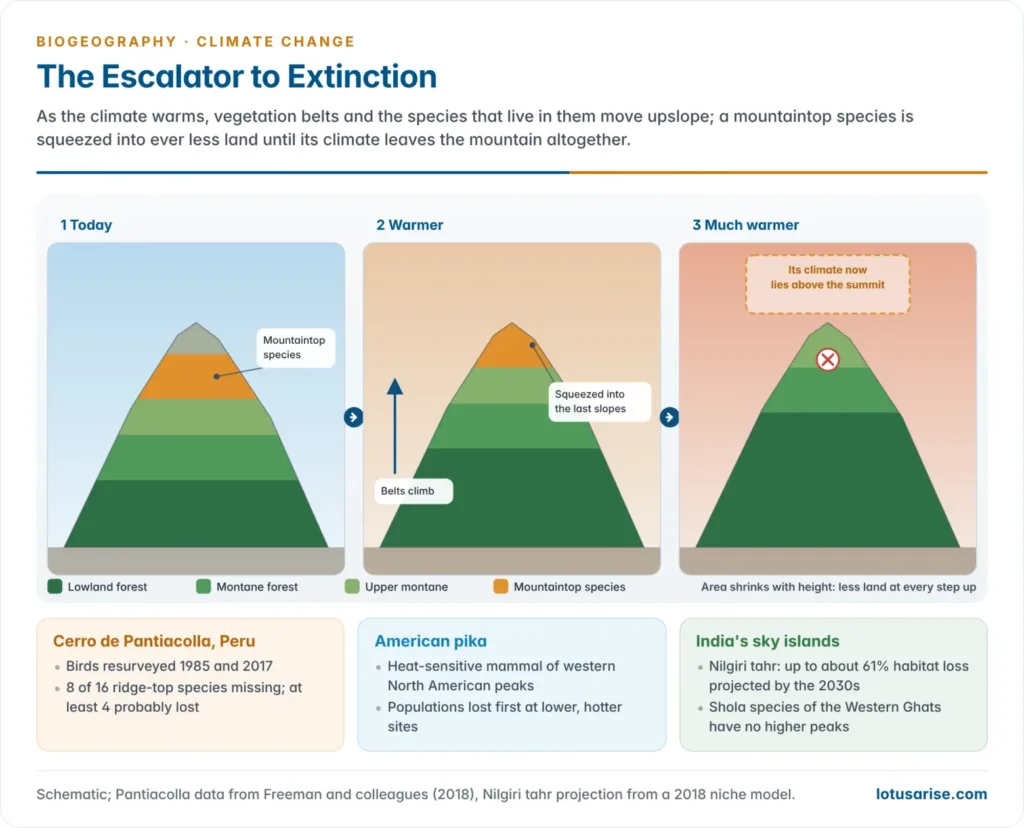
- The pika illustrates the “escalator to extinction”: a mountain species retreating upslope eventually runs out of mountain, since there is no habitat above the summit. Mark Urban (2018) used the term for a tropical bird study.
- On Cerro de Pantiacolla in south-eastern Peru, a 1,415 m ridge, most bird species had moved upslope between 1985 and 2017. Eight of the 16 ridge-top species found in 1985 were missing, and at least four were probably lost from the ridge (Benjamin Freeman and colleagues, 2018).
- Why mountains trap species:
- land area shrinks with height, so each upward step offers less habitat;
- mountaintop species are often endemics with tiny ranges;
- neighbouring peaks are isolated “sky islands”, too far apart to reach.
- Indian cases: the Nilgiri tahr and the shola birds and plants of the Western Ghats sky islands have no higher ground to climb. Alpine plants of the Himalaya face the same squeeze as treelines rise behind them.
- Mountain endemics and island species, with nowhere left to go, are therefore the most climate-vulnerable groups in conservation biogeography.
- Global extinction risk rises steeply with warming:
- IPCC AR6 (2022): 3–14% of land species assessed face a very high risk of extinction at 1.5 °C, 3–18% at 2 °C and 3–29% at 3 °C;
- Mark Urban (2024), synthesising more than 450 studies, estimated that about 1 in 50 species is at risk at 1.5 °C, about 1 in 20 at 2.7 °C, and nearly a third at 5.4 °C. Amphibians and species of mountains, islands and fresh water are most at risk.
Consequences for Ecosystems and Conservation
Phenological mismatches and disrupted interactions
- Phenology is the timing of recurring biological events: flowering, leaf-out, breeding and migration. As temperatures rise, many species shift this timing.
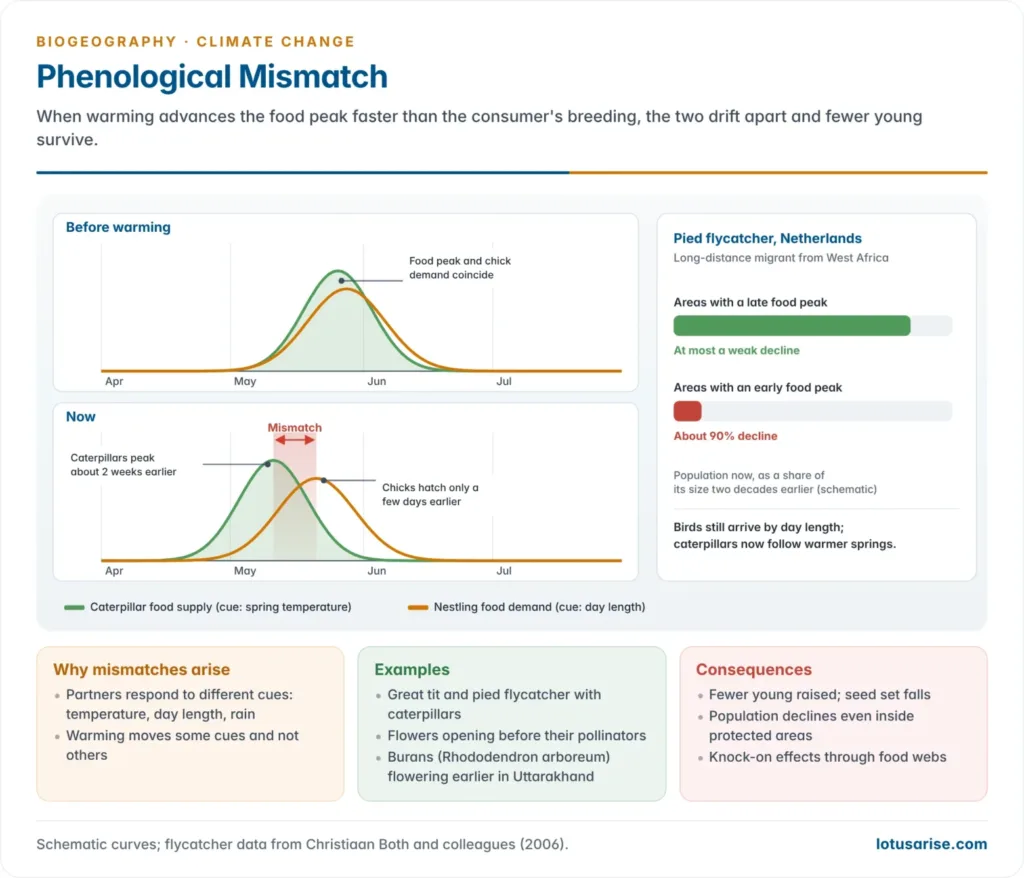
- Interdependent species rarely shift at the same rate, because they respond to different cues (temperature, day length, rainfall). The result is a phenological mismatch: partners in a relationship fall out of step.
- Illustrative mismatches:
- Great tit (Parus major), Europe: birds now breed earlier as springs warm, but the caterpillar peak that feeds their nestlings has advanced faster. The mismatch cuts breeding success (Marcel Visser and Christiaan Both, 2005).
- Pied flycatcher (Ficedula hypoleuca), Netherlands: this long-distance migrant times its return from Africa by day length. Where caterpillars now peak early, populations fell by about 90% over two decades (Christiaan Both and colleagues, 2006).
- Plants and pollinators: flowers that open before their pollinators emerge set less seed. Herbarium-based studies in Uttarakhand record earlier flowering of the burans (Rhododendron arboreum).
- Coral bleaching: rising sea temperatures make corals expel the symbiotic algae (zooxanthellae) in their tissues. The whole reef ecosystem suffers, and with it every species that depends on the reef for habitat and food (Ove Hoegh-Guldberg and colleagues, 2007).
- Bleaching is strictly the breakdown of a mutualism rather than a timing mismatch. It belongs here because, like the bird examples, climate change severs a finely tuned relationship instead of acting on one species alone.
- India’s coral reefs in Lakshadweep and the Gulf of Mannar bleached severely in 2024.
Implications for biodiversity and ecosystem services
- As species move or decline, community composition changes. Ecosystem processes, and the services they provide to people, change with it.
| Mechanism | Consequence |
|---|---|
| Shrubs spreading into the warming Arctic tundra | Changes carbon and nitrogen cycling and darkens the surface, with feedbacks to the global climate |
| Loss of the sea urchin’s predators: sea otters (past fur hunting, killer-whale predation) and sunflower sea stars (wasting disease during the 2013–16 marine heatwave) | Urchins overgraze kelp forests into barrens; in northern California, bull kelp canopy fell by more than 90% along 350 km of coast after 2014 |
| Mass coral bleaching | Loss of reef fisheries, coastal protection and tourism |
- Shifts in plant distributions affect carbon sequestration, water regulation and soil stability, three services that matter for human welfare and for national climate commitments.
- The sea-otter example shows the role of a keystone species: an organism whose influence is far larger than its abundance, so its loss triggers a cascade that reorganises the whole ecosystem.
- People feel these shifts directly: fish stocks move across national fishing zones, crop pests and disease vectors such as mosquitoes spread to higher latitudes and altitudes, and pollination services weaken.
Conservation challenges and adaptive strategies
- Shifting distributions undermine traditional conservation. Protected areas were drawn around historical distributions, so the species a reserve was designed to protect may move out of its boundaries.
- Conservationists are therefore turning to adaptive strategies that allow for moving ranges:
- ecological corridors: strips of connecting habitat that let species move across fragmented landscapes;
- climate refugia: protecting places expected to stay relatively stable as the climate changes, where vulnerable species can persist;
- assisted migration: deliberately moving species to suitable habitat outside their present range. It remains controversial and must be carefully managed, since a relocated species may become invasive in its new home.
- Together these mark a shift in conservation philosophy, from protecting a fixed place to protecting a functioning process of species movement and ecosystem adaptation. This reframing is now central to how biogeographers and planners design reserves under climate change.
Previous Year Questions
- No direct PYQ has been asked on this sub-topic yet.




