

Major steps in Psychological research (sampling, tools of data collection, analysis and interpretation); Methods of data collection (interview, observation, questionnaire).
Official Syllabus: Paper I · Unit 3 Research Methods
“Measurement is the assignment of numerals to objects or events according to rules.”
— Stevens (1946)
Stevens’s definition is deliberately permissive: what matters is that a rule exists and that it is stated. Three questions follow from it and organise everything below — whom the numbers were taken from, whether the rule actually captures the construct it names, and by what instrument the rule was applied. Sampling answers the first, measurement quality the second, and the tools of data collection the third.
Sampling
A population is the entire set of units about which a conclusion is wanted. A sample is the subset actually studied. The inference from one to the other is legitimate only when the selection mechanism is known, which is the whole basis of the distinction below.
Probability sampling
In probability sampling every unit in the population has a known, non-zero chance of selection. This is what makes the sample statistic an estimate of the population parameter, and what makes the standard error calculable — so it is the precondition for any significance test, confidence interval or generalisation.
- Simple random sampling — every unit has an equal chance and every combination of units is equally likely, drawn by lottery or random numbers. It is unbiased and requires a complete sampling frame, which for a psychological population is often unobtainable.
- Systematic sampling — every k*th unit from an ordered list after a random start, where *k is the population size divided by the sample size. Easy to execute in the field and biased if the list has a periodicity that matches k.
- Stratified random sampling — the population is divided into strata that are homogeneous on a variable relevant to the outcome (sex, age band, rural and urban, socioeconomic group), and a random sample is drawn within each. The gain is precision: variance within strata is removed from the sampling error, so a stratified sample of a given size is more accurate than a simple random one. Proportionate allocation samples each stratum in its population proportion; disproportionate allocation over-samples small strata so that they can be analysed separately, and weights are applied when the whole is combined.
- Cluster sampling — naturally occurring groups such as schools, wards or villages are sampled, and every unit inside the chosen clusters is studied. It is the practical choice when no list of individuals exists but a list of clusters does. The cost is design effect: people within a cluster resemble each other, so a clustered sample of n carries less information than a simple random sample of n.
- Multi-stage sampling — clusters are sampled, then sub-units within them, and so on. This is how every large Indian survey is actually drawn, because no national list of individuals exists.
- Probability proportional to size — larger clusters are given a correspondingly larger chance of selection, so that every individual ends with the same overall probability despite unequal cluster sizes.
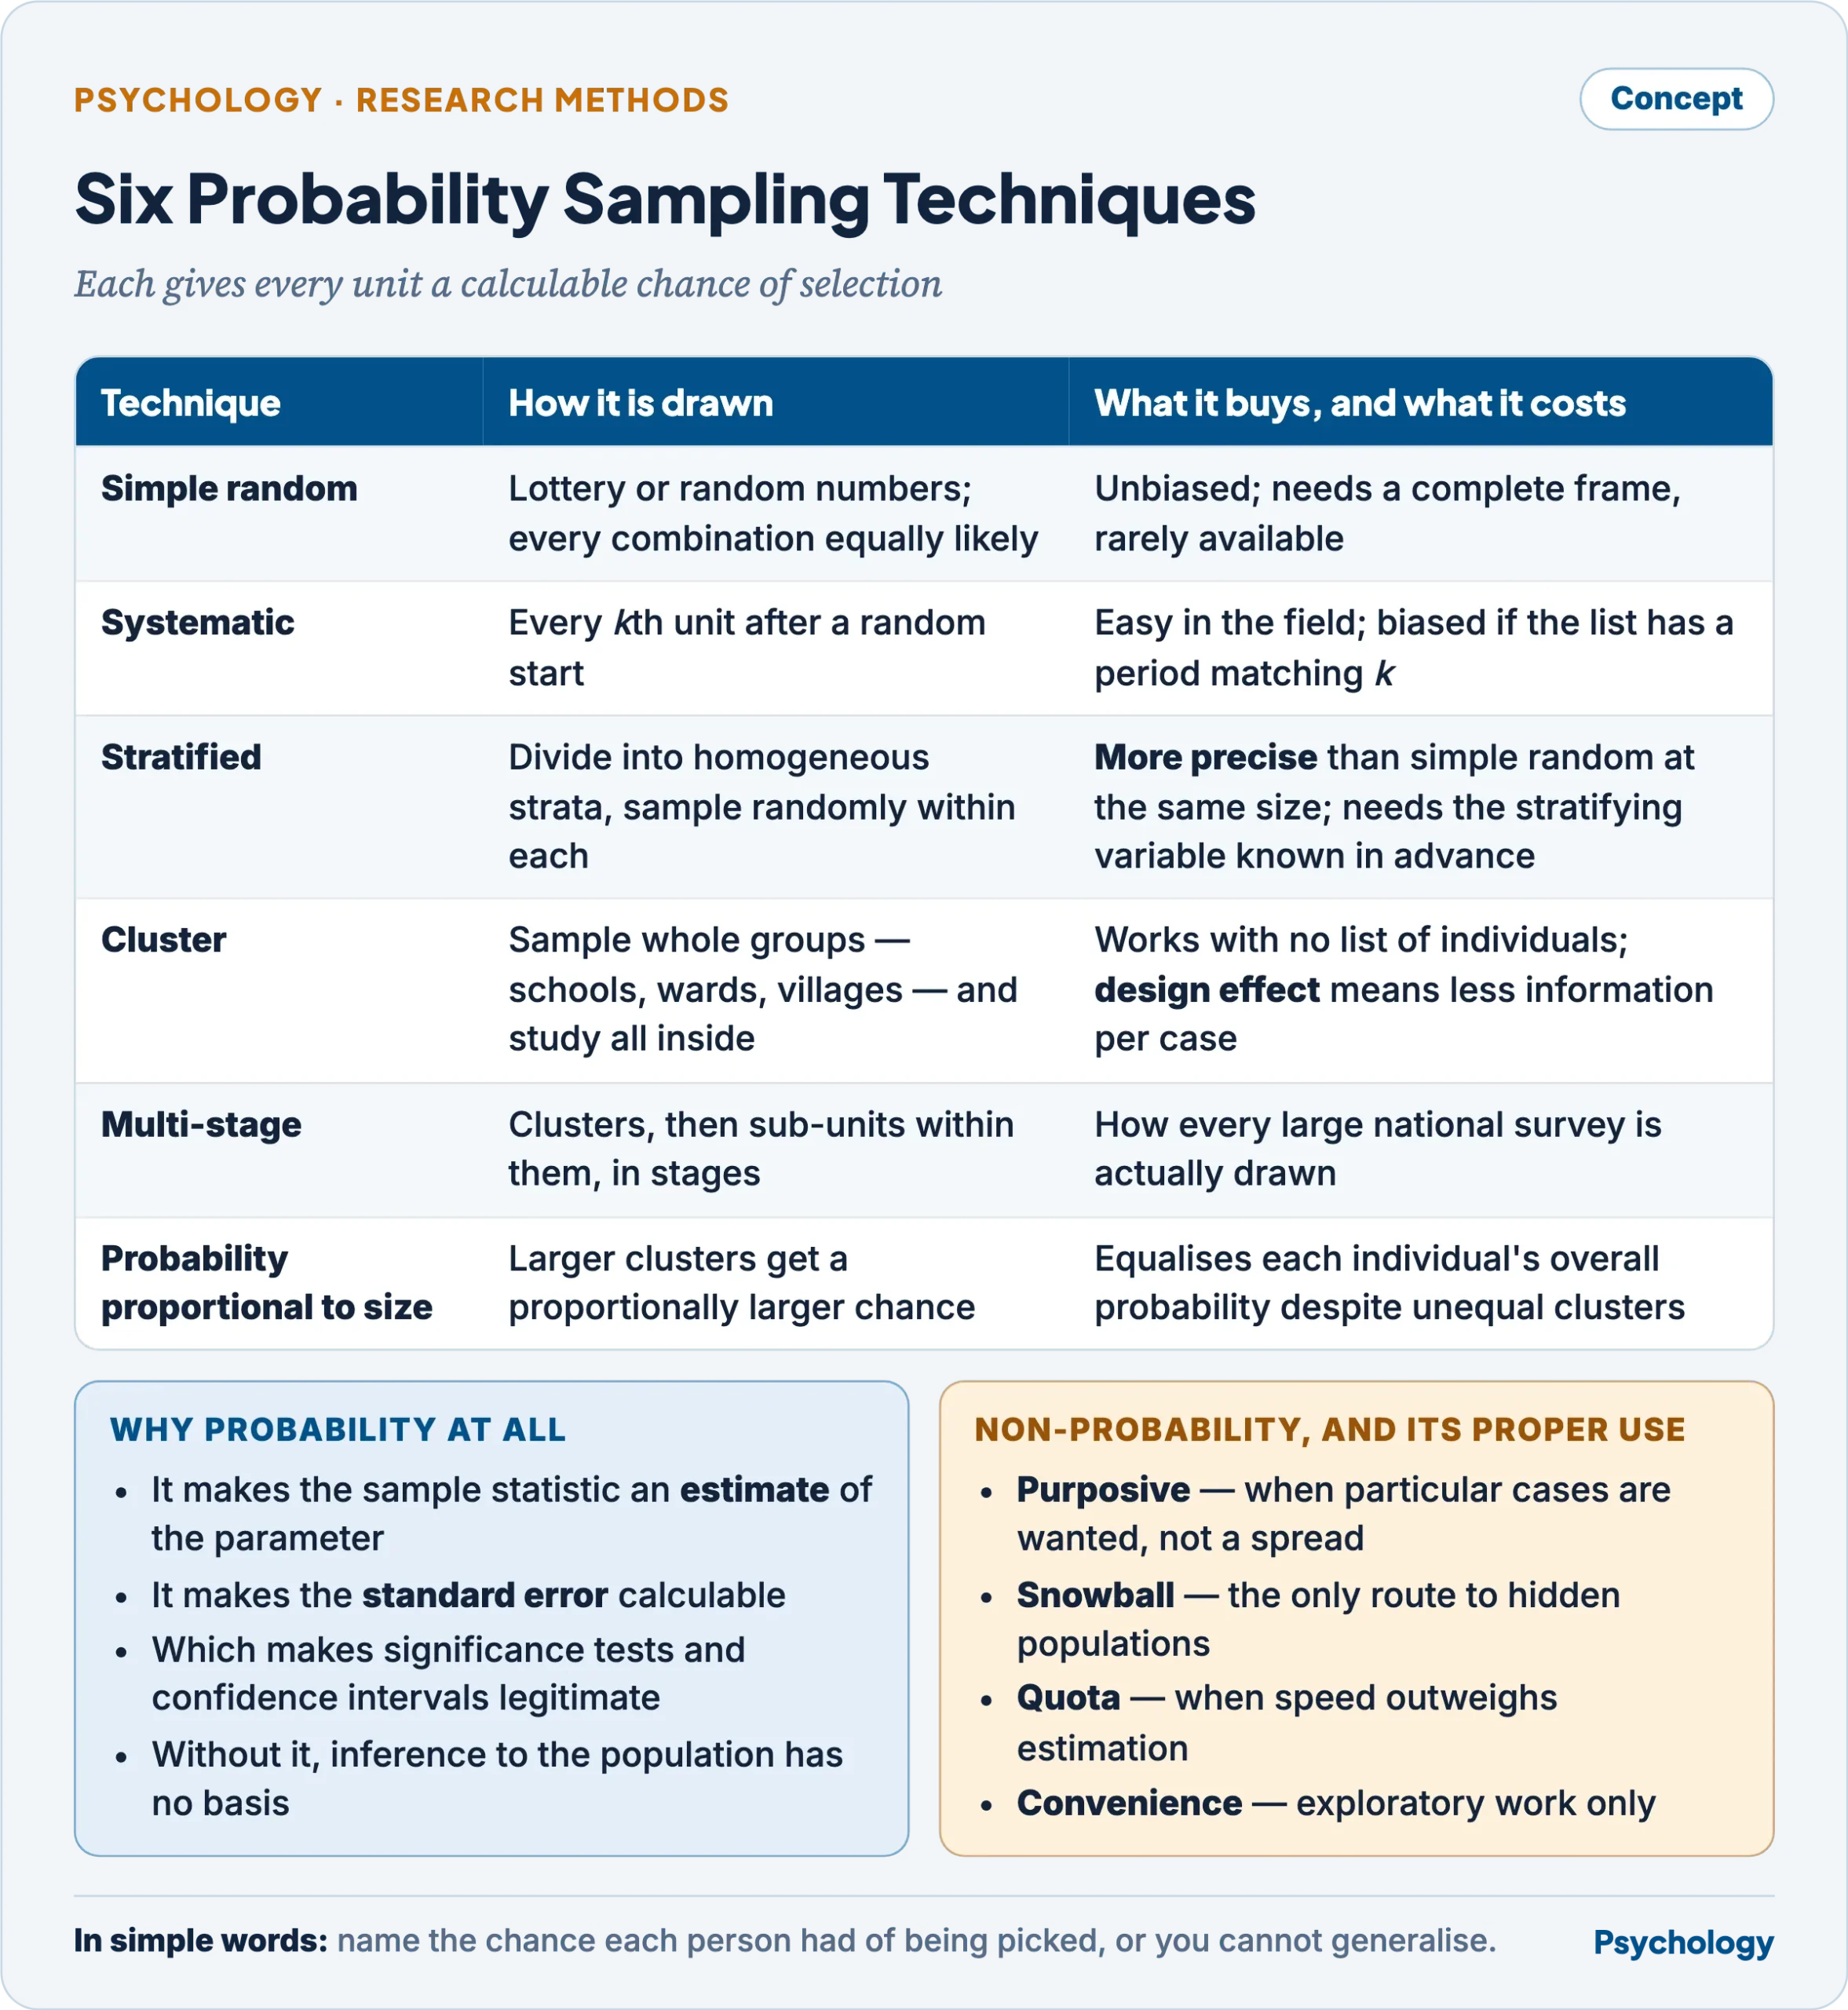
Each gives every unit a calculable chance of selection.
Non-probability sampling
Convenience, purposive, quota and snowball sampling select by availability, judgement, fixed category totals or referral. None gives a calculable selection probability, so none supports estimation — though each has a proper use: purposive where particular cases are wanted rather than a spread, snowball as the only practical route to hidden populations such as drug users or undocumented migrants.
Sampling error and error in sampling
These are routinely confused and the distinction decides what to do about them.
- Sampling error is the discrepancy between a sample statistic and the population parameter arising from chance alone — the fact that this particular set of units was drawn rather than another. It is unavoidable, unbiased in the long run, and quantifiable. Its measure is the standard error of the mean, the population standard deviation divided by the square root of the sample size.
- Error in sampling, or sampling bias, is a systematic distortion caused by a defective procedure: an incomplete sampling frame, self-selection, non-response, substitution of unavailable units, or an interviewer choosing whom to approach.
The practical consequence is the point of the distinction. Sampling error is reduced by increasing the sample size, by stratifying on a relevant variable, and by reducing measurement variability. Error in sampling is not reduced by sample size at all — a larger defective sample estimates the wrong quantity more precisely. It is addressed only by repairing the procedure: completing the frame, pursuing non-respondents, randomising selection, and weighting for known imbalances afterwards.
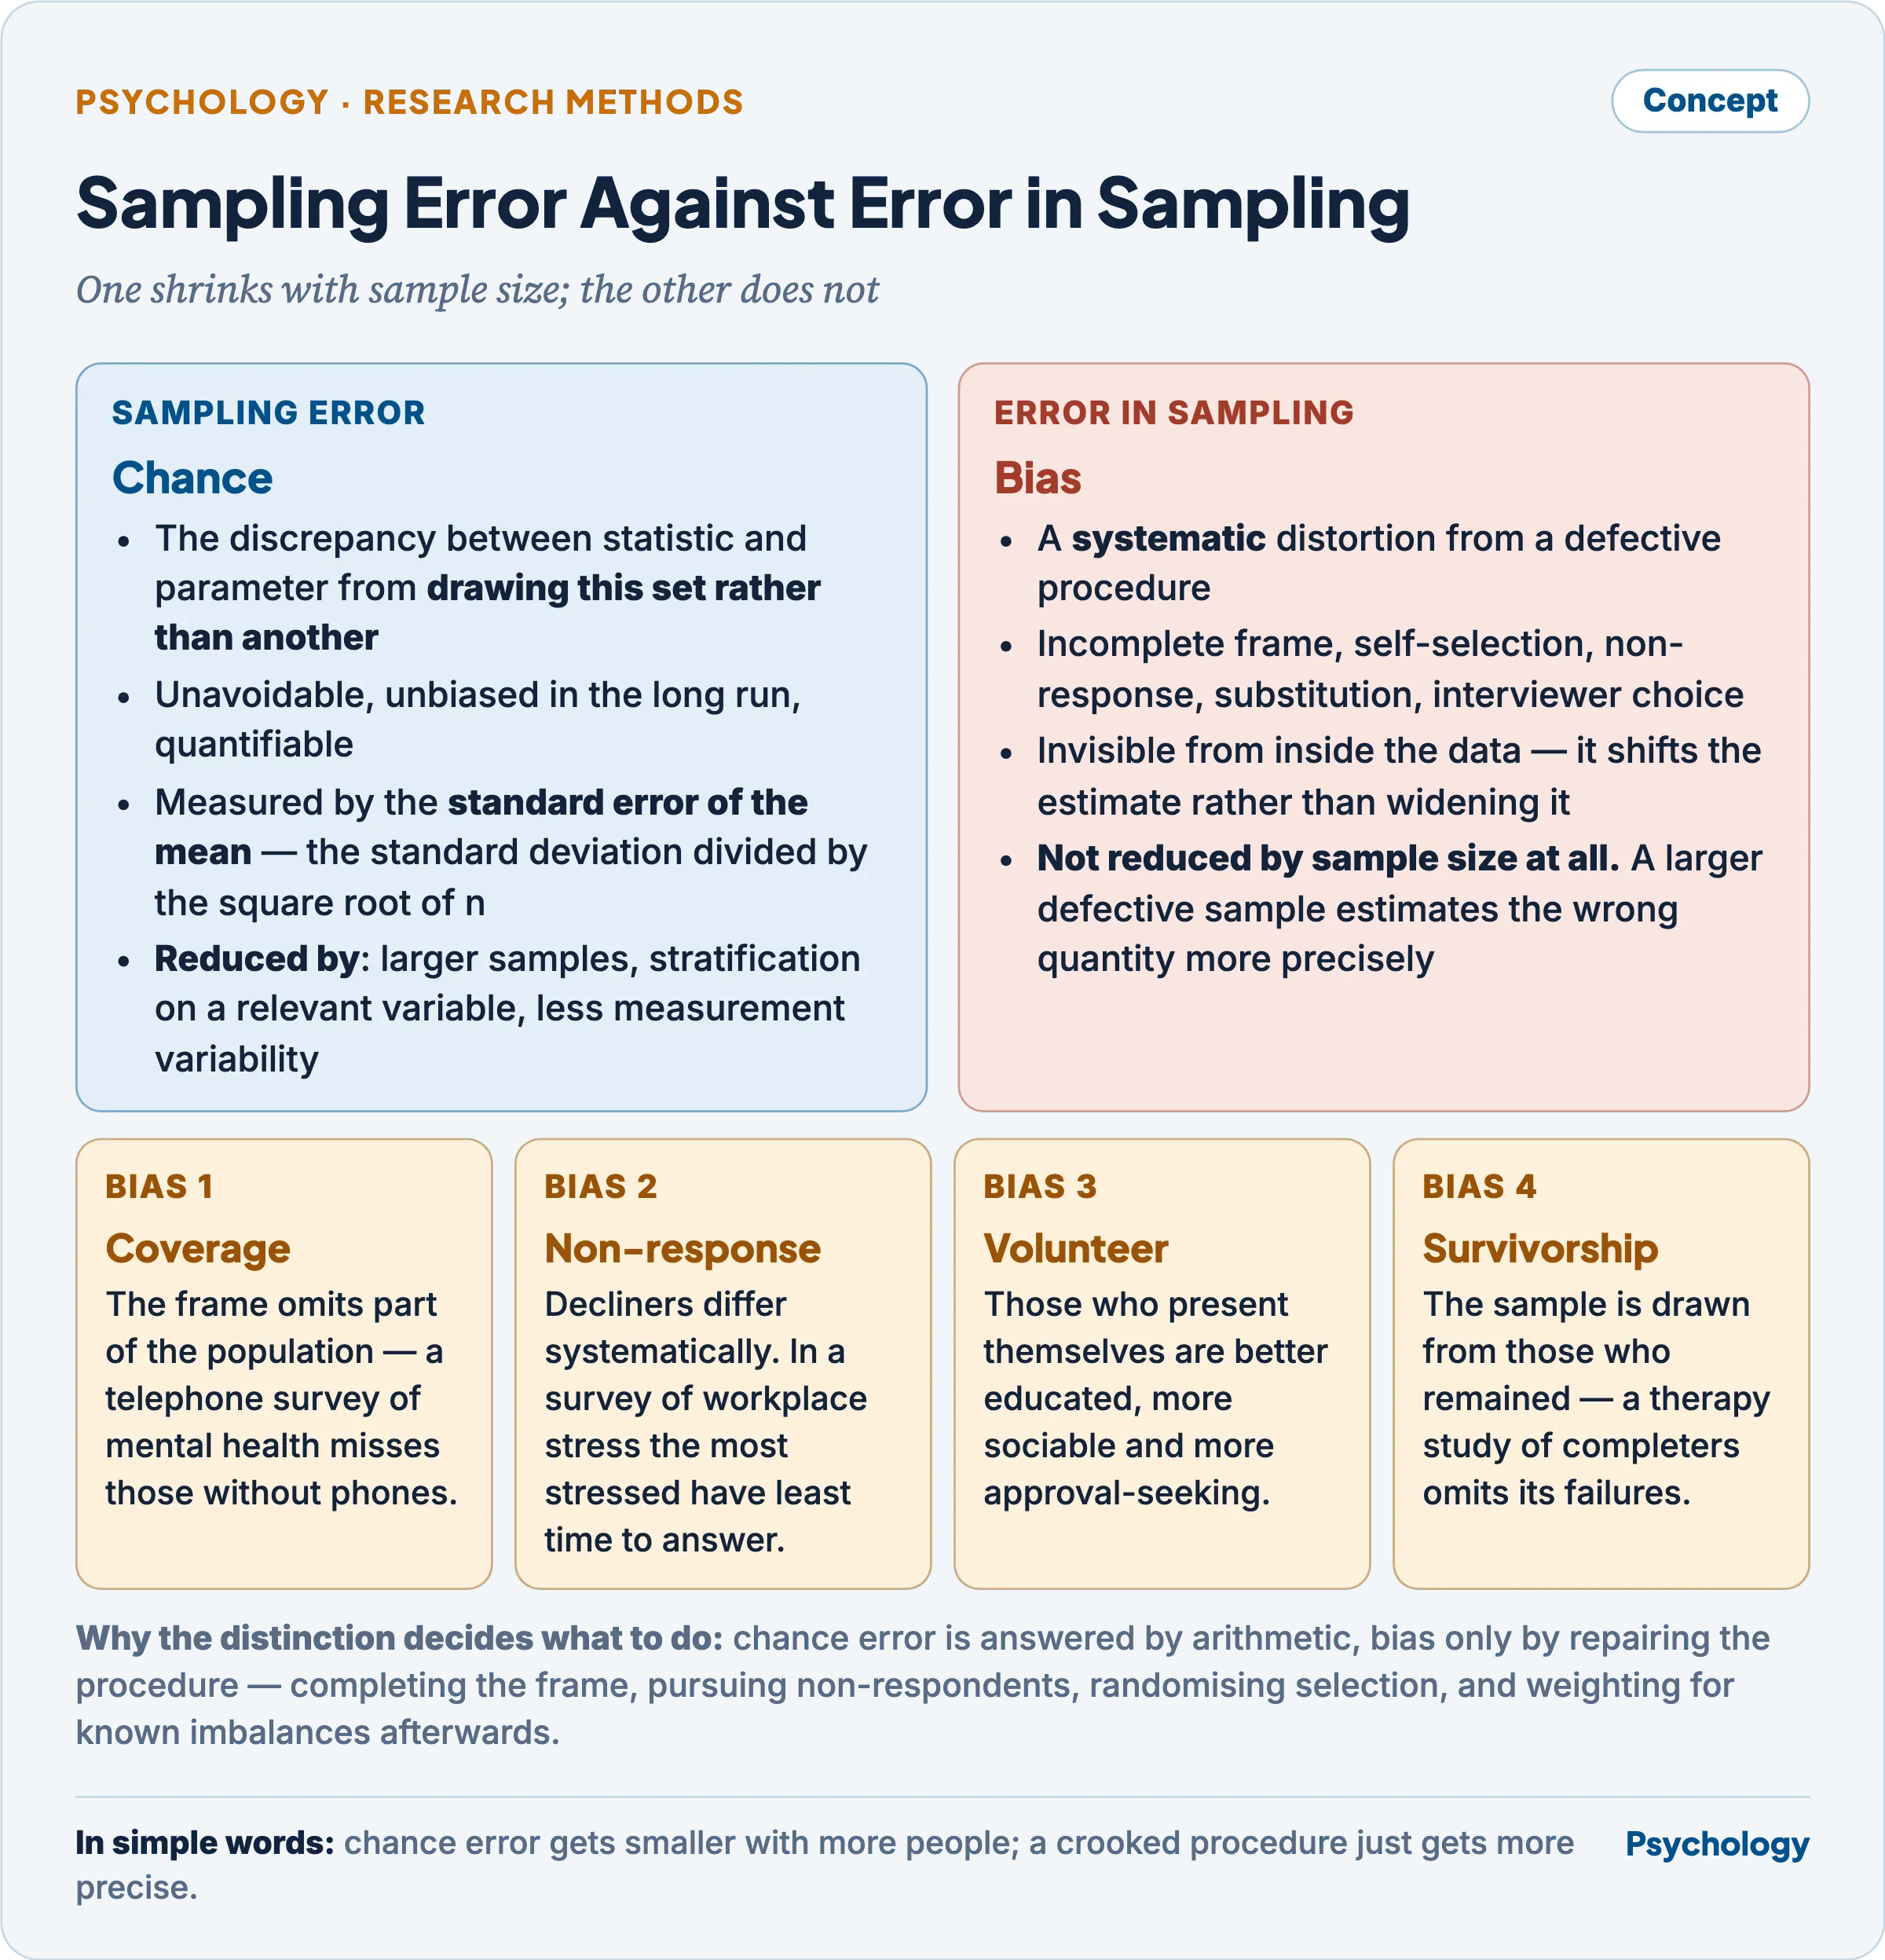
One shrinks as the sample grows; the other does not.
How sampling bias distorts a finding
- Coverage bias — the frame omits part of the population. A telephone survey of mental health misses those without phones, who differ on the very outcome.
- Non-response bias — those who decline differ systematically from those who agree. In a survey of workplace stress, the most stressed are the least likely to have time to answer.
- Volunteer bias — people who present themselves for psychological studies tend to be better educated, more sociable and more approval-seeking, which limits every undergraduate-volunteer finding.
- Survivorship bias — the sample is drawn from those who remained, so a study of a therapy’s completers omits those for whom it failed.
- The effect in each case is on external validity first, and on internal validity wherever the bias correlates with the independent variable. A biased sample does not add noise to the estimate; it shifts it in a direction the investigator cannot see from inside the data.
Psychological measurement
How it differs from measurement in the physical sciences
- The attribute is not directly observable. Length is measured against a rod; anxiety has no rod. Psychological measurement is always indirect, inferring a construct from behaviour taken as its indicator, so the inference itself has to be justified.
- There is no absolute zero and no natural unit. A score of zero on a depression inventory does not mean the absence of depression, and the interval between 20 and 30 is not demonstrably the same quantity as between 40 and 50. Most psychological measurement therefore reaches ordinal or interval status and rarely ratio, which is why ratio statements such as “twice as intelligent” are meaningless.
- Measurement is relative to a reference group. An IQ of 115 means a position in a distribution of others, not an amount of anything. Physical measurement carries no such dependence.
- Error is larger and intrinsic. The observed score is never the true score, which is why reliability must be estimated rather than assumed.
- The act of measuring changes the object. Respondents react to being tested — through social desirability, practice and anxiety — in a way that a rod does not react to being measured.
- The unit is fallible and the instrument must be re-validated for each population, since an item’s meaning varies with language and culture.
Psychophysical and psychometric measurement
Both measure psychological quantities, and they measure different things by different logic.
- Psychophysical measurement relates a physical stimulus to the sensation it produces, so one side of the equation is measured in physical units. Weber (1834) established that the just noticeable difference is a constant fraction of the standard stimulus. Fechner (1860), who named psychophysics, derived from it that sensation grows as the logarithm of stimulus intensity. Stevens (1957) replaced the logarithm with a power function whose exponent differs by modality, obtained through magnitude estimation. Its methods are the methods of limits, of constant stimuli and of adjustment, and its characteristic quantities are the absolute threshold and the difference threshold.
- Psychometric measurement relates a person to a trait for which there is no physical stimulus at all — intelligence, extraversion, attitude, aptitude. Its unit is the test item, its scale is built from a reference group’s distribution, and its quantities are reliability, validity and norms. It descends from Galton, from Cattell (1890), who coined “mental test”, and from Binet and Simon (1905).
| Psychophysical | Psychometric | |
|---|---|---|
| What is related | Physical stimulus to sensation | Person to latent trait |
| Is one side physical? | Yes — intensity in physical units | No |
| Typical participant number | Very few, many trials each | Many people, few items each |
| Characteristic quantities | Absolute and difference thresholds | Reliability, validity, norms |
| Scale origin | Anchored to the physical continuum | Anchored to a reference group |
| Individual differences | Nuisance to be averaged out | The object of study |
Requirements of a psychological assessment tool
An instrument offers an accurate and useful measure of a construct only if it satisfies all of the following; failing any one, the scores mean something other than what is claimed.
- Reliability — consistency of measurement. Spearman (1904) framed it through the model that an observed score is a true score plus an error component, so reliability is the proportion of score variance that is true variance. It is estimated in four ways, each answering a different question about consistency: test-retest across occasions, parallel forms across item sets, split-half and internal consistency across items within one administration — Cronbach’s alpha (1951) is the general case of the split-half approach — and inter-rater reliability across judges, for which Cohen’s kappa (1960) corrects for chance agreement.
- Validity — whether the test measures what it claims to measure, which is a property of the inference drawn from the score rather than of the test itself.
- Content validity — the items sample the defined domain adequately, judged by experts.
- Criterion validity — the score relates to an external standard, either concurrent (measured at the same time) or predictive (measured later).
- Construct validity — the score behaves as the theory of the construct requires. Campbell and Fiske (1959) supplied its operational test in the multitrait-multimethod matrix, which requires both convergent validity, agreement with other measures of the same trait by different methods, and discriminant validity, divergence from measures of different traits by the same method.
- Standardisation — fixed materials, instructions, time limits and scoring, so that a score difference reflects the person and not the administration.
- Norms — a reference distribution from a defined and adequately sampled group, against which a raw score is interpreted as a percentile, standard score or age equivalent. A test normed on one population is uninterpretable in another, which is the recurring defect of Western instruments used unadapted in India.
- Objectivity — scoring independent of the scorer’s judgement.
- Item quality — item difficulty and item discrimination established by item analysis, with items that fail to discriminate removed.
- Fairness and freedom from bias — the test does not systematically advantage a group for reasons unrelated to the construct. Differential item functioning is the technical check.
- Practicality and ethical defensibility — feasible in length and cost, administered with informed consent, and interpreted only by someone qualified to do so.
Why a measure can be reliable but not valid
Reliability concerns consistency; validity concerns what is being consistently measured. A measure can therefore be perfectly stable and perfectly wrong.
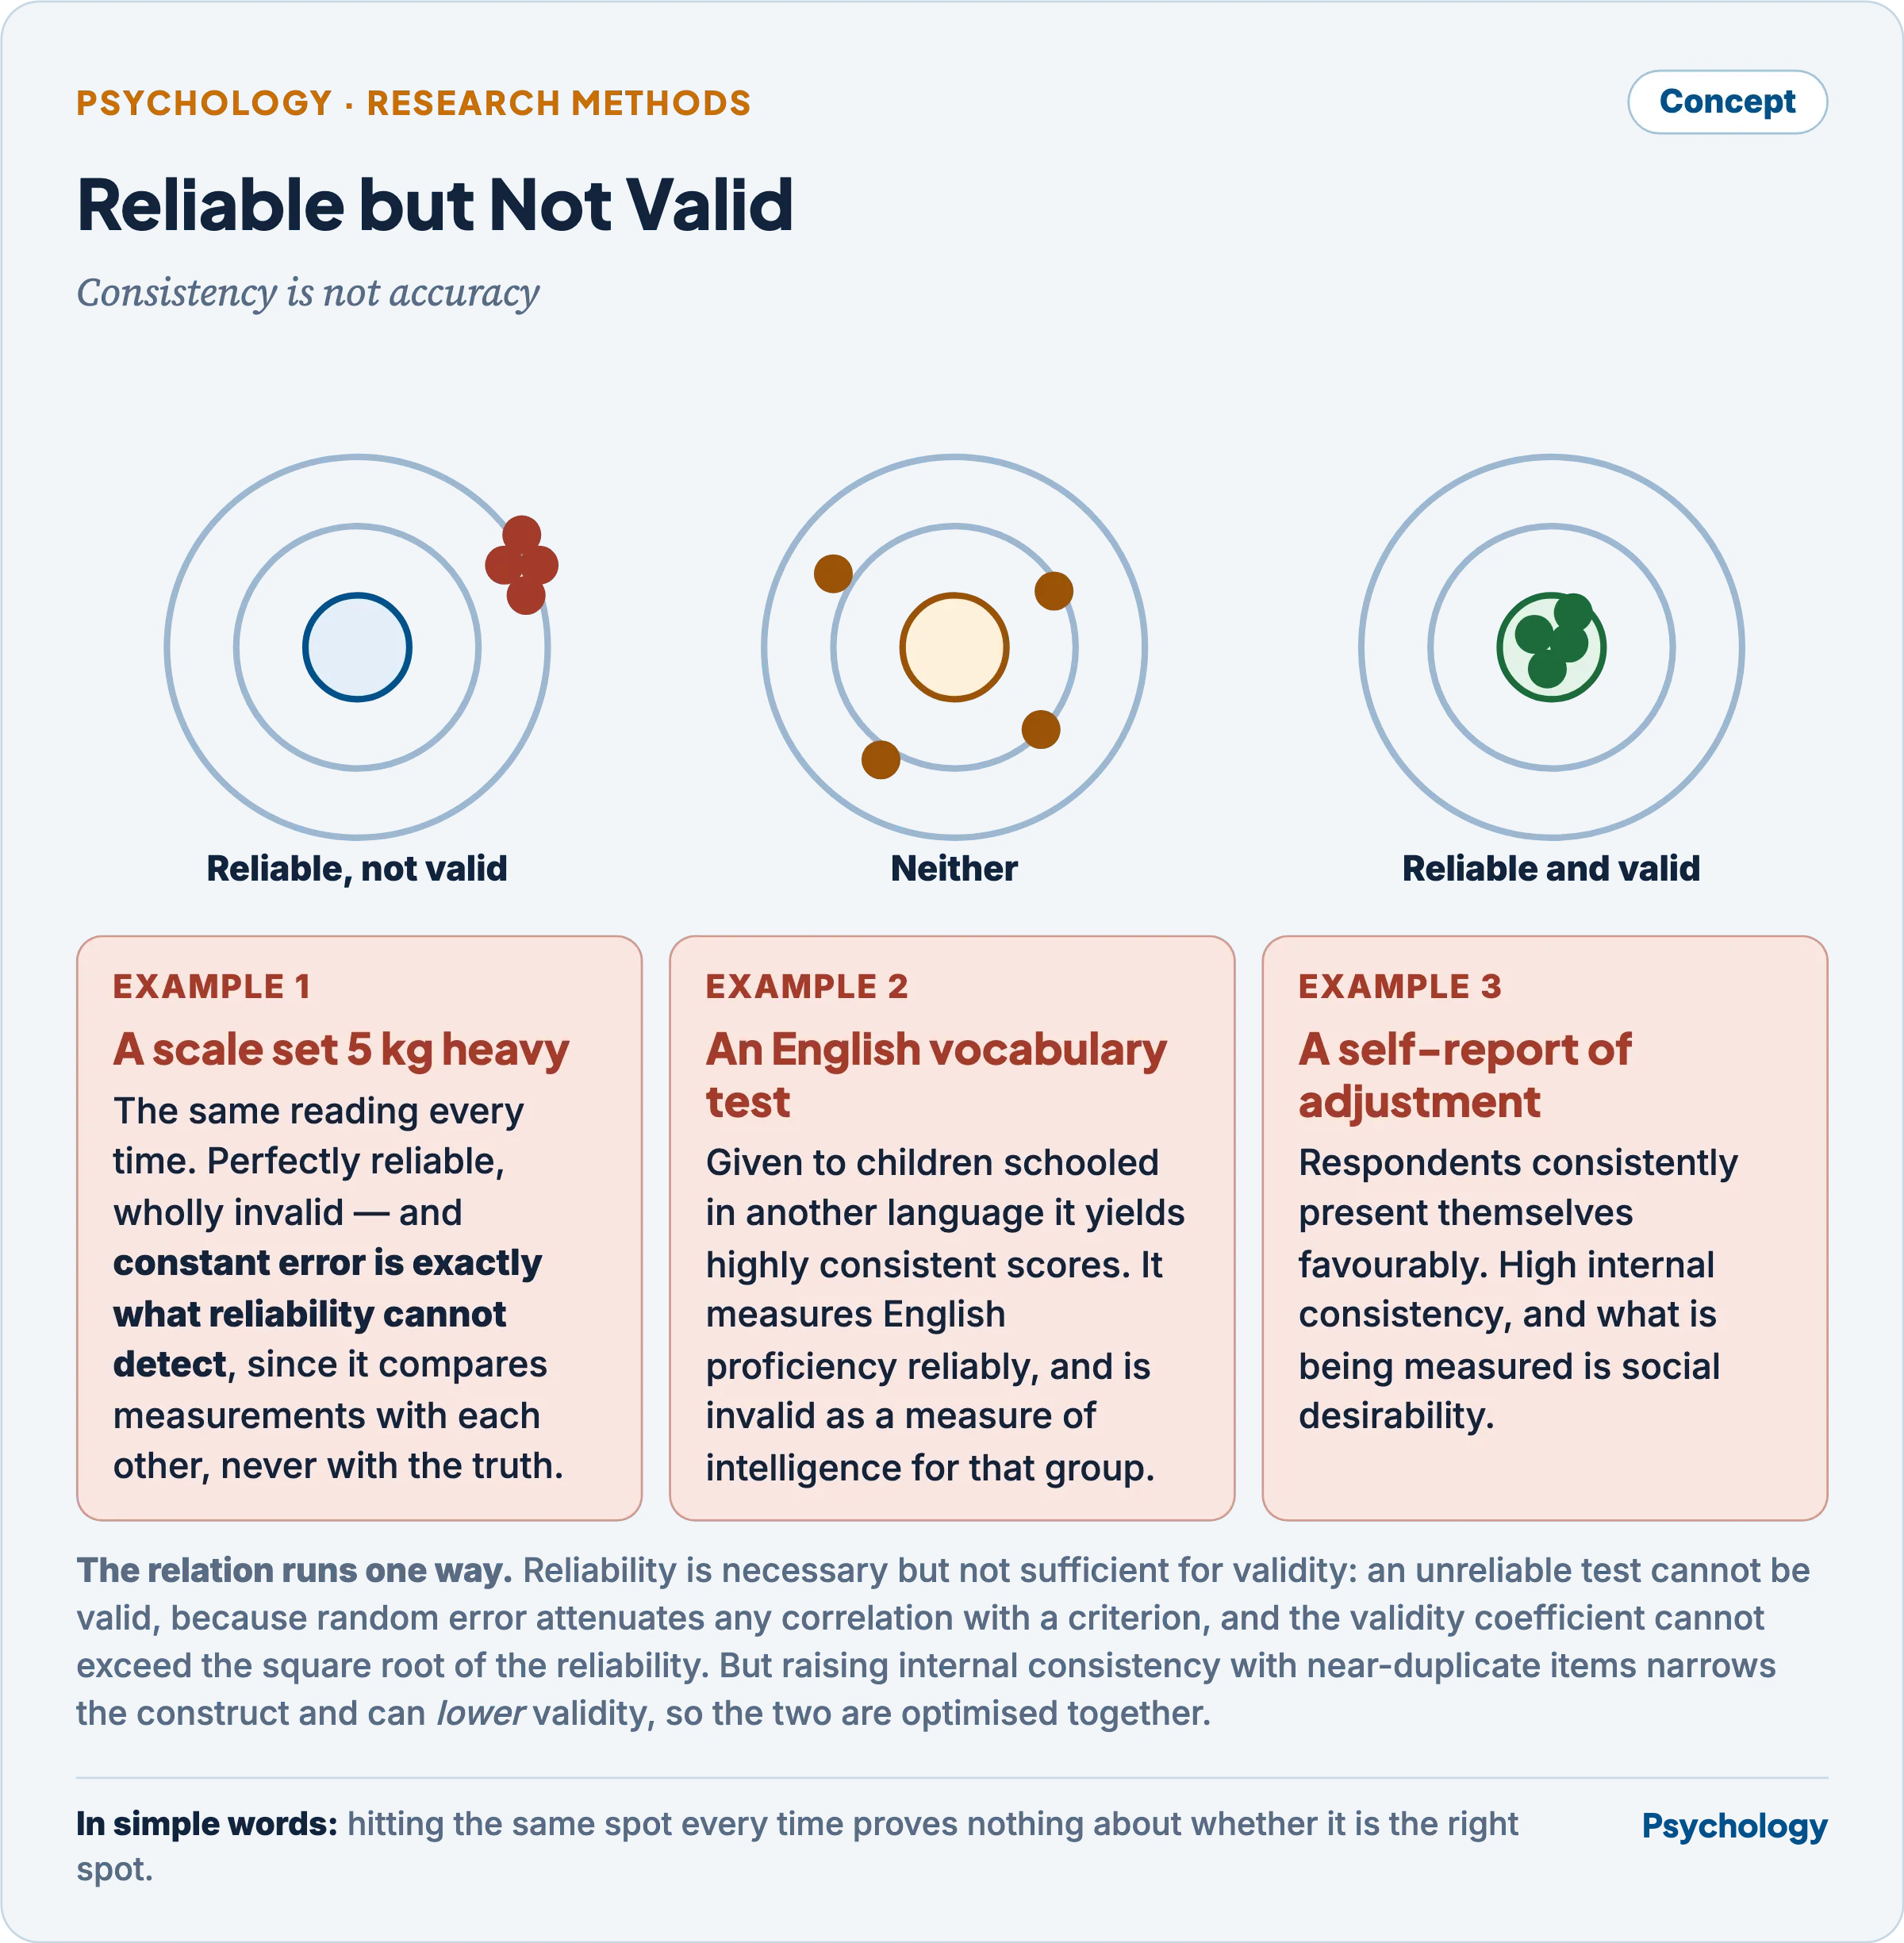
Consistency is not accuracy: the tight group is off the mark in every shot.
- A weighing scale set five kilograms heavy gives the same reading every time. It is completely reliable and invalid as a measure of weight, because it has a constant error — and constant error is exactly what reliability coefficients cannot detect, since they compare measurements with each other rather than with the truth.
- A vocabulary test administered in English to children schooled in another language yields highly consistent scores. It measures English proficiency reliably, and is invalid as a measure of intelligence for that group.
- A self-report inventory of social adjustment on which respondents consistently present themselves favourably has high internal consistency and measures social desirability.
- The relation runs one way. Reliability is necessary but not sufficient for validity. An unreliable test cannot be valid, because random error attenuates any correlation with a criterion; and the validity coefficient cannot exceed the square root of the reliability coefficient, which puts a ceiling on validity set by reliability.
- The converse failure is also instructive: raising internal consistency by filling a test with near-duplicate items narrows the construct and can reduce validity, so the two must be optimised together rather than reliability maximised alone.
Methods of data collection
The interview
A purposive conversation in which an interviewer elicits information from a respondent, classified by how far the schedule is fixed: structured (identical questions in identical order), semi-structured (a guide with freedom to probe) and unstructured or depth (topics only).
- Strengths — it reaches material no other method does: the respondent’s own framing, motives, and the meaning events hold for them. The interviewer can probe an incomplete answer, clarify a misunderstood question, observe non-verbal behaviour, establish rapport on sensitive topics, adapt language to the respondent, and obtain data from the illiterate, the very young and the unwell. Response rates are far higher than for questionnaires, and complex or branching enquiries are feasible.
- Limitations — it is costly in time and trained personnel, so samples are small; the interviewer effect biases responses through tone, expectation and personal characteristics; anonymity is impossible, so social desirability operates strongly on stigmatised topics; unstructured material is laborious to code and comparability across interviews is weak; and the record depends on accurate capture.
- Precautions for effective use — train and supervise interviewers and standardise their conduct; prepare a schedule and pilot it; establish rapport before the substantive questions; use open, non-leading wording and avoid signalling approval; move from general and non-threatening to specific and sensitive; probe neutrally; record verbatim with consent rather than from memory; guarantee and observe confidentiality; conduct the interview privately so that others present do not shape answers; match interviewer and respondent on sex or language where the topic requires; and check a subsample by a second interviewer.
Observation
Recording behaviour as it occurs rather than asking about it, which is its decisive advantage: it does not depend on the respondent’s willingness or ability to report.
- Varieties: structured against a predefined schedule versus unstructured; participant versus non-participant; naturalistic in the field versus controlled in an arranged setting.
- The machinery that makes it data rather than impression: an operationally defined behavioural unit, a sampling rule — time sampling records whether the behaviour occurred in fixed intervals, event sampling records every occurrence — a coding schedule or checklist, and a second observer from whom inter-observer reliability is computed.
- Limitations: reactivity, the change in behaviour produced by being watched; observer bias and selective recording; inaccessibility of private, rare and internal events; and the heavy cost in observer time.
The survey
A survey is not a separate instrument but a design for applying one: a standardised set of questions put to a probability sample, so that the answers can be aggregated into estimates for the population. Its characteristic instruments are the questionnaire, which the respondent completes, and the structured interview, which an interviewer administers from an identical schedule. What makes it a survey is the combination of a sampling frame, identical wording for every respondent, and the intention to estimate rather than to describe cases. Its strength is breadth — it is the only practical way to establish how common something is in a population — and its weaknesses are those of self-report and of non-response, treated below. The contrast with observation is the useful one to hold: a survey reaches what people are willing and able to say about their behaviour, observation reaches the behaviour, and the two frequently disagree.
The questionnaire
A set of written items answered by the respondent without an interviewer.
- Strengths — cheap per respondent, so large and geographically spread samples are feasible; perfectly standardised, since every respondent meets identical wording; free of interviewer bias; capable of anonymity, which raises honesty on sensitive topics; and completed at the respondent’s convenience, which allows consultation of records.
- Limitations — low response rates, and non-respondents differ systematically; it requires literacy and reasonable comprehension, which excludes much of a general Indian population; no opportunity to probe or clarify a misread item; no check that the intended person answered, or answered seriously; unsuitable for complex or branching enquiries; and vulnerable to response sets — acquiescence, extreme or central responding, and social desirability.
- Increasing its utility — pilot every item on respondents like the intended ones; keep it short and visually clear; use simple, concrete language and translate with back-translation; balance positively and negatively keyed items against acquiescence; include a social-desirability or consistency check; explain purpose and guarantee anonymity in a covering note; use reminders and follow-ups to lift the response rate, and compare early with late respondents to estimate non-response bias; and combine with interviews on a subsample.
The case study
An intensive examination of a single unit — a person, family, institution or community — over time, drawing on interview, observation, documents, test scores and archival records together. Its place among the tools is as the one that combines the others on a single case, which is why it is used where the phenomenon is rare and where the process matters more than the rate.
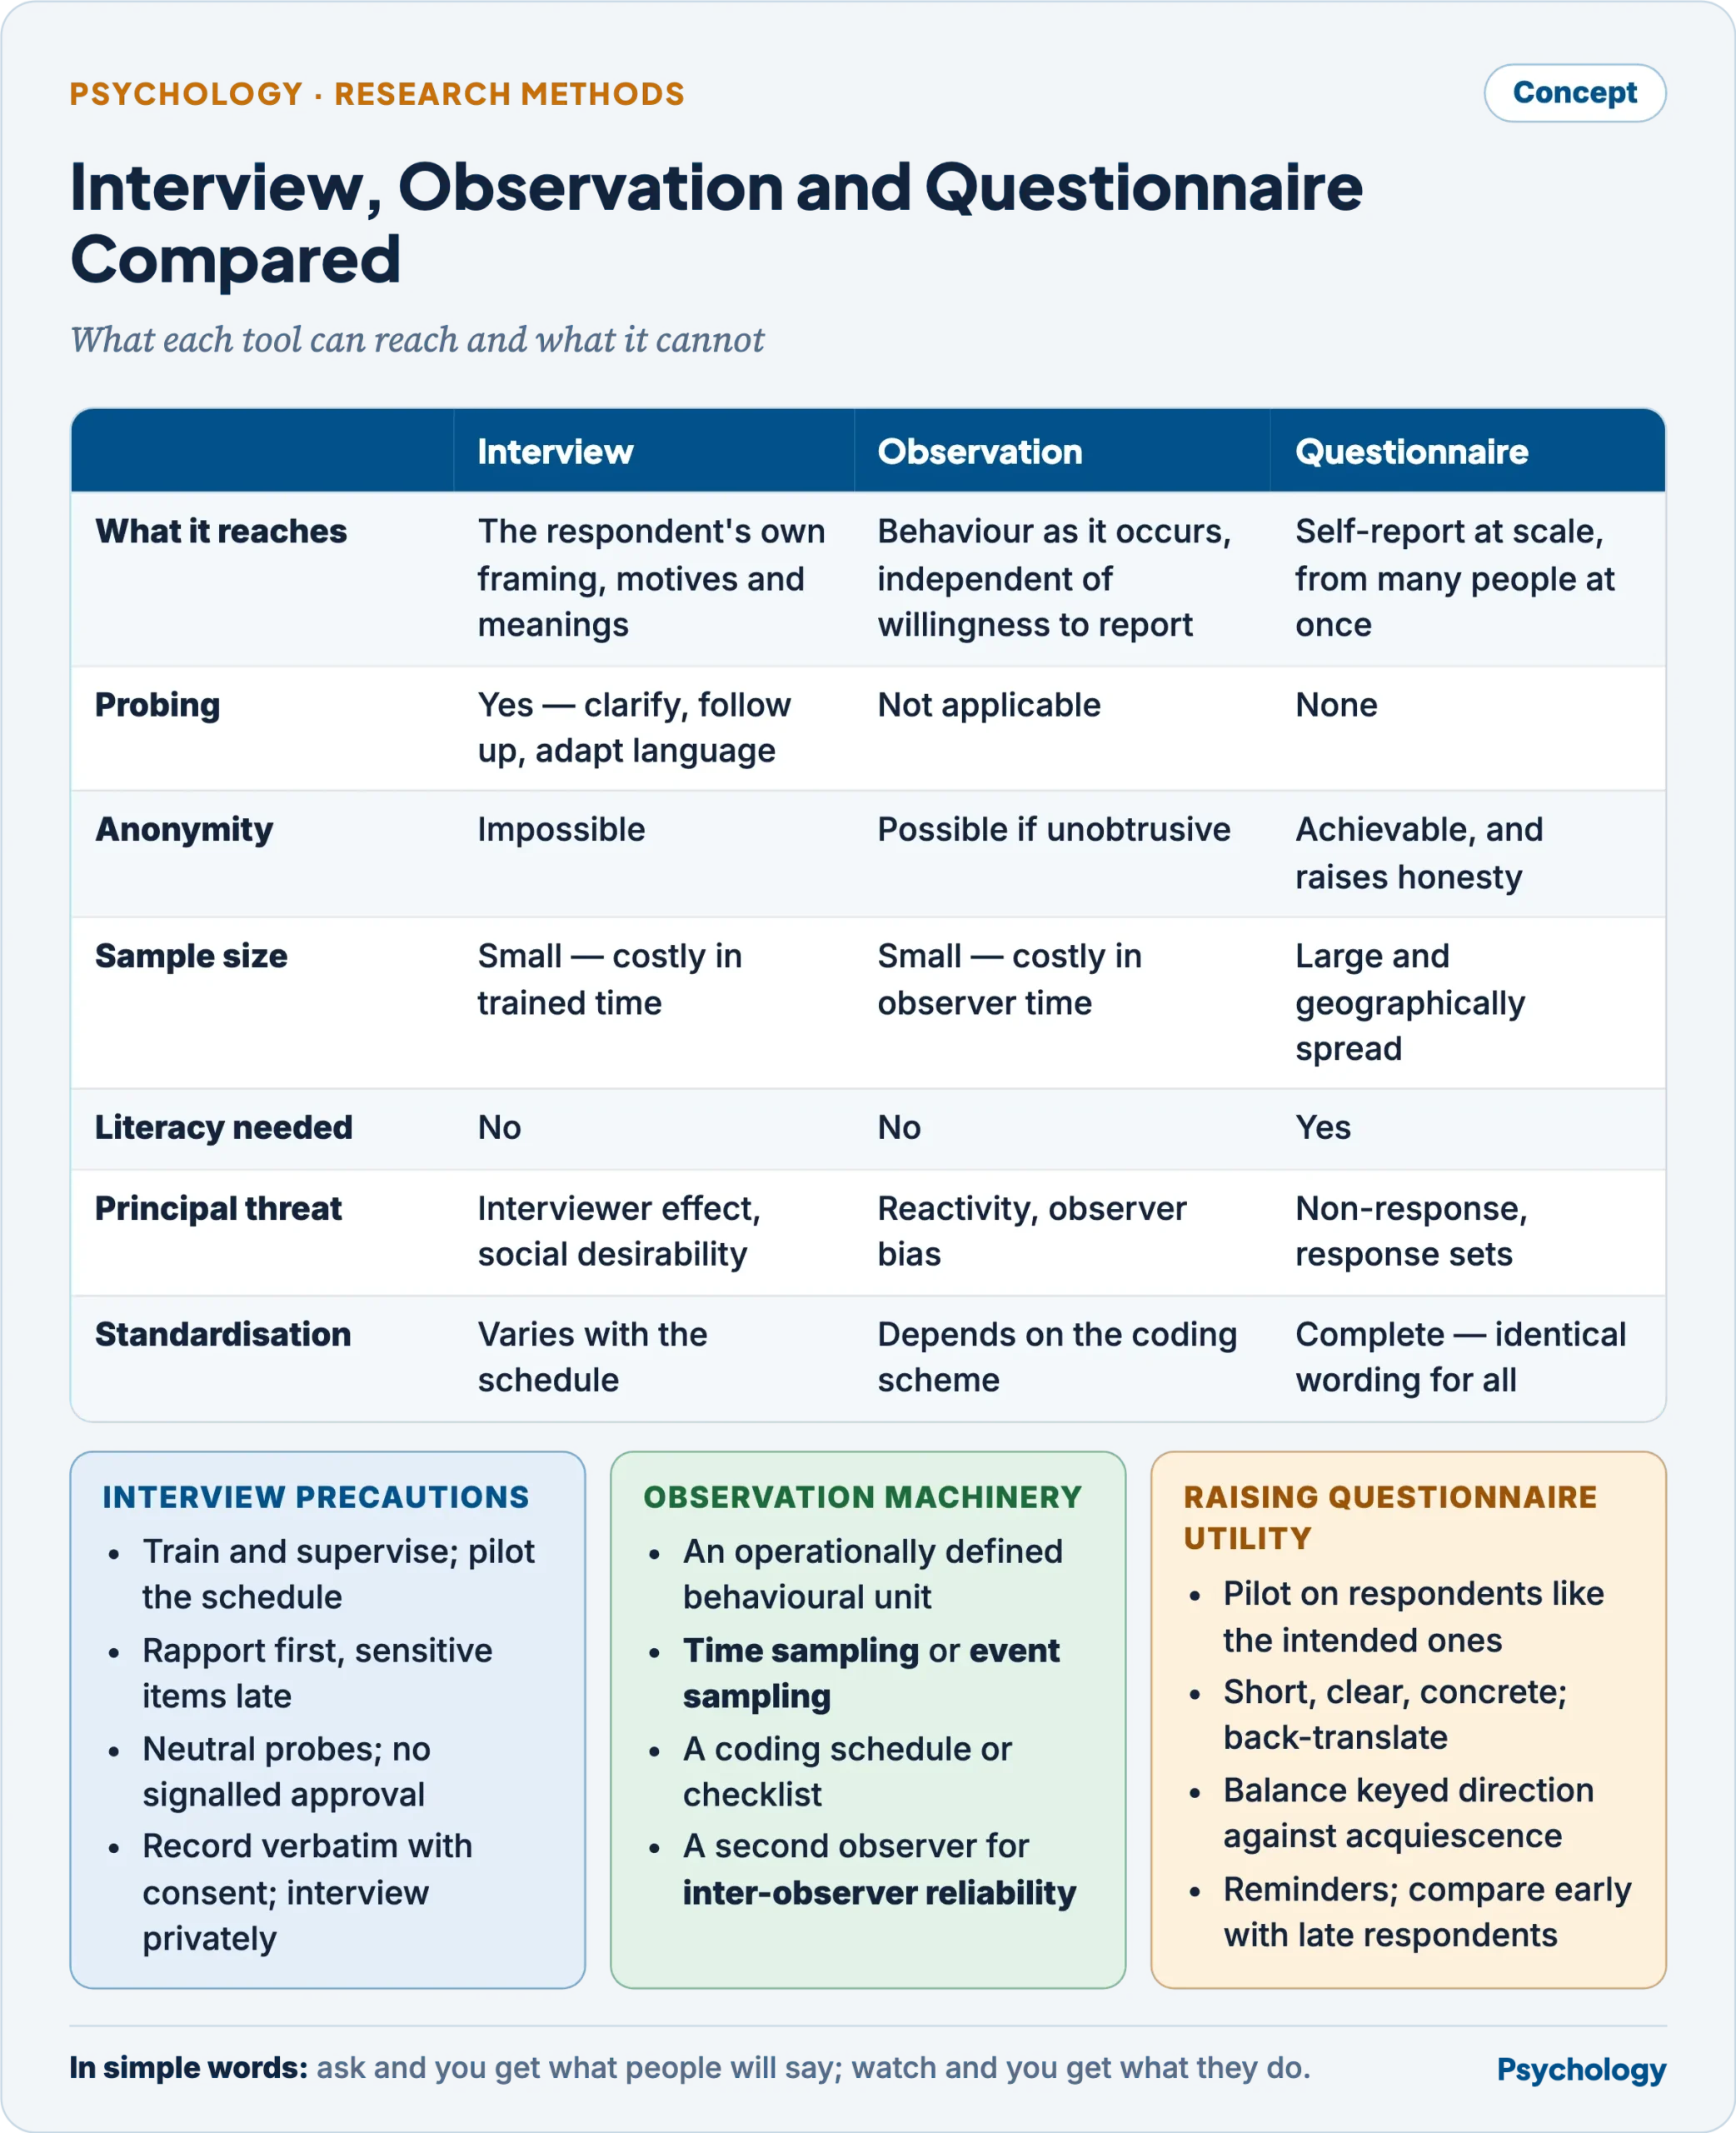
What each tool reaches, and what it cannot.
Criteria of question-writing in survey research
- One idea per item. A double-barrelled question — “Are the timings and the staff satisfactory?” — cannot be answered by anyone who holds different views on the two.
- Simple, concrete, everyday language, at the vocabulary level of the least educated respondent, with technical terms and abbreviations avoided.
- No leading or loaded wording. “Don’t you agree that…” and emotionally charged terms push the answer, and a question framed in the investigator’s preferred direction measures the framing.
- No double negatives, which respondents reliably misparse.
- A specified reference period — “in the last seven days” rather than “usually”, since vague frequency terms mean different things to different people.
- Response options that are mutually exclusive and exhaustive, with non-overlapping ranges, a balanced number of favourable and unfavourable alternatives, and an explicit “don’t know” where ignorance is a real possibility.
- No assumption of fact not established. A question about a respondent’s children presupposes they have some; filter questions route past what does not apply.
- Order matters. Begin with easy, non-threatening items to build commitment, group by topic, place sensitive and demographic items late, and watch for context effects where an earlier item changes the meaning of a later one.
- Avoid reliance on long recall and on questions requiring calculation or estimation the respondent cannot perform.
- Pilot, then revise. Pretesting on the intended population is the only way to find items that are read differently from how they were written, and it is the step most often skipped.
Analysis and interpretation
Collected data become a finding only through two separable acts. Analysis summarises and tests: descriptive statistics to describe the sample, inferential tests chosen in advance by the design, the measurement scale and the assumptions the data satisfy. Interpretation states what the result means for the hypothesis and the population, and it is the step where the characteristic errors occur — treating a significant result as a large or important one, reading an association as a cause, accepting a non-significant result as evidence of no effect, and extending a conclusion to people the sample never represented. Present practice requires an effect size and a confidence interval with every test, and requires the sampling procedure to be reported in enough detail that a reader can judge for themselves whom the finding describes.
Indian context
- Indian national surveys are the working examples of multi-stage probability design. The National Family Health Survey, whose fifth round was conducted in 2019–21 by the Ministry of Health and Family Welfare through the International Institute for Population Sciences, uses a two-stage stratified design — villages in rural areas and Census Enumeration Blocks in urban areas selected with probability proportional to size, then households selected systematically within them. The stratification by state, district and residence is what allows district-level estimates from a sample, and it is the reason the survey can report on mental health and substance use for populations no convenience sample would reach.
- Impact evaluation of a social scheme is where sampling and data collection decide the answer. The design that answers “did the scheme work?” needs a comparison that the scheme did not create: blocks or villages where rollout has not yet happened, or a cut-off in eligibility that assigns otherwise similar households either side of it. Sampling is then multi-stage and stratified by district and by exposure, with the unit of sampling matched to the unit of delivery. Data collection is mixed by necessity — a structured questionnaire for coverage and outcomes, which can be compared across respondents; interviews with beneficiaries and front-line workers for the reasons behind non-use, which a questionnaire cannot reach; direct observation of the facility, since reported and actual functioning differ; and administrative records as a cross-check on both. The psychological contribution is specific: self-reported use of a scheme is inflated by social desirability and by the respondent’s belief about what the interviewer wants, so a design that relies on it alone will report success.
Criticisms and limitations
- Probability sampling is rare in published psychology. Most findings rest on undergraduate volunteers or online panels, and the apparatus of significance testing, which presupposes random sampling, is applied to samples that were not randomly drawn. The gap between the statistical model and the actual recruitment is seldom acknowledged.
- Reliability coefficients are routinely over-read. Internal consistency is reported as though it established quality, when it measures only item homogeneity, says nothing about validity, and rises mechanically with test length.
- Validity is treated as a property of a test rather than of an inference, so a test “validated” for one purpose and population is used for another. Messick (1989) argued that validity is a unified judgement about score interpretation and use, including its social consequences, which is still imperfectly reflected in practice.
- Self-report dominates the evidence base. Questionnaires are cheap, so most of what psychology knows about attitudes, personality and wellbeing rests on what people are willing to say about themselves, with its response sets attached.
- Norms date, and travel badly. A test standardised decades ago on an unrepresentative group continues in use, and translation without re-norming and without checking item functioning produces scores that look interpretable and are not.
Previous Year Questions
- 2026In what ways can sampling bias affect the accuracy of research outcomes? Discuss the role of data analysis and interpretation in generating meaningful research findings.
- 2025In what ways is probability sampling appropriate in the conduct of psychological research? Illustrate your answer with different techniques of probability sampling.
- 2024Describe data collection methods in psychology with special reference to observation and survey methods.
- 2021“Some psychological measures can be reliable but not valid.” Elaborate it with examples.
- 2018How can different methods of sampling and data collection be useful in impact evaluation of government social schemes? Describe with a suitable example.
- 2017Evaluate “interview” as a method of data collection.
- 2013What are the requirements to be met by psychological assessment tools for offering accurate and useful measure of psychological constructs?
- 2012Bring out the difference between ‘sampling error’ and ‘error in sampling’. How ‘sampling error’ is reduced?
- 2012Discuss the criteria of question-writing in a survey research.
- 2004Explain the usefulness of ‘interview’ as a method of data collection. State the precautions that you would take for its effective use.
- 2002Evaluate questionnaire as a tool for collecting data for psychological research. Offer suggestions for increasing its utility as a research tool.
- 1996How is psychological measurement different from measurement in physical sciences? Giving appropriate illustrations, distinguish clearly between psycho-physical and psychometric measures.