

Why is mapping important for analysing geo-hydrological investigations? Explain with relevant examples. (2020)
- A geo-hydrological (hydrogeological) investigation studies the occurrence, movement and quality of surface and ground water as controlled by rock type, structure and landform.
- Its core difficulty is that a well, spring or borehole is a point, while an aquifer, its recharge area and its flow paths are areal and three-dimensional. Mapping is the tool that turns scattered points into continuous surfaces.
- David K. C. Jones framed applied geomorphology in terms that make the map its natural instrument:
- “the application of geomorphic understanding to the analysis and solution of problems concerning land occupancy, resource exploitation, and environmental management and planning” — David K. C. Jones
- In geo-hydrology that understanding is applied mainly through maps.
What Mapping Does That Point Data Cannot
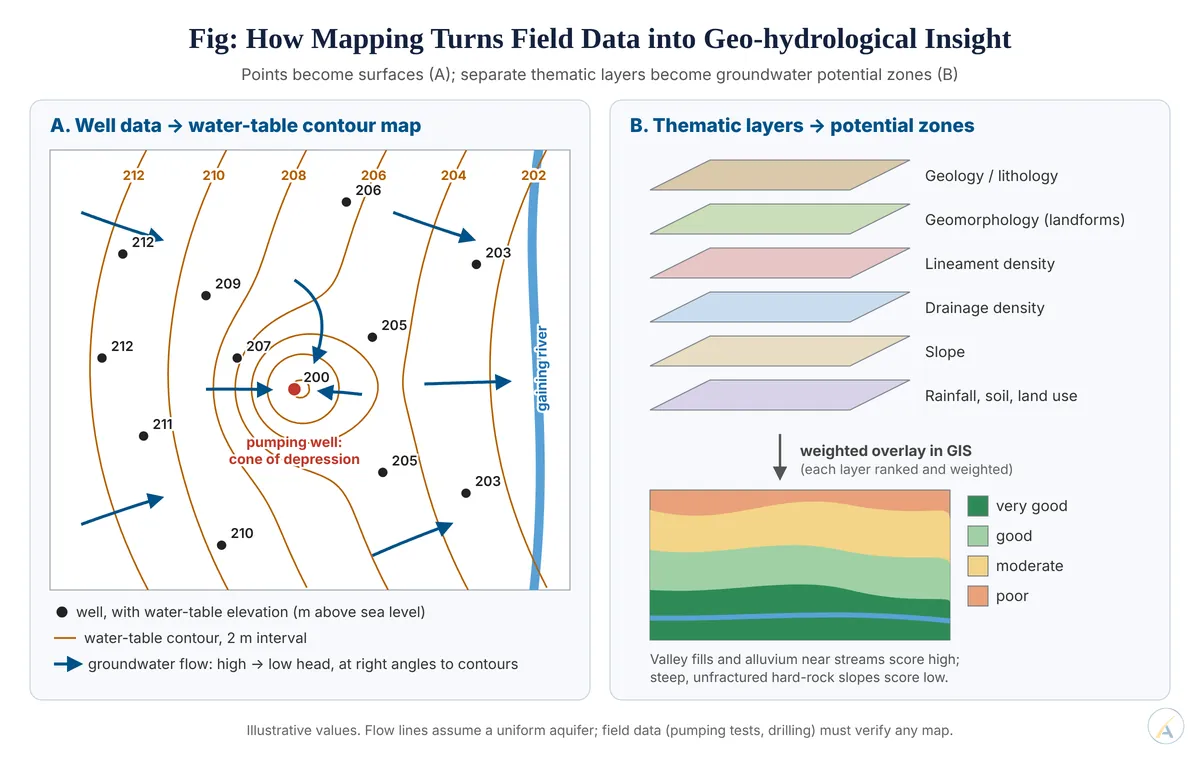
- Turns points into surfaces: water levels from scattered wells, contoured into a water-table map, show the direction of groundwater flow (perpendicular to the contours, from high to low head) and the hydraulic gradient — and hence where a pollutant will travel.
- Integrates the controls: lithology, structure, slope, drainage density, soil and land use vary across short distances; overlaying them yields hydrogeomorphological units — valley fills, buried pediments and alluvial fans are usually good aquifers, while bare pediments and steep hard-rock slopes are poor.
- Adds the third dimension: maps of aquifer thickness, depth to bedrock and the water-bearing zones show the geometry of an aquifer, which no single log can.
- Adds time: repeated maps show depletion, recovery or pollution spreading — change that a one-off measurement misses.
Examples Across Terrains
Hard-rock terrain of Peninsular India
- In granite, gneiss and Deccan basalt, groundwater sits in the weathered zone and in fractures, not in the rock mass. Lineament maps from satellite imagery locate fracture and fault zones, and dykes mapped as barriers explain why two wells a short distance apart can have very different yields.
Karst terrain
- Water moves through solution channels, so springs can be fed from sinkholes several kilometres away.
- Mapping sinkholes, swallow holes and springs is the first step; dye-tracing (e.g. fluorescein put into a mapped swallow hole and detected at a spring) then confirms the link and identifies the source of a polluted spring. The limestone and cave terrain of Meghalaya needs exactly this before water supply is planned.
Glaciated and alluvial terrain
- Outwash plains and buried glacio-fluvial gravels are good aquifers; clay-rich till is poor. Buried valleys have no surface expression and can be found only by constructing a bedrock-topography map beneath the cover.
National aquifer mapping in India
- Under the National Aquifer Mapping and Management Programme (NAQUIM), the Central Ground Water Board mapped about 25 lakh sq km — the mappable part of India’s roughly 33 lakh sq km — by 31 March 2023, with heli-borne geophysical surveys giving high-resolution aquifer maps for nearly 1 lakh sq km of Rajasthan, Gujarat and Haryana. The maps underpin aquifer-wise management plans.
Mapping from space
- Matthew Rodell, Isabella Velicogna and James S. Famiglietti (2009) used GRACE satellite gravity to show north-western India losing groundwater at about 4 cm of water a year, some 109 cubic km between 2002 and 2008.
- Akarsh Asoka, Tom Gleeson, Yoshihide Wada and Vimal Mishra (2017) mapped a sharper picture: storage falling about 2 cm a year in the north and rising 1–2 cm a year in the south (2002–2013), driven mostly by changing monsoon rainfall, with pumping dominant in the north-west — a spatial contrast that calls for region-specific, not uniform, policy.
Hazard mapping
- Radar (InSAR) maps by Shagun Garg and colleagues (2022) showed Kapashera, near Delhi airport, subsiding at more than 11 cm a year as groundwater fell, while Dwarka shifted from subsidence to slight uplift after curbs on extraction and rainwater harvesting — the map linked the cause to the effect.
Limits of the Map
- A map is only as good as its data: interpolation between sparse wells, coarse scale and unverified lineaments can mislead, so maps must be checked by pumping tests, drilling and field surveys.
- Judgement: mapping is not an illustration of a geo-hydrological study but its method of analysis — water is a spatial variable, and only maps reveal where it occurs, which way it moves and where it is being lost; the best investigations pair satellite-scale maps with ground truth.