

Discuss the methods of measuring the intensity and magnitude of earthquakes. How are seismic zones demarcated? (2019)
- Magnitude measures the energy released at the source (focus); intensity measures the effects of shaking at a particular place — on people, buildings and the ground.
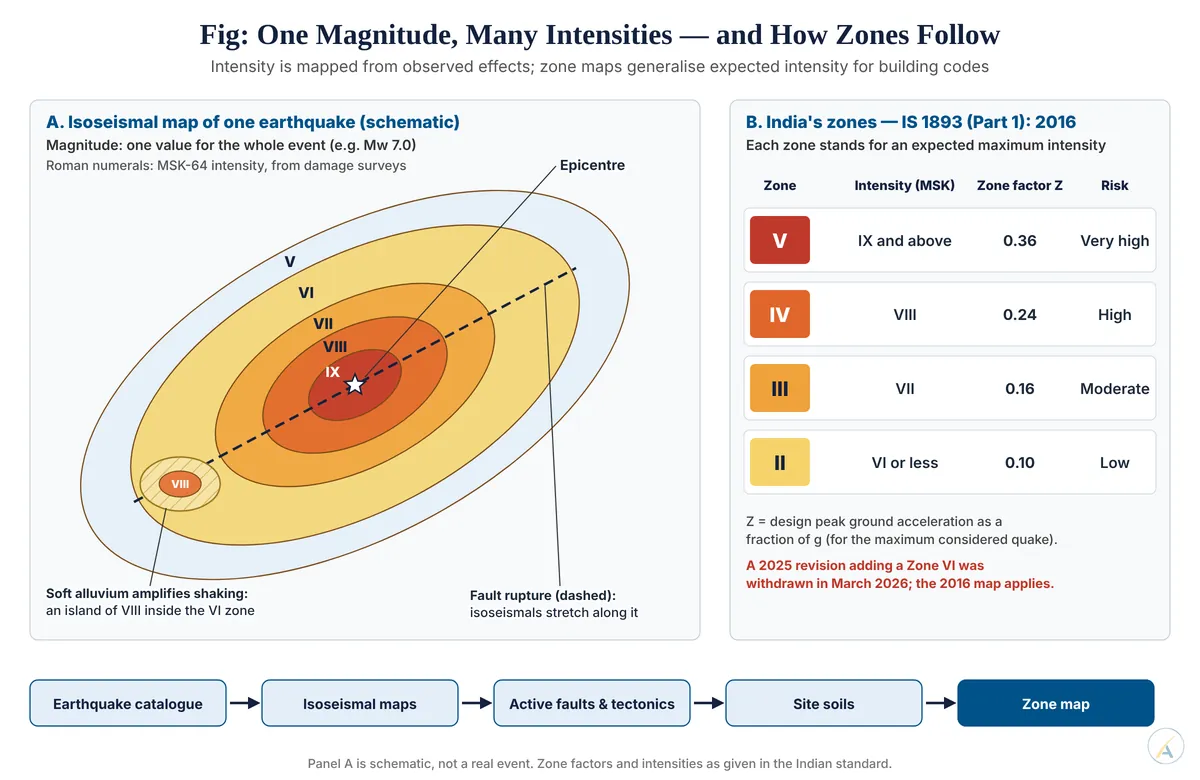
- An earthquake therefore has one magnitude but many intensities: intensity is generally highest near the epicentre and falls with distance, but rises again wherever soft ground amplifies shaking.
- Seismic zonation combines both records with the tectonic setting to map the shaking a region should expect in future, so that building codes can match it.
Measuring Magnitude: Instrumental Methods
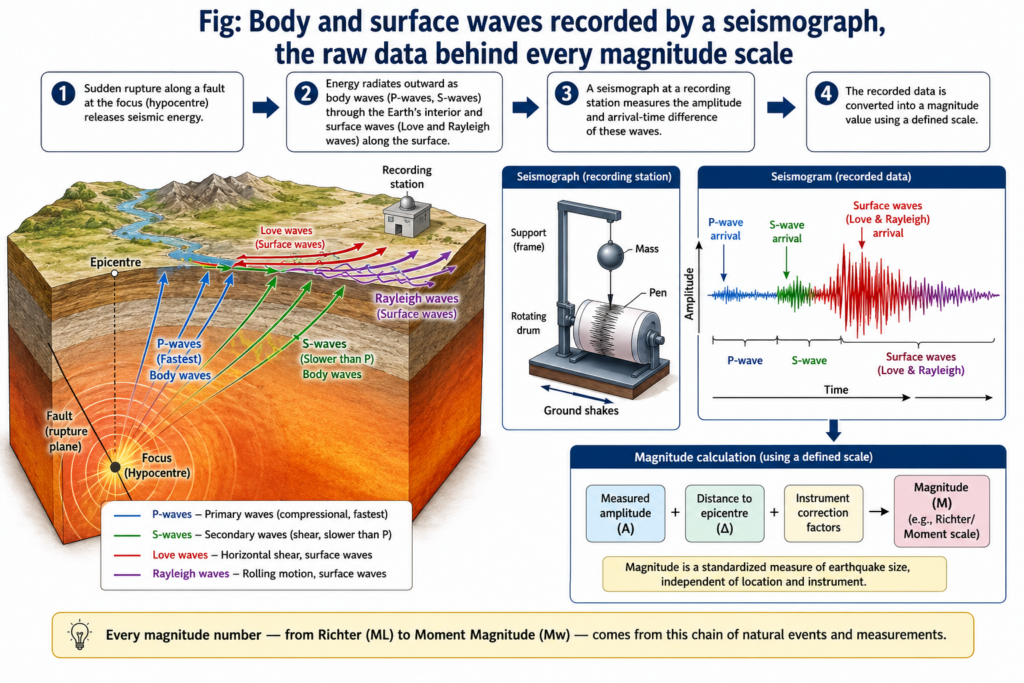
- A seismograph records ground motion as a seismogram: P-waves (compressional, fastest) arrive first, S-waves (shear, through solids only) next, and surface waves (Love and Rayleigh) last, usually with the largest amplitude.
- Locating the quake: the S–P time interval gives the distance to the epicentre; distances from three stations fix its position by triangulation.
- Richter local magnitude (ML) — Charles Francis Richter, with Beno Gutenberg, 1935:
- the logarithm of the maximum trace amplitude on a standard Wood–Anderson seismograph, corrected to a reference distance of 100 km;
- each whole number means 10 times the amplitude and about 32 times the energy.
- Body-wave (mb) and surface-wave (Ms) magnitudes, developed by Beno Gutenberg in the 1940s, extended measurement to distant earthquakes.
- Limitation — saturation: these amplitude scales stop rising for great earthquakes (mb near 6, Ms near 8), because the short waves they read cannot register a rupture hundreds of kilometres long.
- Moment magnitude (Mw) — Thomas C. Hanks and Hiroo Kanamori, 1979: derived from the seismic moment (rock rigidity × fault area × average slip), it does not saturate and is now the standard reported worldwide.
- The 2004 Sumatra–Andaman earthquake was first reported near 8.5–8.9 and later fixed at Mw 9.1–9.3 once its rupture, more than 1,300 km long, was modelled.
- In India the National Center for Seismology (Ministry of Earth Sciences) runs the national network and reports magnitudes.
Measuring Intensity: Observational Methods
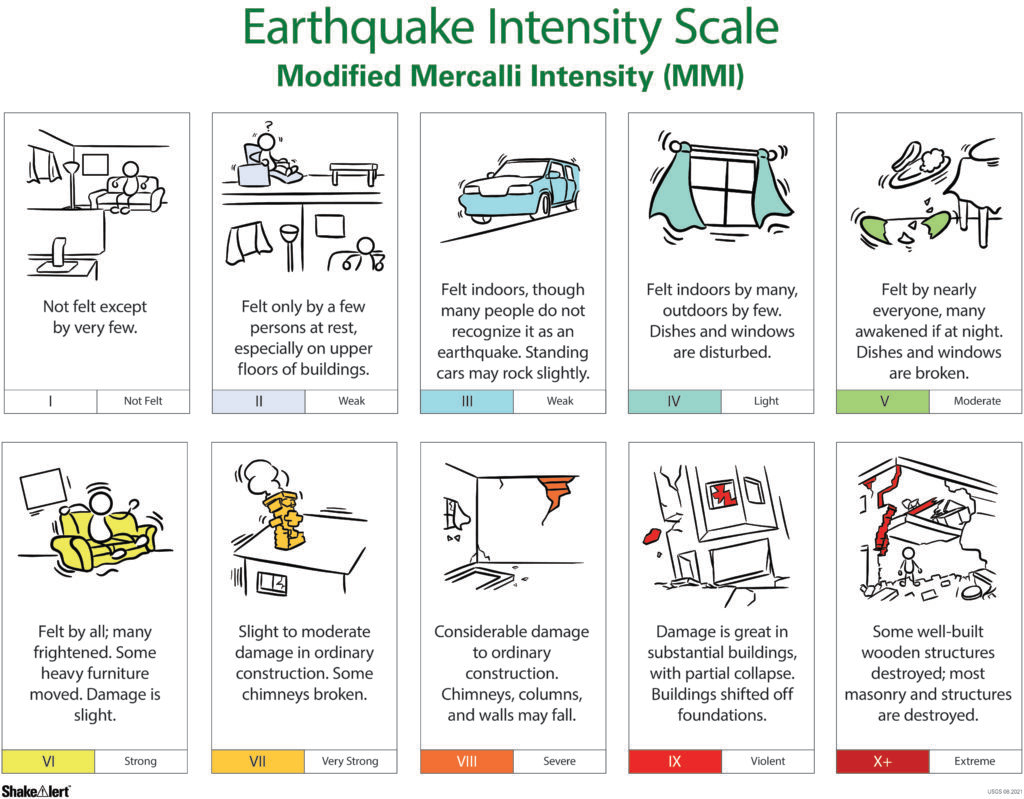
- Intensity is assigned from observed effects: whether people felt it, how objects moved, the type and degree of building damage, and ground effects such as fissures, landslides and liquefaction.
- Scales:
- Rossi–Forel (1883, I–X), then Giuseppe Mercalli’s scale (1902).
- Modified Mercalli Intensity (MMI), revised by Harry O. Wood and Frank Neumann (1931), I–XII — used in the Americas.
- MSK-64 (Sergei Medvedev, Wilhelm Sponheuer, Vít Kárník), I–XII — the basis of India’s code; Europe now uses its successor EMS-98, and Japan its own 0–7 JMA scale.
- Method: field damage surveys and questionnaires (now online “felt reports”) are plotted, and isoseismals — lines of equal intensity — are drawn around the epicentre.
- Value: intensity can be reconstructed from historical accounts, extending the record back before instruments, as for the great 1897 Shillong earthquake.
- Controls on intensity: magnitude, focal depth, distance, building quality and especially local ground.
- In 1985 lake-bed clays shook Mexico City violently about 350 km from the epicentre; in 2001 multi-storey buildings collapsed in Ahmedabad, over 200 km from the Bhuj epicentre.
How Seismic Zones Are Demarcated
- Inputs:
- an earthquake catalogue — instrumental magnitudes plus historical intensities;
- a seismotectonic map — plate boundaries, active faults and thrusts such as the Himalayan Main Frontal, Main Boundary and Main Central thrusts;
- site conditions — rock versus soft alluvium.
- Two approaches:
- Deterministic: zones drawn from the maximum intensity observed or credible in each area — India’s traditional method.
- Probabilistic seismic hazard assessment (PSHA) — C. Allin Cornell, 1968: combines all possible sources and their recurrence to map the ground acceleration with a stated chance of being exceeded, typically 10% or 2% in 50 years.
- India’s map is issued by the Bureau of Indian Standards (BIS) in IS 1893.
- The 1984 map had five zones; after the 1993 Latur earthquake (Mw 6.2) struck old Zone I and killed nearly 10,000 people, the 2002 revision merged Zones I and II into four zones.
- Under IS 1893 (Part 1): 2016, zones correspond to MSK intensities and zone factors (peak ground acceleration for the maximum considered earthquake, as a fraction of g):
- Zone V (MSK IX and above; 0.36) — the North-East, parts of Jammu & Kashmir, Himachal Pradesh and Uttarakhand, north Bihar, the Rann of Kutch, and the Andaman & Nicobar Islands.
- Zone IV (MSK VIII; 0.24) — Delhi, the rest of the western Himalaya, Sikkim, the northern Gangetic plain, parts of Gujarat and the Koyna area.
- Zone III (MSK VII; 0.16) and Zone II (MSK VI or less; 0.10) — most of the Peninsula.
- About 59% of India’s land area falls in earthquake-prone zones.
- Lessons from intraplate quakes: Koyna (1967, M 6.3), linked to reservoir loading, and Latur showed that the “stable” shield is not risk-free.
A Live Disagreement: the 2025 Map
- On 6 November 2025, BIS notified IS 1893 (Part 1): 2025, a fully PSHA-based map that added a sixth, highest Zone VI for the most active belts, led by the Himalaya, and placed about 61% of India’s land in moderate-to-high hazard zones.
- On 3 March 2026 it was withdrawn and the 2016 code restored, after the housing ministry, metro-rail corporations and the National Dam Safety Authority objected that its hazard values exceeded their site investigations and would sharply raise construction costs.
- Judgement: magnitude is now measured precisely and intensity mapped in detail, but zonation remains a contested judgement between scientific hazard and economic cost; the probabilistic method is the right direction, and the 2025 episode shows that a credible map needs validated hazard values as well as political will.