

9.6 Age, sex and population variation as genetic marker: ABO, Rh blood groups, HLA Hp, transferring, Gm, blood enzymes. Physiological characteristics- Hb level, body fat, pulse rate, respiratory functions and sensory perceptions in different cultural and socio-economic groups.
Official Syllabus: Paper I, Unit 9.6
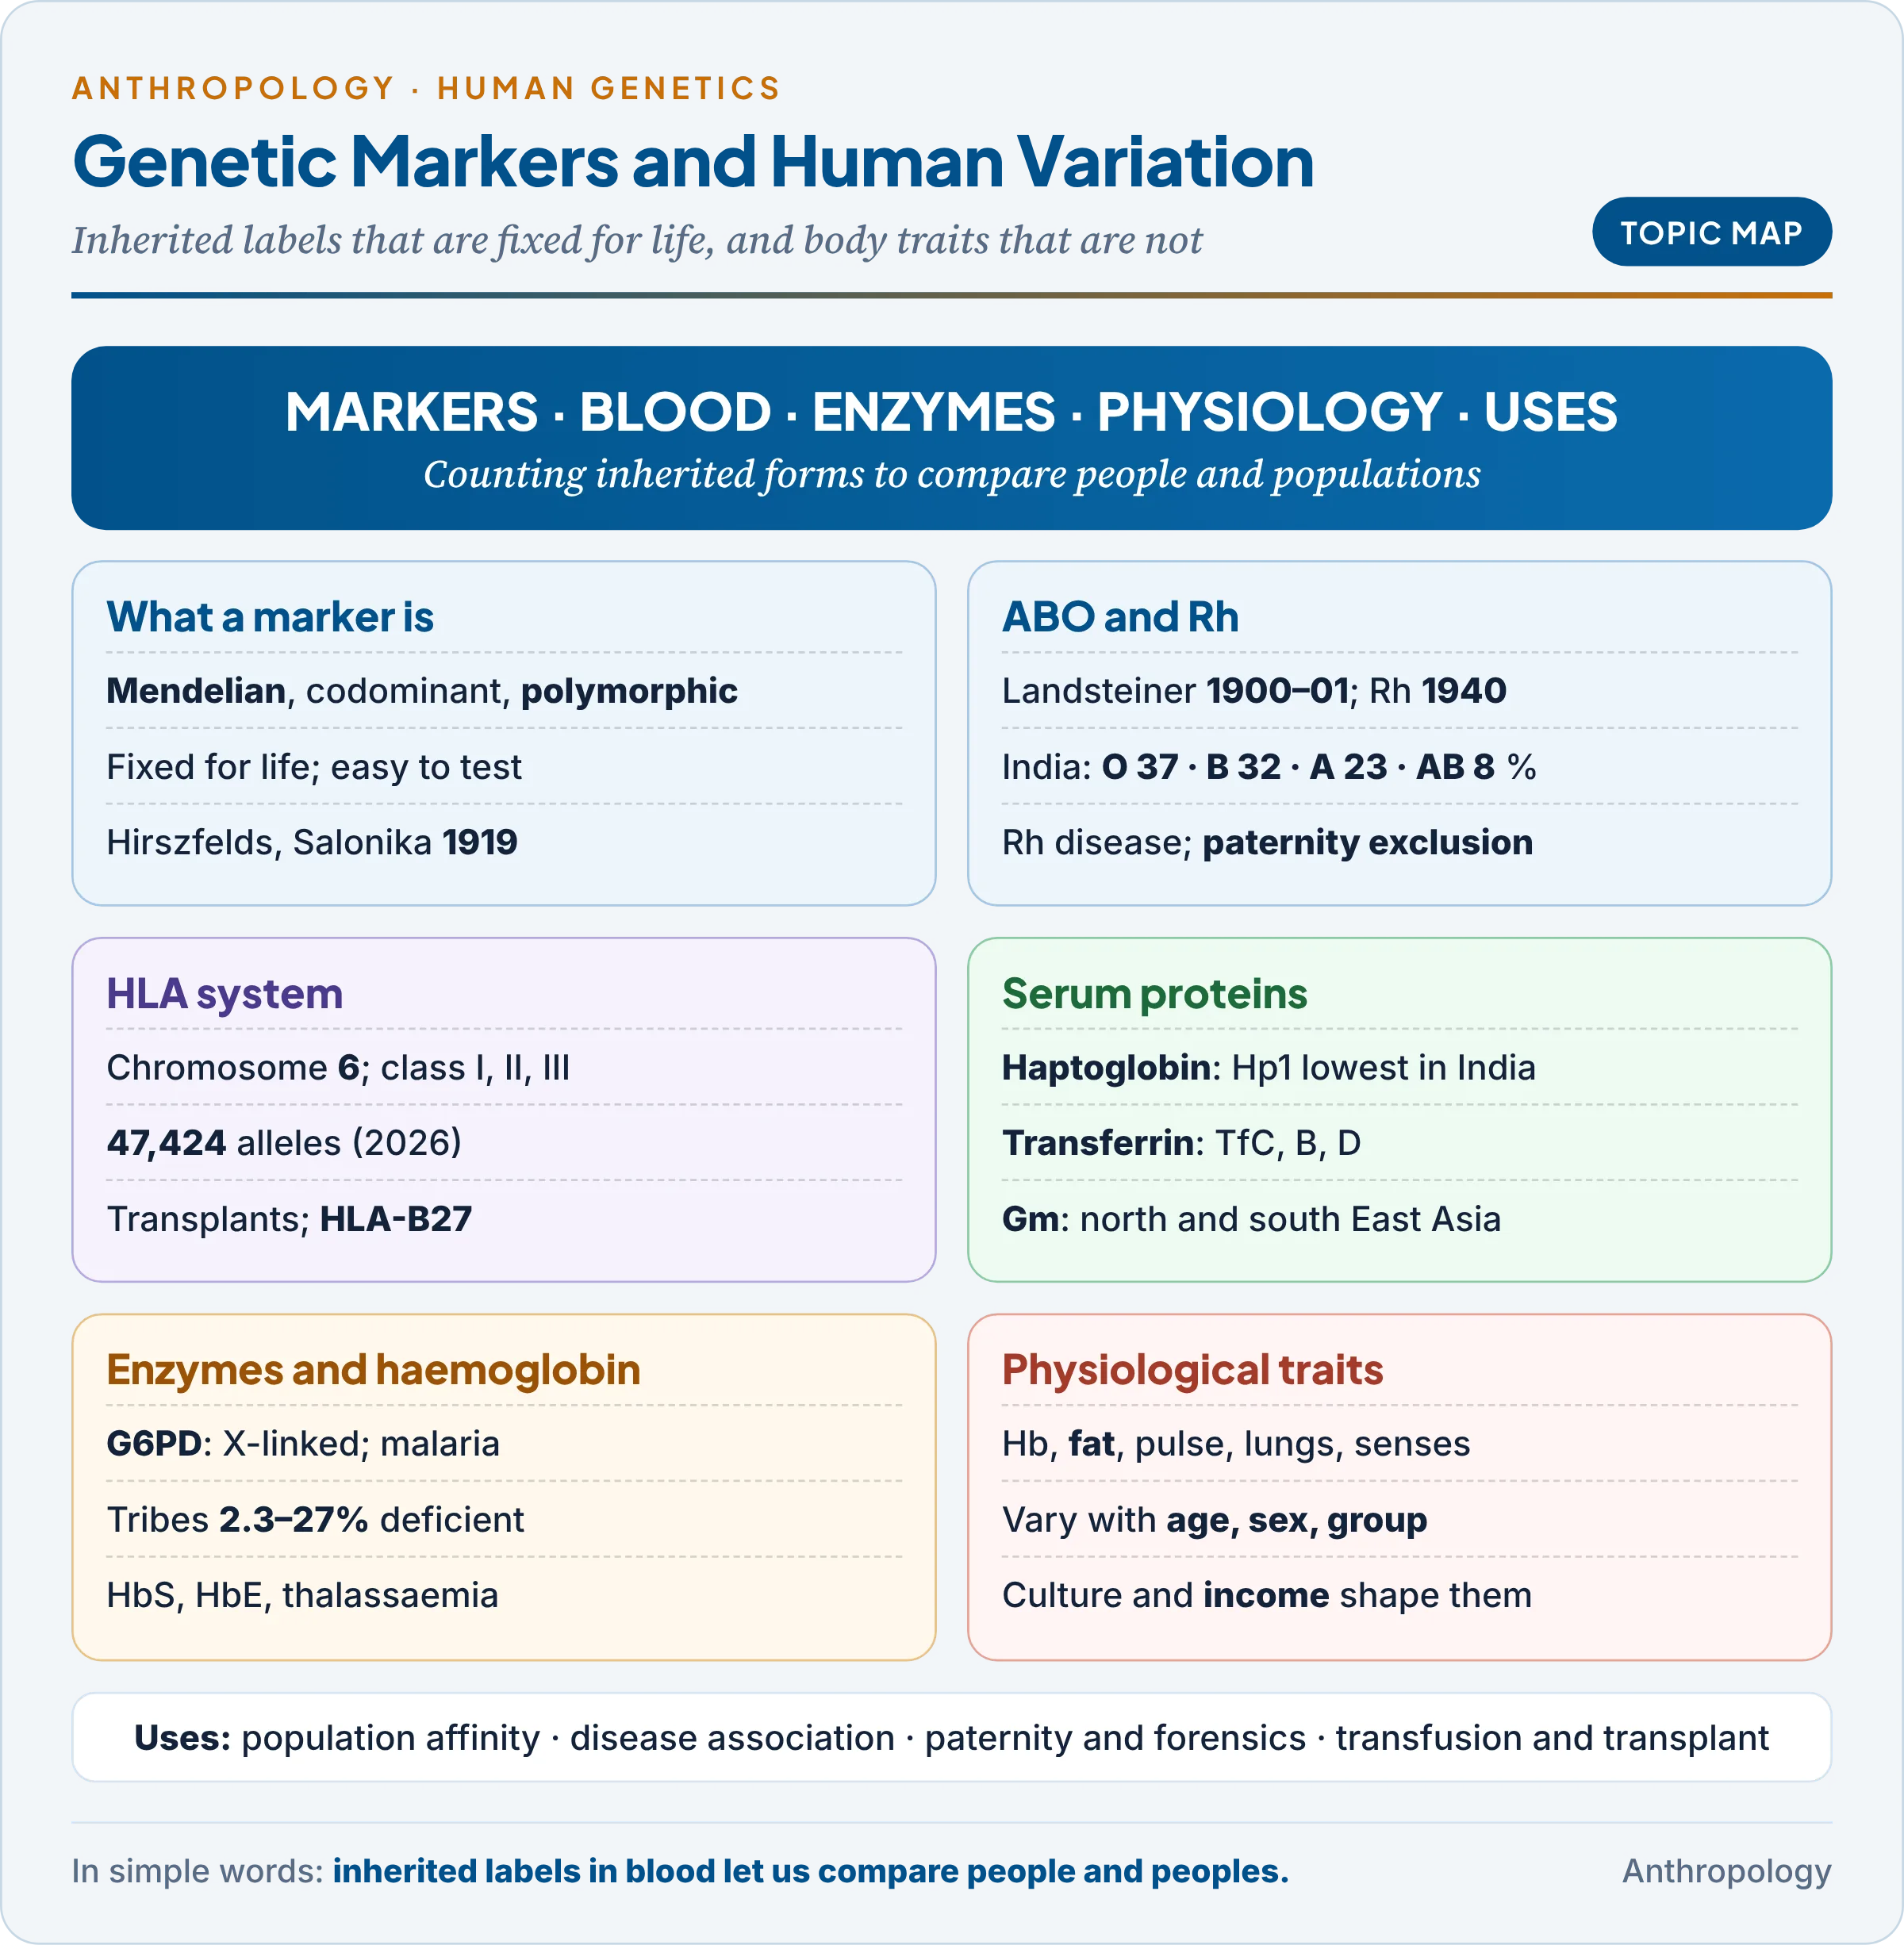
Units 9.1 to 9.3 covered the methods of human genetics, how single genes such as ABO are inherited, and how gene frequencies stay steady or change in populations (the Hardy–Weinberg baseline, moved by selection, drift, migration and inbreeding). This unit looks at the markers themselves, the blood groups, tissue antigens, serum proteins and enzymes counted in thousands of communities, and at physiological traits that differ by age, sex and way of life.
1. What Is a Genetic Marker?
In simple words
A genetic marker is an inherited trait that is easy to test, follows simple rules of inheritance and comes in several common forms. Counting how often each form occurs lets us compare families and whole communities. Blood groups were the first such markers; DNA variants are today’s.
An example first. In 1918–19, on the Macedonian front at Salonika, two Polish army doctors, Ludwik and Hanna Hirszfeld, typed the ABO groups of soldiers of many nations, including Indian troops. Group A was common among western Europeans and group B among Indians. They expressed the contrast as a “biochemical race index” (the ratio of A to B) in The Lancet (1919): the first use of a blood group as a population marker, an invisible inherited trait that separated populations more objectively than skin colour or head shape.
Definition. A genetic marker is a trait that is (1) genetically determined, (2) inherited in a simple Mendelian way, (3) classifiable without ambiguity, and (4) polymorphic, present in at least two common forms (Unit 9.3).
Why blood groups make good markers. Each property removes an error that troubles measurements such as stature or head form:
- Fixed for life: ABO type does not change with diet or climate, so a group’s frequency reflects ancestry, not living conditions.
- Simple inheritance: one locus, known alleles, often codominant (both alleles visible), so allele frequencies can be calculated directly (Worked Example 1).
- Objective testing: blood plus antiserum gives a yes-or-no answer that any laboratory can repeat.
- Independent systems: ABO, Rh and MN lie on different chromosomes, so each is a separate line of evidence about history.
The main kinds of marker. The table sorts the classical markers by where they sit in the blood.
| Kind | Where found | Examples | Method |
|---|---|---|---|
| Red cell antigens | Red cell surface | ABO, Rh, MNSs, Duffy | Agglutination with antisera |
| Leucocyte antigens | Most body cells | HLA | Lymphocytotoxicity; now DNA typing |
| Serum proteins | Plasma | Haptoglobin, transferrin, Gm | Electrophoresis |
| Red cell enzymes | Inside red cells | G6PD, adenylate kinase | Enzyme assays |
| Haemoglobin variants | Inside red cells | HbS, HbE, HbD | Electrophoresis; HPLC |
| DNA markers (today) | Every cell | SNPs, STRs, mtDNA | Sequencing; PCR |
The table shows a movement inward, from the cell surface to plasma, enzymes and finally DNA, each step revealing more variation. The classical markers were mapped by William Boyd (Genetics and the Races of Man, 1950), Arthur Mourant (The Distribution of the Human Blood Groups, 1954) and Luigi Luca Cavalli-Sforza (The History and Geography of Human Genes, 1994), and they carried the shift from race typology to population genetics (Unit 9.5).
“Age, sex and population variation.” A good marker varies between populations but hardly with age or sex; a physiological characteristic such as haemoglobin varies with all three, and with diet and income too.
Common confusion
Is haemoglobin level a genetic marker like a blood group? No. A blood group is set by one gene for life. Haemoglobin level is multifactorial: genes set a range, but age, sex, altitude, iron, infection and pregnancy move it. The haemoglobin type (HbA, HbS, HbE) is a marker; the level is a physiological characteristic.
2. Red Cell Antigens: ABO and Rh
In simple words
Red blood cells carry inherited chemical labels on their surface. If blood with the wrong label is given in a transfusion, the receiver’s antibodies attack it. The ABO and Rh labels matter most for medicine and are the best studied for comparing populations.
2.1 The ABO system
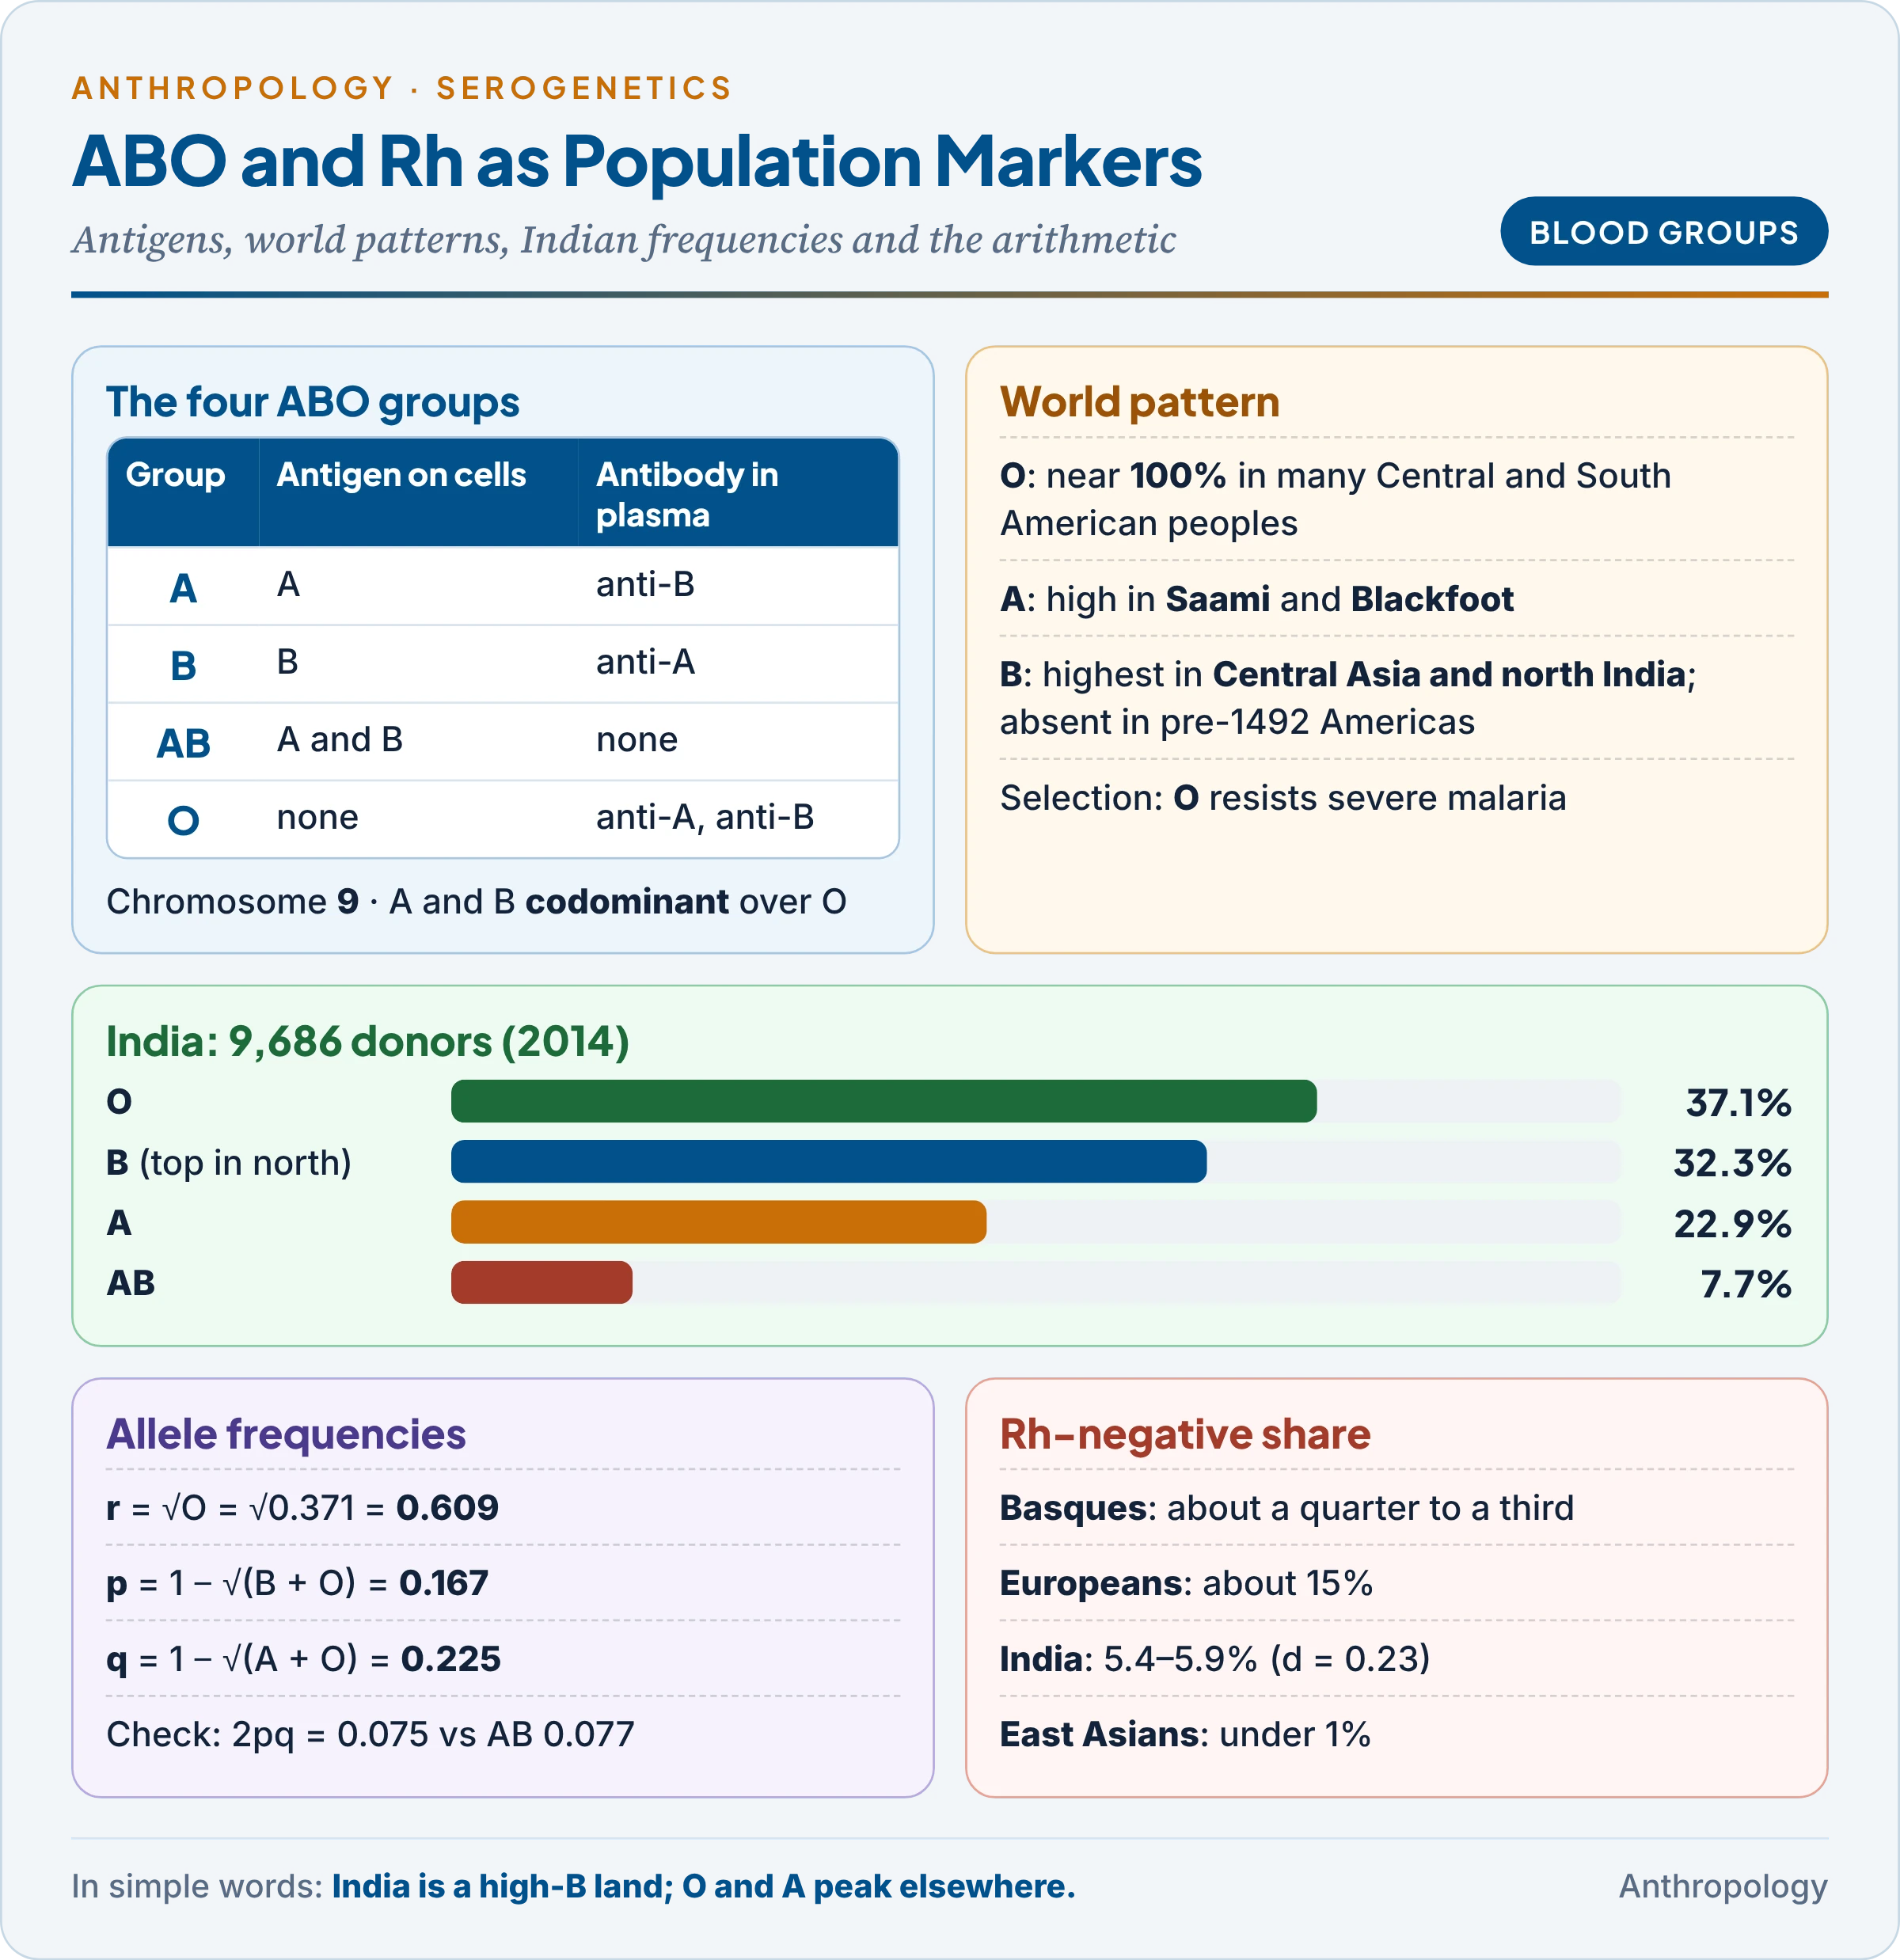
Discovery and mechanism. The Austrian physician Karl Landsteiner mixed one person’s red cells with another’s serum (1900–01) and saw that some mixtures agglutinated (clumped). He named groups A, B and O (AB followed in 1902) and received the Nobel Prize in 1930. Group A cells carry antigen A (a molecule the immune system recognises) and the plasma carries anti-B; B is the reverse; O has no antigen but both antibodies; AB has both antigens and no antibody. The antibodies are “natural“: they form in infancy after exposure to A- and B-like sugars on gut bacteria, which is why even a first wrong transfusion can kill.
| Group | Antigen on red cells | Antibody in plasma | Genotypes |
|---|---|---|---|
| A | A | Anti-B | AA, AO |
| B | B | Anti-A | BB, BO |
| AB | A and B | None | AB |
| O | None (H substance only) | Anti-A and anti-B | OO |
Genetics in brief (crosses in Unit 9.2): one gene on chromosome 9, three alleles (Iᴬ, Iᴮ, i), six genotypes and four phenotypes; A and B codominant, both dominant over O. Secretors also release A or B substance in saliva. The Bombay phenotype (hh) is explained in Unit 9.2.
Age and sex variation. A and B antigens are weak at birth and reach adult strength in early childhood; anti-A and anti-B appear in the first months of life and decline in old age. Being autosomal, ABO shows no sex difference.
World distribution (Mourant’s maps):
- O is commonest worldwide and reaches near 100 per cent in many Indigenous peoples of Central and South America.
- A is highest among some northern Europeans, the Saami (Lapps) and North American peoples such as the Blackfoot.
- B is highest in Central Asia and northern India, falls westward into Europe, and was absent in the Americas before 1492.
Indian data. A study of 9,686 donors in five regions (Amit Agrawal and colleagues, 2014) found O 37.1, B 32.3, A 22.9 and AB 7.7 per cent, with B the commonest group in the north; a 2020 review of over 14 lakh donors gave the same order. India is one of the world’s high-B regions, as the Hirszfelds first saw.
Why frequencies differ: history and selection. Early workers read ABO maps as records of migration alone; disease selection also acts.
- Group O and severe malaria: in Mali, group O children were 66 per cent less likely to develop severe falciparum malaria, because parasites form fewer “rosettes” (clumps of cells that block small vessels) in O cells (J. Alexandra Rowe and colleagues, PNAS, 2007). This may explain high O in malarial regions.
- Group A and stomach cancer: about 19 per cent higher risk in a meta-analysis of 40 studies (2019), a link first reported by Ian Aird in Britain in 1953. The low O frequency of the cholera-prone Ganges delta is discussed in Unit 9.3.
2.2 The Rh system
Discovery. In 1940 Landsteiner and Alexander Wiener injected rabbits with rhesus monkey blood; the serum agglutinated the cells of about 85 per cent of white New Yorkers, called Rh-positive. A year earlier Philip Levine and Rufus Stetson had traced a stillbirth to the same antibody.
Genetics. Two neighbouring genes on chromosome 1: RHD (the D antigen) and RHCE (C/c, E/e). Rh-negative people mostly lack the gene RHD altogether, so “d” is an absence, not an antigen. The older Fisher–Race notation (three linked loci, giving combinations such as CDe or cde) and Wiener‘s single-locus notation (R¹, R², r) both survive in textbooks. In practice people are typed only as D-positive or D-negative, because D is the most strongly immunogenic antigen.
Distribution. About 15 per cent of Europeans are Rh-negative, and the Basques have the world’s highest share, roughly a quarter to a third; East Asians and Indigenous Americans are under 1 per cent; India is 5.4 to 5.9 per cent (regional range 4.8 to 7.0).
Rh incompatibility. An Rh-negative mother carrying an Rh-positive foetus is sensitised when foetal cells enter her blood at delivery. In a later pregnancy her IgG anti-D crosses the placenta and destroys foetal red cells: haemolytic disease of the foetus and newborn (erythroblastosis foetalis), with anaemia, jaundice or stillbirth.
- Prevention: an anti-D injection within 72 hours of delivery (from the 1960s) clears foetal cells before the mother makes antibodies.
- Genetic meaning: the damage falls on heterozygous (Dd) babies. Selection against heterozygotes gives an unstable equilibrium (Unit 9.3), so the high frequency of both D and d in Europe points to past mixture of populations.
- ABO protects: if mother and foetus are also ABO-incompatible, her anti-A or anti-B destroys foetal cells before they can sensitise her to D.
2.3 Disputed paternity
Blood groups settled paternity disputes by exclusion: they can show that a man is not the father, never prove that he is.
- First-order exclusion: the child has an antigen that neither parent shows. Mother O, child B, alleged father A: the B must come from the father, so he is excluded.
- Second-order exclusion: the alleged father must pass on something the child lacks. Mother A, child O, alleged father AB: an AB man gives A or B to every child, so he is excluded.
| Mother | Child | Alleged father | Verdict |
|---|---|---|---|
| O | B | A | Excluded (B must come from the father) |
| A | O | AB | Excluded (an AB father cannot give O) |
| A | AB | B | Not excluded (he could give B) |
| O | O | A | Not excluded (an AO father gives O half the time) |
ABO alone excludes only a minority of wrongly accused men, because the common groups are widely shared. Adding Rh, MN, HLA and serum proteins raised the combined chance of exclusion above 90 per cent; today DNA short tandem repeats settle cases almost with certainty (Unit 9.1 and Unit 12).
3. The HLA System
In simple words
HLA molecules are the body’s identity cards. They sit on almost every cell and show fragments of proteins to the immune system, which decides whether the cell is “self” or an invader. Because people differ so much in HLA type, an organ from a stranger is usually rejected.
An example first. When a child with thalassaemia needs a bone-marrow transplant, doctors test the brothers and sisters first. A sibling has a one-in-four chance of a perfect match, because each parent passes on one of two HLA haplotypes (blocks of linked genes inherited together). Unrelated donors match far less often, which is why donor registries list millions of volunteers.
Discovery. The French immunologist Jean Dausset described the first human leucocyte antigen in 1958 and shared the 1980 Nobel Prize with George Snell (the mouse H-2 system) and Baruj Benacerraf. These genes form the major histocompatibility complex (MHC).
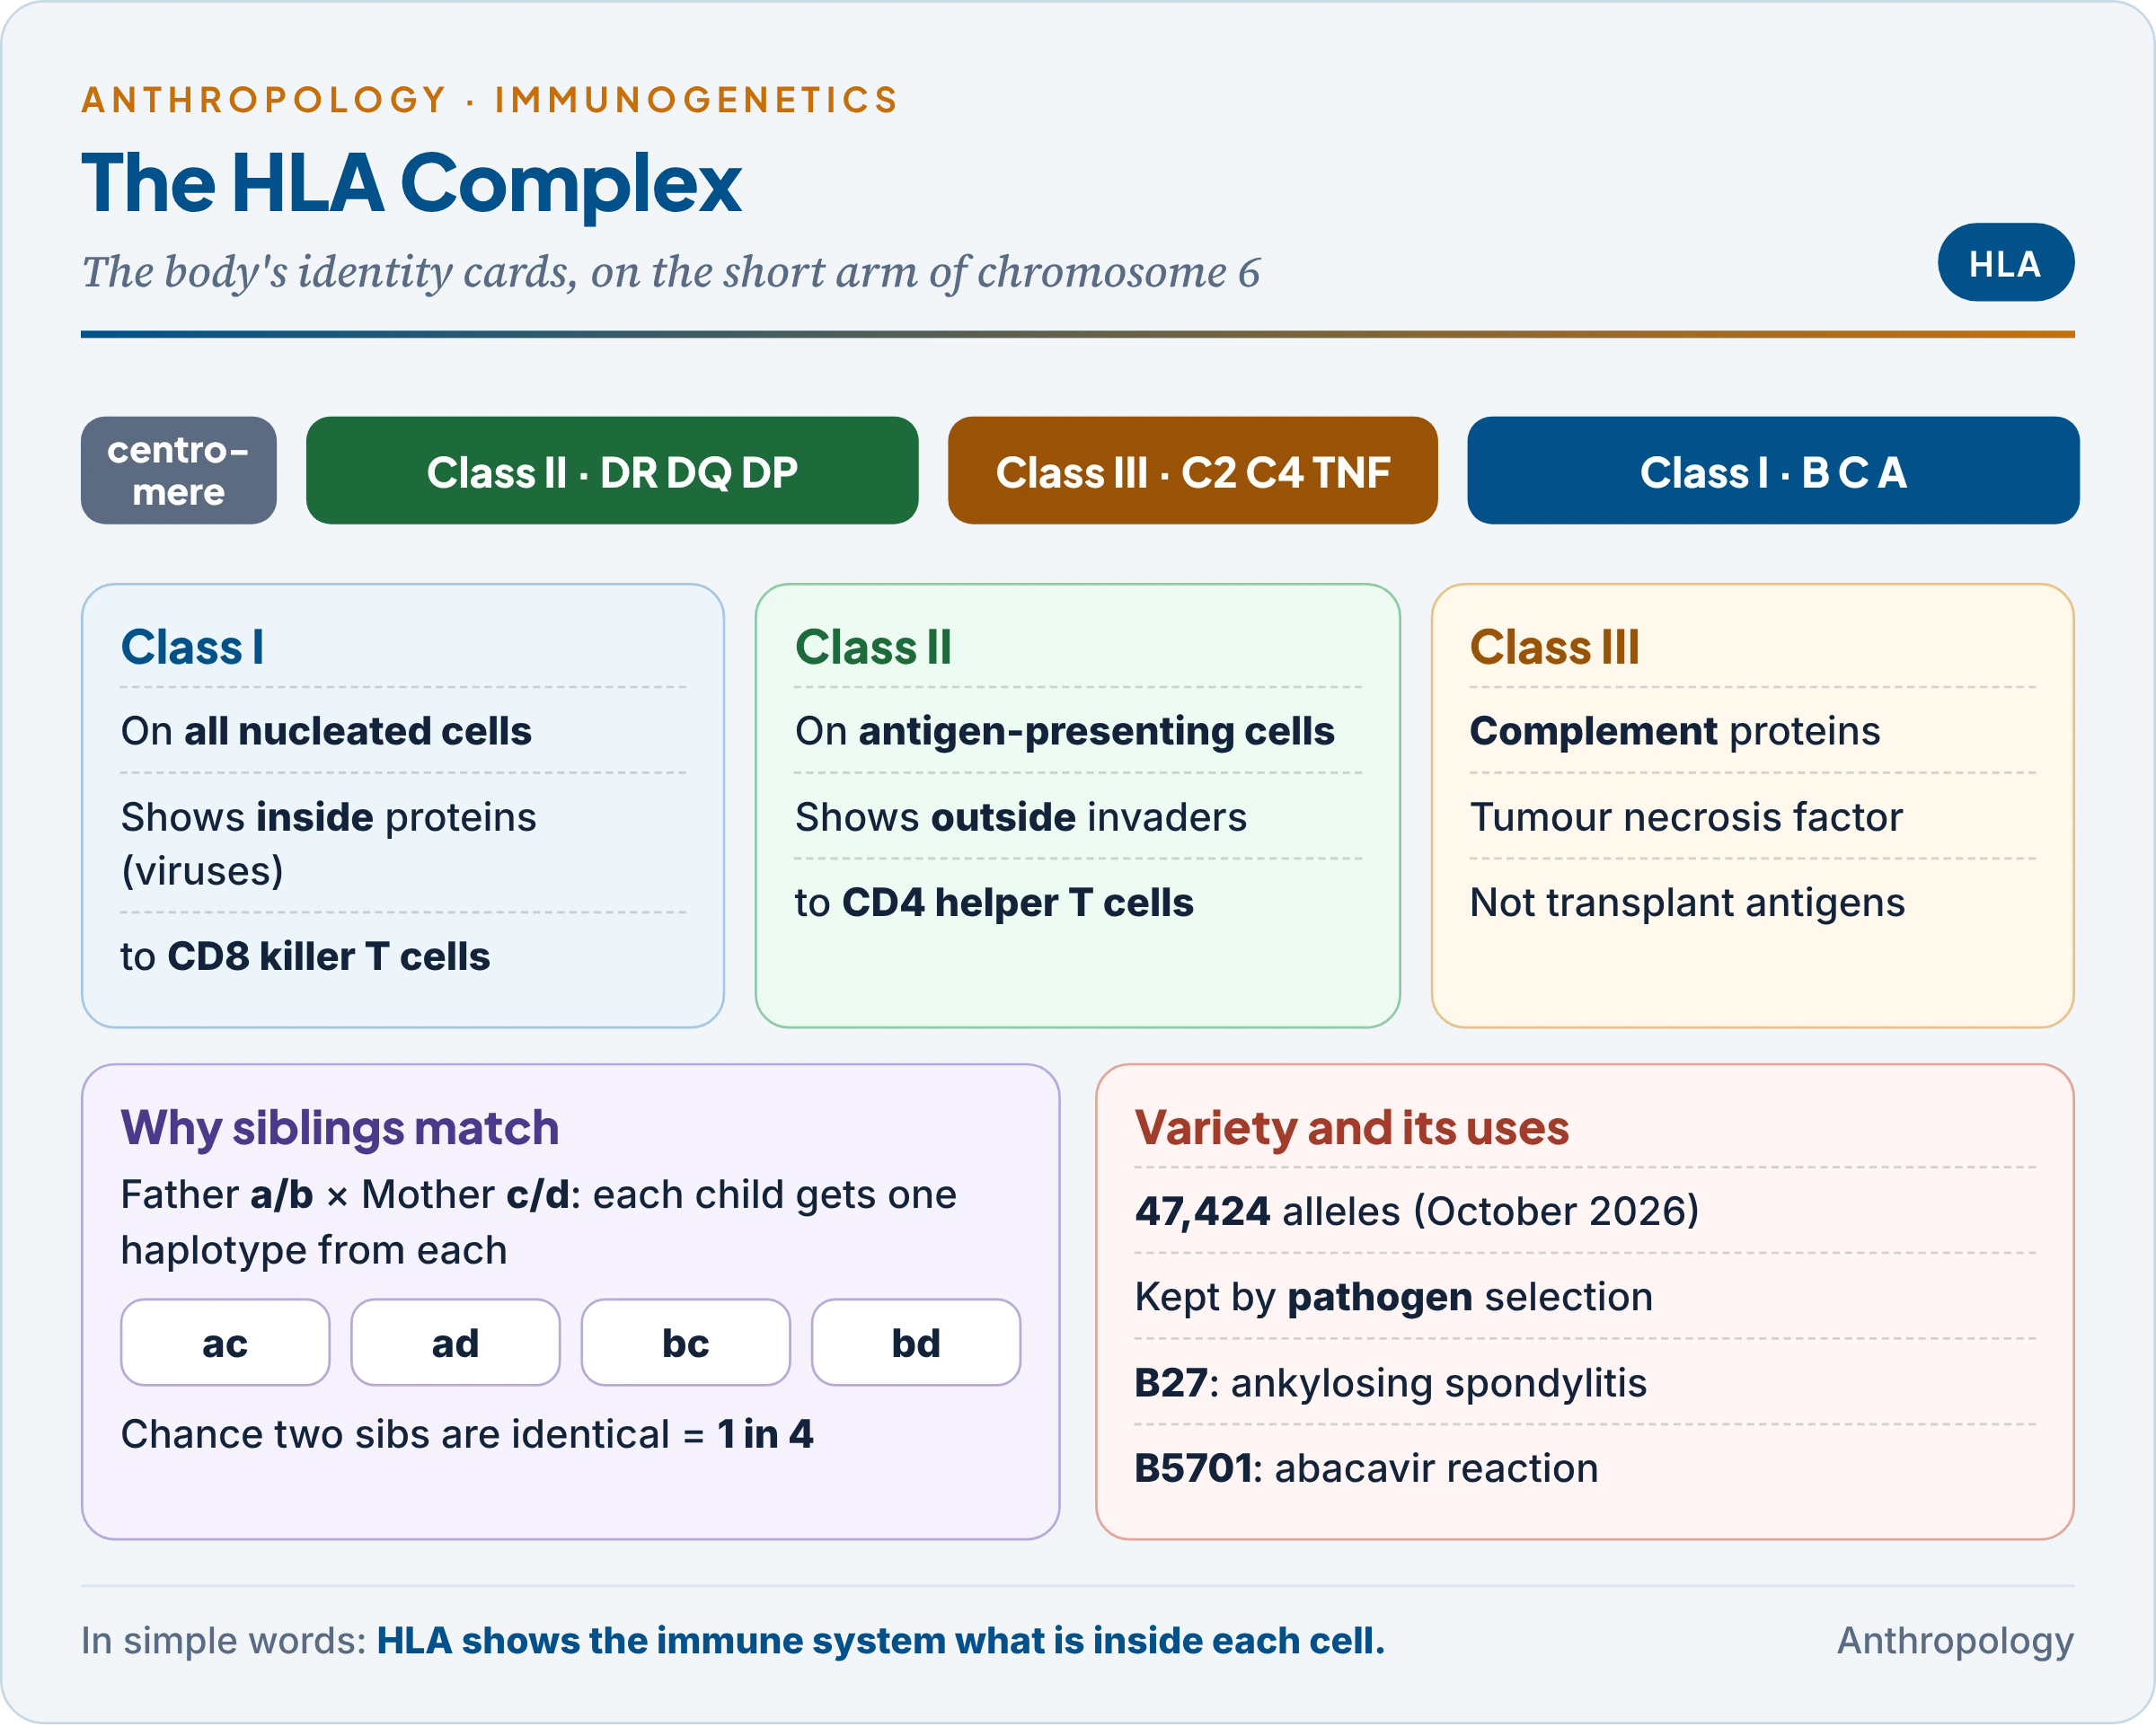
Structure. The complex lies on the short arm of chromosome 6:
- Class I (HLA-A, -B, -C): on almost all nucleated cells; show fragments of proteins made inside the cell (such as viral proteins) to CD8 killer T cells.
- Class II (HLA-DR, -DQ, -DP): on antigen-presenting cells; show fragments of outside invaders to CD4 helper T cells.
- Class III: genes for complement proteins and tumour necrosis factor; not transplantation antigens.
The most polymorphic system known. The international database listed 47,424 alleles in October 2026, about 46,000 of them HLA, over 11,000 at HLA-B alone. Both haplotypes are expressed (codominance), and some allele combinations travel together more often than chance (linkage disequilibrium), such as A1–B8–DR3 in northern Europe.
Why so much variety? Each HLA type can display only some pathogen fragments. Heterozygotes display more, and a rare type is one that local pathogens have not yet learnt to evade. This balancing selection (Unit 9.3) keeps thousands of alleles alive. In the Gambia, HLA-B53 was linked to protection from severe malaria (Adrian Hill and colleagues, Nature, 1991).
Uses.
- Transplantation: matching reduces rejection. Grafts are autografts (own tissue), isografts (identical twin), allografts (another person) or xenografts (another species); mismatched grafts need immunosuppressive drugs.
- Disease association and drug safety: about 90 per cent of patients with ankylosing spondylitis carry HLA-B27; HLA-DQ2/DQ8 underlie coeliac disease; HLA-B5701 predicts a dangerous reaction to the HIV drug abacavir, and HLA-B1502 a severe skin reaction to carbamazepine in many East and South-East Asians. HLA testing is thus part of pharmacogenetics (tailoring drugs to genotype).
- Population affinity and paternity: haplotype frequencies trace migrations; before DNA, HLA raised paternity exclusion rates sharply.
How HLA differs from red cell antigen systems. The last two rows carry the deepest difference.
| Feature | Red cell systems (ABO, Rh) | HLA system |
|---|---|---|
| Cells | Red cells only | Almost all nucleated cells |
| Chromosome | ABO on 9; Rh on 1 | Short arm of 6 |
| Genetic structure | One or two loci, few alleles | Many linked loci, tens of thousands of alleles, haplotypes |
| Antibodies | ABO natural; anti-D after exposure | Only after pregnancy, transfusion or transplant |
| Testing | Agglutination | Lymphocytotoxicity; now DNA typing |
| Clinical role | Transfusion; Rh disease | Transplantation; disease and drug associations |
| Function | Not essential (O and Rh-null people are healthy) | Essential: presents antigens to T cells |
HLA is far more informative because its variety is enormous and exists for a reason, the fight against infection. A blood group is mainly a label; an HLA type is a working part of the immune system.
4. Serum Proteins: Haptoglobin, Transferrin and Gm
In simple words
The liquid part of blood carries many proteins, and several exist in slightly different inherited forms. In a gel under an electric current the forms move at different speeds and can be told apart. Their frequencies differ between populations.
The method. In 1955 Oliver Smithies separated serum proteins by starch-gel electrophoresis (moving charged molecules through a gel in an electric field). A change of even one amino acid alters a protein’s charge and speed, so hidden variants appeared as different band patterns.
4.1 Haptoglobin (Hp)
- Function: a liver protein that binds free haemoglobin from broken red cells, so that it is cleared without losing iron or damaging the kidneys.
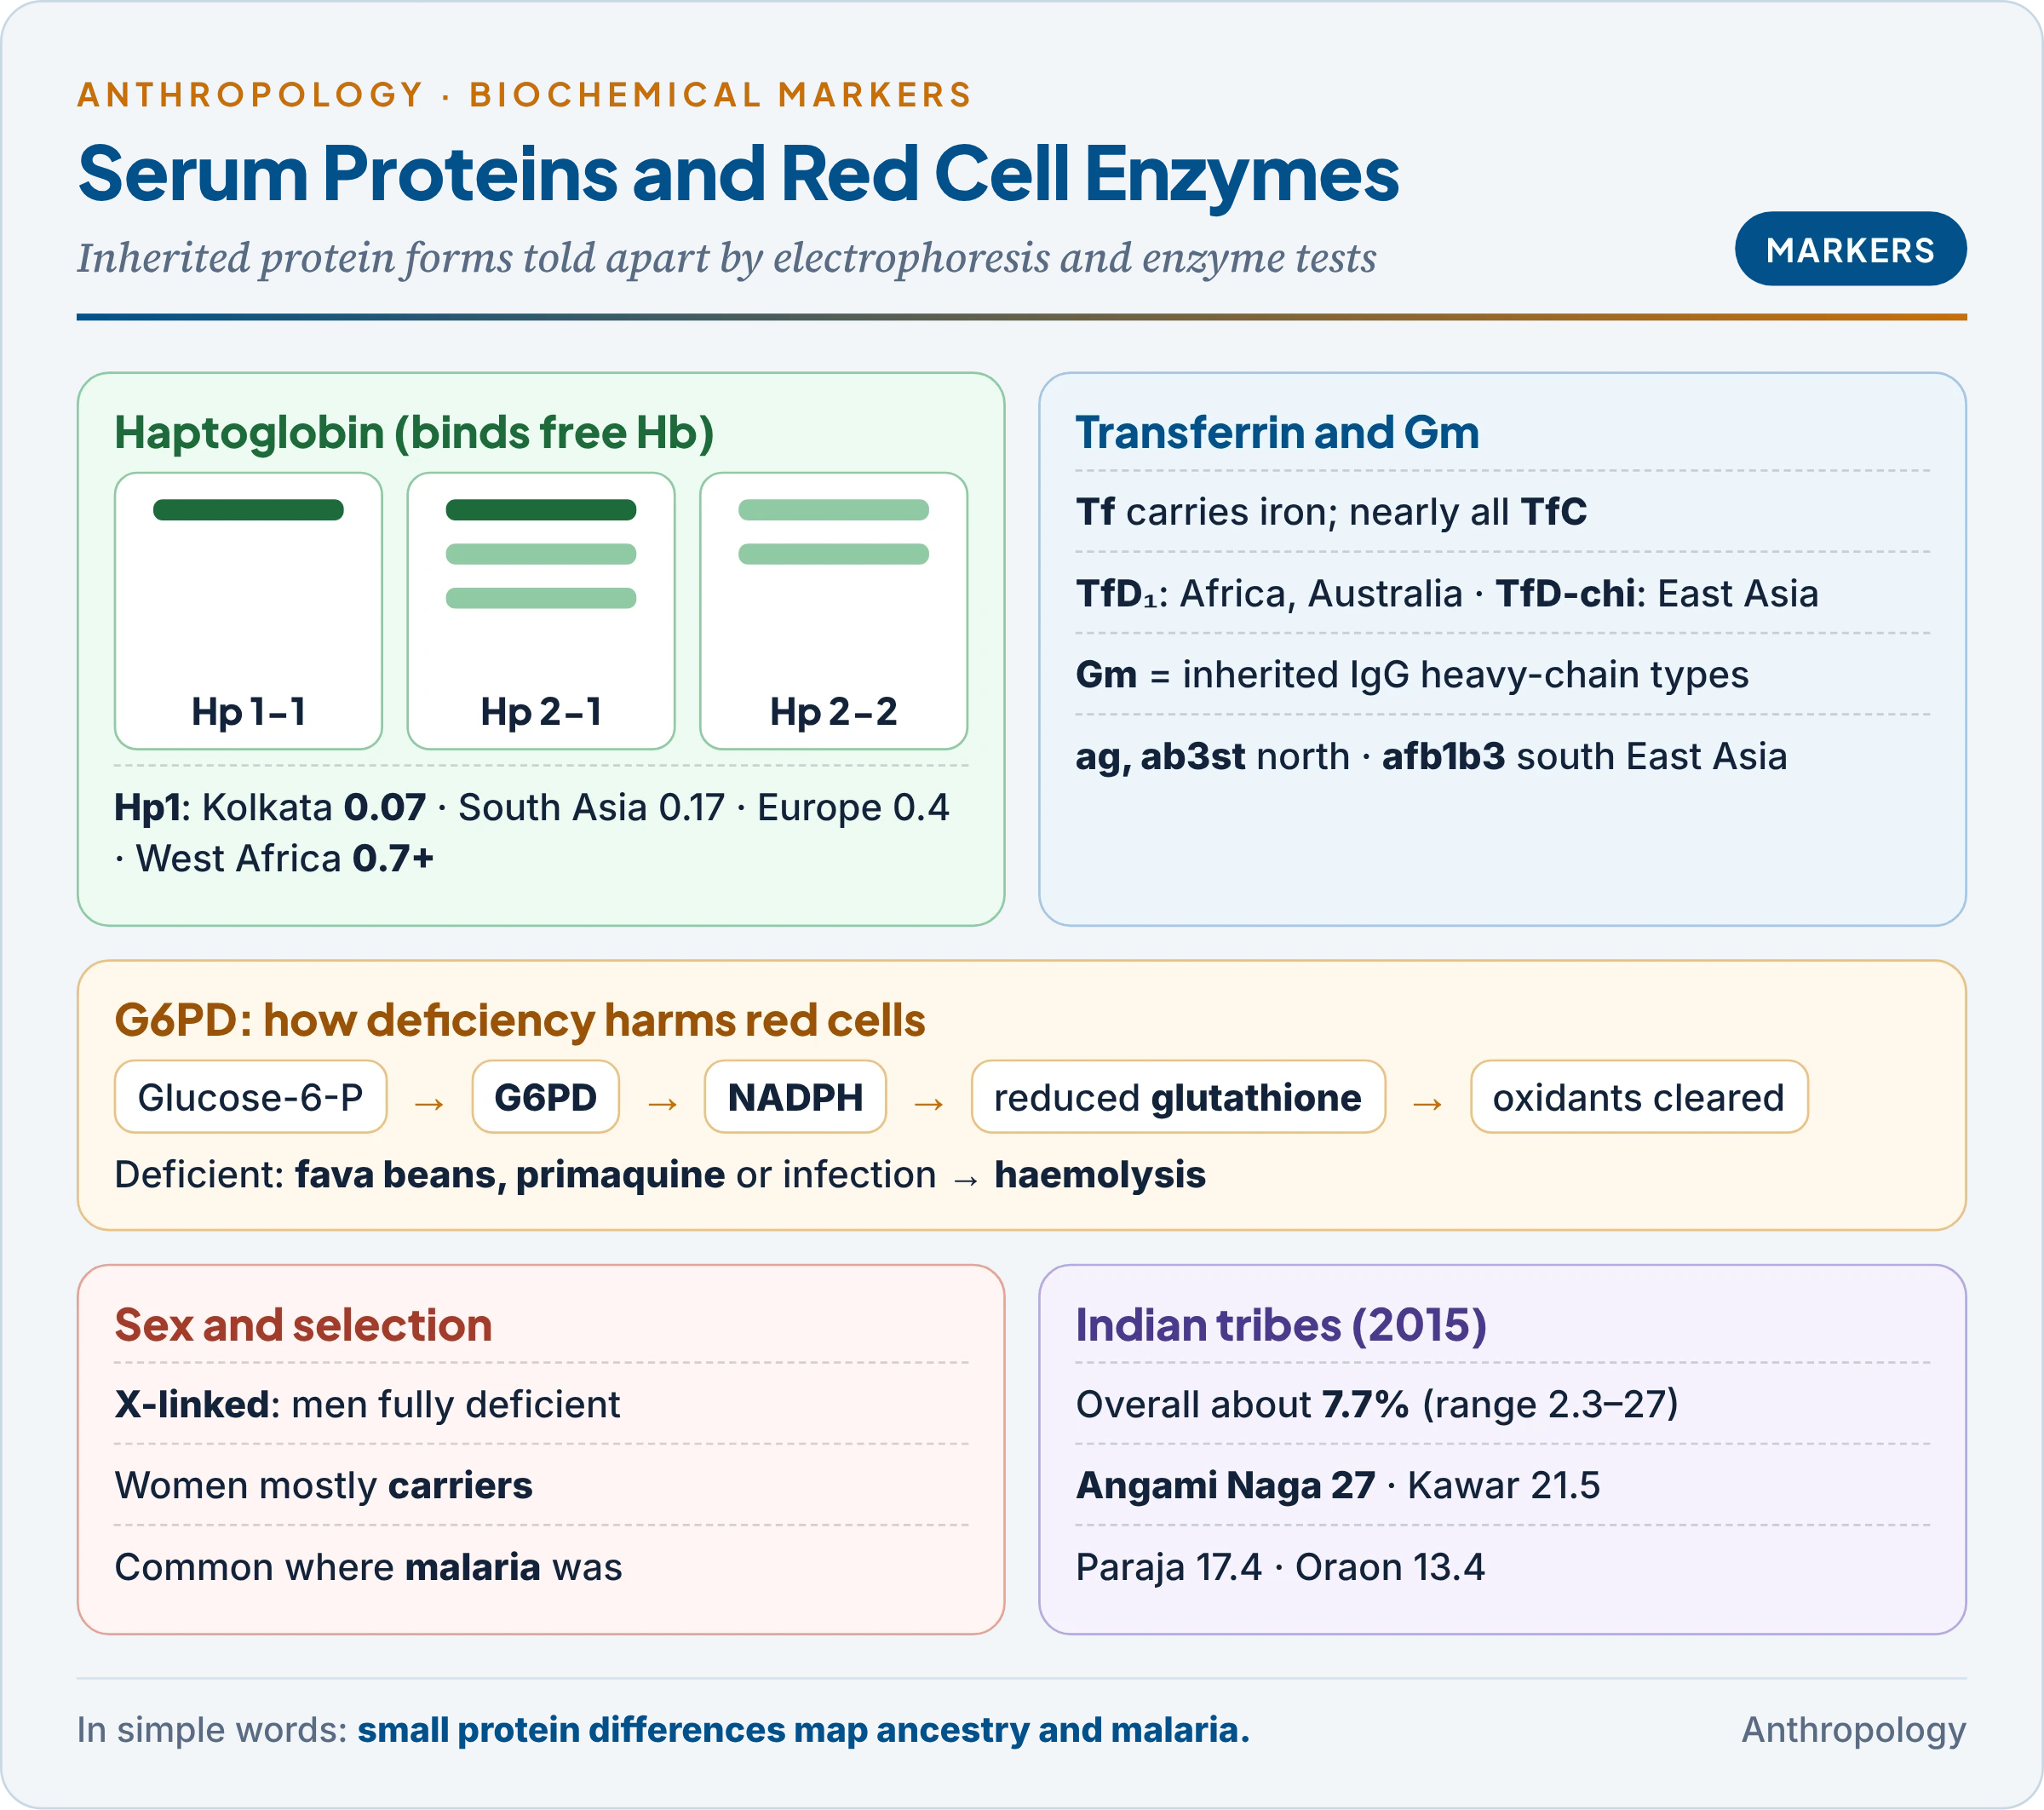
- Genetics: two alleles, Hp1 and Hp2 (Hp2 arose by a partial duplication), giving Hp 1-1, 2-1 and 2-2 (Smithies, 1955); Hp 2-2 binds haemoglobin least well.
- Hp 0 (absent haptoglobin) is common in West Africa, largely because malarial haemolysis uses it up.
- World cline: Hp1 frequency runs from about 0.07 in Kolkata (the lowest recorded) and 0.17 across South Asia, through about 0.4 in Europe, to over 0.7 in parts of West Africa and South America (Carter and Worwood, 2007). South Asians carry mostly Hp2, one of the clearest genetic features of the subcontinent; the cause of the cline is unknown.
4.2 Transferrin (Tf)
- Function: a beta-globulin that carries iron to the bone marrow for new red cells and to the liver for storage.
- Variants: nearly everyone has TfC; rare faster TfB and slower TfD variants act as tracers of ancestry: TfD₁ in Africans, Aboriginal Australians and Melanesians, TfD-chi in Chinese and other East and South-East Asians.
4.3 Gm allotypes of immunoglobulin G
- What Gm is: IgG, the main antibody of blood, has heavy chains that carry small inherited differences called Gm allotypes (an allotype is an inherited variant of a protein within a species). Rune Grubb found the first in 1956.
- Why powerful: Gm factors are inherited in fixed combinations (haplotypes), some almost confined to one region. The Japanese geneticist Hideo Matsumoto, typing 130 East Asian and American populations, showed that Gm ag and ab3st mark northern East Asians (highest among the Buryat of Lake Baikal, and found in Tibetans) and Gm afb1b3 marks southern ones, while ab3st reached Indians, Iranians and Uyghurs only through gene flow. One haplotype thus records an ancient migration.
- IgG in health: IgG alone crosses the placenta, giving the newborn passive immunity; the anti-D injection is itself IgG.
Common confusion
Is Gm the same as an antibody against a disease? No. Gm is an inherited variation in the structure of the IgG molecule, whatever the antibody is aimed at. A person’s anti-measles and anti-tetanus antibodies carry the same Gm types, which is why Gm behaves like a blood group: fixed for life and Mendelian.
5. Red Cell Enzymes and Haemoglobin
In simple words
Red cells contain enzymes and haemoglobin whose inherited forms differ between people. Some forms cause illness with certain foods or drugs but protect against malaria. That is why they are common where malaria was common, including much of tribal India.
5.1 G6PD deficiency
An example first. India treats Plasmodium vivax malaria with primaquine, which kills the parasite’s dormant liver stage. In a person with G6PD deficiency the same drug can destroy red cells. A review of 72 tribal groups in 16 states found deficiency in 2.3 to 27 per cent (overall about 7.7 per cent), high among the Angami Naga (27.0), Kawar (21.5), Gond (13–21), Paraja (17.4), Juang (15.6) and Oraon (13.4) (Mukherjee and colleagues, 2015). Some four million tribal men are estimated to be deficient.
How it works.
- G6PD (glucose-6-phosphate dehydrogenase) starts the pentose phosphate pathway, the red cell’s only source of NADPH, which keeps glutathione in the reduced form that mops up oxidants.
- Without it, oxidising stress from fava beans (favism), primaquine, sulphonamides or infection damages haemoglobin and membranes: haemolytic anaemia (destruction of red cells).
- X-linked: a man with one deficient allele is fully deficient; women are usually heterozygous mosaics with intermediate activity. Deficiency is therefore much commoner in men, a clear sex variation in a marker.
Variants and selection. Normal Gd B; Gd A− in Africa; severe Gd Mediterranean in southern Europe, West Asia and India; G6PD Orissa is common in Indian tribes. About 60 per cent of Kurdish Jewish men are deficient. Worldwide over 400 million people are deficient, almost all where falciparum malaria was endemic, because parasites grow poorly in deficient cells: a balanced polymorphism like sickle-cell (Unit 9.3).
Other enzymes. Adenylate kinase, phosphoglucomutase and acid phosphatase have common electrophoretic forms; typed with blood groups in the 1960s–80s, they showed that Indian castes and tribes living side by side differ genetically, as expected of endogamous groups.
5.2 Haemoglobin in health and disease
- Structure: four globin chains, each with an iron-containing haem that binds oxygen. Adult HbA is α₂β₂ (about 97 per cent), HbA₂ (α₂δ₂) about 2.5 per cent. Foetal HbF (α₂γ₂) holds oxygen more tightly, letting the foetus draw oxygen from the mother, and is replaced by HbA in the first months of life.
- Qualitative variants: HbS (valine for glutamic acid at position 6 of the β chain; cells sickle in the double dose), common in the central Indian tribal belt and kept by malaria (Unit 9.3); HbE in north-east India; HbD-Punjab in the Punjab.
- Thalassaemias: too little α or β chain is made; a child with two defective β genes needs lifelong transfusion.
- Low level (anaemia): in India mostly acquired (iron deficiency, worms, malaria), not inherited (§6.1).
6. Physiological Characteristics in Different Groups
In simple words
Haemoglobin, body fat, pulse, lung capacity and the senses are shaped partly by genes and partly by how and where people live. They change as we grow up and grow old, differ between men and women, and differ between rich and poor, rural and urban, highland and lowland groups.
These traits are multifactorial. Comparing them across groups shows how biology responds to culture and inequality, a theme continued in Unit 9.7.
6.1 Haemoglobin level
Age and sex. Newborns have high values (about 15–20 g/dL, mostly HbF), falling to a low at 2–3 months as foetal cells die. Values rise in childhood and diverge at puberty: testosterone stimulates red cell production in boys, while menstrual loss drains iron in girls (a large US survey: 15.3 g/dL in men, 13.4 in women). Pregnancy dilutes the blood; old age brings a slow fall. The WHO (2024) defines anaemia below 13 g/dL in men, 12 in non-pregnant women and 11 in children aged 2–5.
Population and environment. Haemoglobin rises with altitude in lowlanders and Andean natives, but Tibetan-ancestry highlanders, Ladakhis included, keep sea-level values (Unit 9.7). The WHO therefore raises the cut-off with altitude (by 2.5 g/dL at 3,500–3,999 m) and for smokers.
Culture and socio-economic status.
- NFHS-5 (2019–21): 57.0 per cent of women aged 15–49, 25.0 per cent of men and 67.1 per cent of children aged 6–59 months were anaemic; 61.6 per cent of Scheduled Tribe women in Rajasthan.
- Why: mainly vegetarian diets with poorly absorbed non-haem iron, tea with meals (which blocks absorption), hookworm and malaria, repeated pregnancies, and unequal food sharing that disadvantages women and girls: cultural and economic causes acting on a biological trait.
- Ladakh: NFHS-5 recorded 92.8 per cent of women as anaemic, India’s highest. Winter diets are poor, but the WHO notes that its adjustments above 3,000 m rest mainly on Andean data and that ancestry-specific adjustments may be needed; for a low-haemoglobin Tibetan-ancestry population, an Andean-based cut-off may overstate anaemia.
6.2 Body fat
- Kinds: subcutaneous (under the skin), visceral (around organs, more harmful to the heart), essential and storage fat. Brown fat, which burns energy to make heat, is abundant in infants and was shown in 2009 to stay active in many adults, especially in the cold.
- Measurement: skinfold callipers, bioelectrical impedance, DXA scans; the BMI (weight in kg / height in m²) is only indirect.
- Age: fat is laid down in the last trimester, peaks in infancy, falls, and rises again at about 5–7 years (the “adiposity rebound“; an early rebound predicts obesity). At puberty girls gain fat and boys muscle.
- Sex: women carry more fat at the same BMI, including essential fat in breasts and hips needed for reproduction; men store more visceral fat.
- Population: steatopygia (heavy fat on the buttocks) among Khoisan women; the “thin-fat Indian baby“, small but with preserved skinfolds (Chittaranjan Yajnik and colleagues, Pune, 2003). In “The Y-Y paradox” (The Lancet, 2004) Yajnik and John Yudkin showed two men of the same BMI, the Indian with far more fat, which is why India’s 2009 guidelines use lower BMI cut-offs (overweight from 23, obese from 25).
- Culture and socio-economic status: more food energy and less physical work with modernisation raise fat (as among migrant Samoans and urban Indians), while undernutrition persists among the poor: the “double burden” of malnutrition.
6.3 Pulse rate and blood pressure
- Pulse: heartbeats per minute; adults 60–100, newborns 100–160, children aged 1–10 70–120, trained athletes 40–60 (a stronger heart pumps more per beat). Women average a few beats faster. On arrival at altitude the pulse rises to deliver oxygen, then settles.
- Blood pressure: systolic (heart contracting) over diastolic (heart relaxing); the American Heart Association’s 2017 guideline labels 130/80 mmHg and above as hypertension.
- INTERSALT (1988): among 10,079 people in 52 centres, urinary sodium ranged from 0.2 mmol/day among the Yanomami of Brazil to 242 in north China. The Yanomami averaged about 96/61, with no hypertension and no rise of pressure with age. The rise with age once thought “normal ageing” is therefore partly a product of salt, weight and way of life.
- India: NFHS-5 found elevated blood pressure in about 21 per cent of women and 24 per cent of men aged 15 and above.
6.4 Respiratory functions
- Functions: gas exchange in the alveoli, keeping arterial PCO₂ near 40 mmHg, and regulating blood pH.
- Measures: a spirometer records vital capacity (the largest breath one can expel, about 4.5 litres in a young man), FVC and FEV₁ (volume in the first second); VO₂max measures aerobic fitness.
- Age and sex: lung function peaks at 20–25 years and then declines; men’s volumes are larger, in proportion to larger chests.
- Population: the Global Lung Function Initiative (2012) found FVC 12–16 per cent lower in South-East Asians than in Europeans of the same age, height and sex. It could not derive Indian equations because Indian data sets disagreed, a variation it linked to socio-economic differences in growth. In 2023 the American Thoracic Society adopted race-neutral equations so that a lower norm is not mistaken for fixed biology. Highlanders have larger lungs or higher ventilation (Unit 9.7).
- Culture and socio-economic status: biomass cooking smoke, occupational dust (silicosis in stone quarries), tobacco and air pollution reduce lung function, while training raises VO₂max.
6.5 Sensory perceptions
- Receptors: mechanoreceptors (touch), photoreceptors (sight), phonoreceptors (hearing), gustatory (taste) and olfactory (smell).
- PTC tasting: in 1931 the chemist Arthur Fox found that some people taste phenylthiocarbamide as intensely bitter and others not at all. Tasting is dominant; the main gene, TAS2R38, was identified in 2003. Non-taster frequencies vary widely between populations.
- Red–green colour blindness: X-linked, affecting about 8 per cent of European men but 0.5 per cent of women. It is rarer among some foraging peoples; Richard Post (1962) argued that hunting life selected against it and settled life relaxed the selection.
- Age: presbyopia (loss of near focus after about 40), presbycusis (loss of high tones), and declining taste and smell.
- Culture and socio-economic status: myopia rises among urban schoolchildren with near work and little time outdoors; noise-induced deafness affects factory workers; night blindness from vitamin A deficiency affects poor children. Perception itself is trained: Marshall Segall, Donald Campbell and Melville Herskovits (1960s) found that people raised in “carpentered” worlds of right-angled buildings were more prone to the Müller-Lyer illusion than those raised in round huts.
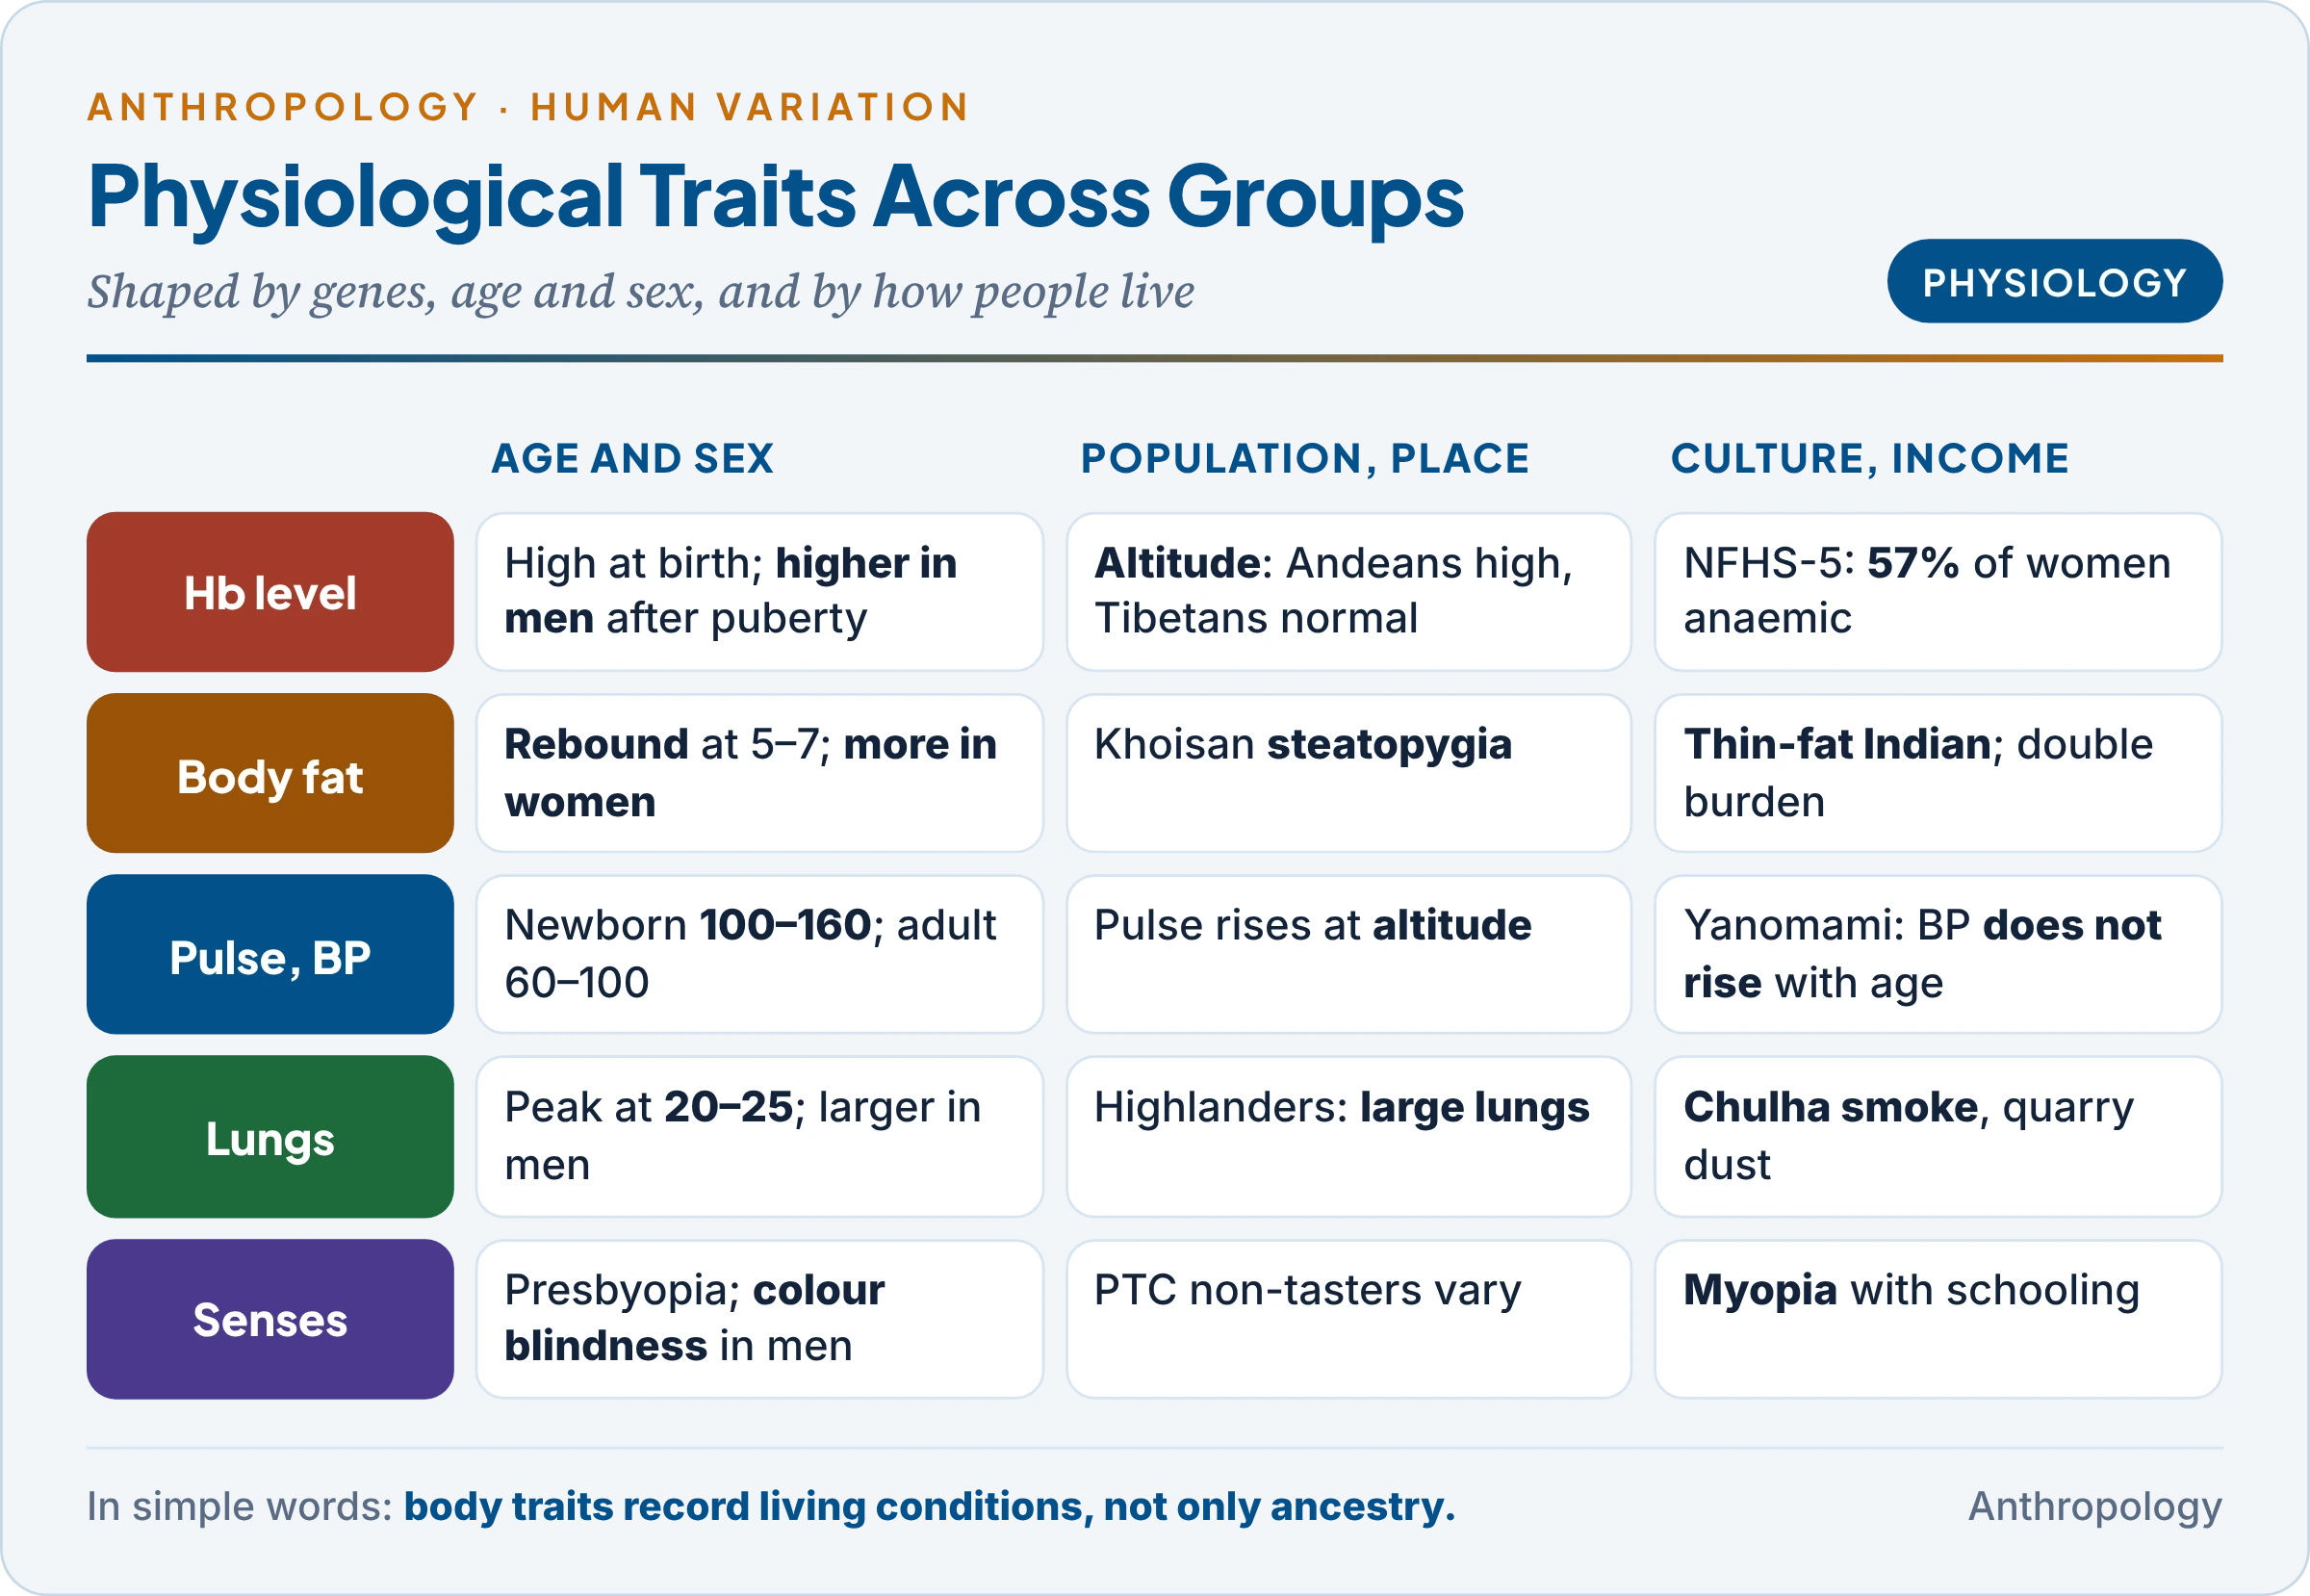
The table sets each trait against age, sex and social group.
| Trait | Age | Sex | Population or environment | Culture and socio-economic status |
|---|---|---|---|---|
| Hb level | High at birth, dip at 2–3 months | Higher in men | Altitude; smoking | Diet, worms, pregnancies; 57% of women anaemic |
| Body fat | Adiposity rebound at 5–7 | More in women | Steatopygia; thin-fat Indian | Modernisation; double burden |
| Pulse and BP | Pulse falls from newborn levels | Women slightly faster | Altitude raises pulse | INTERSALT: no rise with age among Yanomami |
| Respiration | Peak at 20–25 | Larger in men | Highlanders’ large lungs | Biomass smoke, dust, childhood poverty |
| Senses | Presbyopia, presbycusis | Colour blindness in men | PTC non-tasters vary | Myopia with schooling; carpentered world |
Unlike a blood group, every one of these traits changes through life and with living conditions. Their population differences record environment and inequality as much as ancestry, and cannot be read as fixed racial differences.
7. Uses of Genetic Markers
In simple words
Markers answer three kinds of question: how closely two populations are related, why some people fall ill with a disease and others do not, and to whom a person or a blood stain belongs.
The table groups the uses; the bullets below explain the reasoning behind each.
| Use | How the marker is used | Example |
|---|---|---|
| Population affinity | Compare allele frequencies; compute genetic distances | High B and low Hp1 in South Asia; Gm north–south split in East Asia |
| Disease association | Compare frequencies in patients and controls | HLA-B27 and ankylosing spondylitis; group O and severe malaria |
| Forensics and paternity | Exclude or match individuals | ABO, Rh, HLA exclusion; today STR profiles |
| Medicine | Match donors; prevent reactions | Transfusion, transplantation, anti-D, G6PD testing |
- Population affinity. Combining several independent markers clusters populations that share history. Classical markers first showed that Indian castes and tribes are distinct endogamous gene pools (Unit 9.3). A single marker can mislead (two high-B groups need not be related), so studies use many systems.
- Disease association. A marker commoner among patients either affects the disease itself (HLA presenting antigens) or lies near a gene that does (linkage disequilibrium). Such links also explain why markers are polymorphic: diseases select them.
- Caution about race. Boyd’s blood-group “races” gave way to the finding, made by the American geneticist Richard Lewontin with classical markers in 1972, that most variation lies within populations (Unit 9.5). Markers describe clines and populations, not fixed races.
8. Worked Examples
Example 1: ABO allele frequencies (square-root method). Indian donors: O = 0.3712, A = 0.2288, B = 0.3226, AB = 0.0774.
- Allele O: r = √O = √0.3712 = 0.609.
- Allele A: p = 1 − √(B + O) = 1 − √0.6938 = 1 − 0.833 = 0.167.
- Allele B: q = 1 − √(A + O) = 1 − √0.600 = 1 − 0.775 = 0.225.
- Check: p + q + r = 1.002 (published values 0.165, 0.225, 0.609). Expected AB = 2pq = 0.075, close to the observed 0.077, so the data fit Hardy–Weinberg expectations.
Example 2: Rh in India. 5.39 per cent of donors are Rh-negative (dd).
- d = √0.0539 = 0.232; D = 0.768.
- Carriers (Dd) = 2 × 0.768 × 0.232 = 0.356: over a third of Indians carry the hidden d gene.
- An Rh-negative woman married to an Rh-positive man occurs in about 0.054 × 0.946 = 5.1 per cent of random marriages.
Example 3: an X-linked marker. In a tribe 12 per cent of men are G6PD deficient.
- Men have one X, so the allele frequency q = 0.12.
- Deficient women = q² = 1.4 per cent; carrier women = 2pq = 2 × 0.88 × 0.12 = 21.1 per cent.
- Deficiency is about eight times commoner in men, and a survey of men gives the allele frequency directly.
Key Terms
| Term | Meaning in simple words |
|---|---|
| Genetic marker | An easily tested inherited trait with several common forms |
| Antigen | A molecule the immune system can recognise |
| Agglutination | Clumping of red cells when antibody meets antigen |
| Codominance | Both alleles of a heterozygote are visible |
| Rh-negative | Lacking the D antigen, usually because RHD is missing |
| HDFN | Destruction of a baby’s red cells by the mother’s anti-D |
| HLA | Cell-surface molecules that show protein fragments to T cells |
| Haplotype | A block of linked alleles inherited together |
| Allotype | An inherited variant of a protein, such as a Gm type of IgG |
| Electrophoresis | Separating proteins by their movement in an electric field |
| Haptoglobin | Plasma protein that binds free haemoglobin |
| Transferrin | Plasma protein that carries iron |
| G6PD deficiency | X-linked enzyme defect; red cells break down with some foods and drugs |
| Adiposity rebound | The second rise of body fat in childhood, at about 5–7 years |
| Vital capacity | The largest volume of air a person can breathe out |
| Paternity exclusion | Showing from markers that a man cannot be a child’s father |
Contemporary Developments
- Sickle-cell mission (October 2026): 7.33 crore people screened, 20.6 lakh carriers and 2.52 lakh patients identified under the mission launched on 1 July 2023 for people aged 0–40 in 17 states.
- WHO haemoglobin guideline (2024): new cut-offs (10.5 g/dL for children aged 6–23 months) and revised altitude and smoking adjustments, with a call for ancestry-specific adjustments above 2,500 m, relevant to Ladakh.
- HLA database (October 2026): 47,424 alleles in release 3.66.
- Race-neutral lung norms (2023): the American Thoracic Society replaced race-specific spirometry equations.
- G6PD and new malaria drugs: single-dose tafenoquine for vivax can be given only after a quantitative G6PD test, which matters most in tribal districts with high deficiency.
Diagrams to Master
- Topic map: marker definition → ABO and Rh → HLA → Hp, Tf, Gm → G6PD and haemoglobin → physiological traits → uses.
- ABO and Rh: antigen–antibody table; world pattern (O Americas, A Saami, B Central Asia and north India); India O > B > A > AB; square-root formulas; Rh-negative shares.
- HLA complex: chromosome 6 with class II, III, I; CD4 and CD8; sibling match 1 in 4; B27.
- Serum proteins and enzymes: Hp 1-1, 2-1, 2-2 and the Hp1 cline; Gm north–south; G6PD → NADPH → glutathione, X-linked.
- Physiological variation: five traits against age, sex, population and social group.
Revision Grid
| Scholar | Work (year) | Key idea |
|---|---|---|
| Karl Landsteiner | 1900–01; Nobel 1930 | ABO blood groups |
| Ludwik and Hanna Hirszfeld | The Lancet (1919) | First population study of blood groups |
| Arthur Fox | 1931 | PTC taste blindness |
| Landsteiner and Wiener | 1940 | Rh system |
| Arthur Mourant | The Distribution of the Human Blood Groups (1954) | World blood-group maps |
| Oliver Smithies | 1955 | Starch-gel electrophoresis; haptoglobin types |
| Rune Grubb | 1956 | Gm allotypes |
| Jean Dausset | 1958; Nobel 1980 | HLA antigens |
| Richard Post | 1962 | Relaxed selection on colour vision |
| Hideo Matsumoto | 1987 | Gm markers of northern and southern East Asians |
| INTERSALT Group | BMJ (1988) | Salt and the rise of blood pressure with age |
| Yajnik and Yudkin | “The Y-Y paradox” (2004) | Indians carry more fat at the same BMI |
| Rowe and colleagues | PNAS (2007) | Group O protects against severe malaria |
| Mukherjee and colleagues | 2015 | G6PD deficiency in 72 Indian tribes |
Previous Year Questions
Unit 9.6: Age, sex and population variation as genetic marker
- 2024Write notes on: Hemoglobin in health and disease.
- 2024Describe the genetics and inheritance patterns of the ABO and Rh blood groups in man.
- 2022What do you understand by blood group systems? How is HLA system different from those based on red cell antigens?
- 2016Write a note in 150 words on Rh-Blood Group.
- 2013What are genetic markers and what is their usefulness? Why are blood groups considered as good genetic markers? Illustrate with examples. (250 words).
- 2012Discuss the role of ABO blood group system in resolving cases of disputed paternity.
- 2012Give a comparative account of variations in hemoglobin level and respiratory functions among the populations living under different environmental stresses.
- 2011Write a note in 150 words on Respiratory functions.
- 2009Write a note on Genetics of HLA and organ transplantation.
- 2008Write a note on ABO and Rh blood group distribution in human populations.
- 2000Evaluate genetic heterogeneity of ABO, Rh and Gm antigens. Discuss how the principle human groups can be distinguished on the basis of their blood antigen characteristic.
Related questions from other units
- 2026Unit 12: In what manner is our understanding of serogenetics and cytogenetics useful in reproductive biology? What are the major ethical issues involved in reproductive technology?
- 2025Unit 9.3: What are genetic markers? Discuss their applications in understanding population variation, disease association and forensics.
- 2021Unit 12: How are the cases of disputed paternity solved ? Discuss the recent techniques.
- 2019Unit 9.3: Differentiate between transient and balanced genetic polymorphism. Illustrate your answer with suitable examples from human populations.
- 2015Unit 9.3: What do you understand by Immunogenetics? Explain with suitable examples.
- 2014Unit 9.7: What are the stresses at high altitudes? How do better cardio-respiratory functions help the native highlanders in combating low environmental pressure.
- 2010Unit 9.3: What is Balanced Genetic Polymorphism? How is it maintained in a population?
- 2001Unit 12: Evaluate the role of Serogenetics and Cytogenetics in reproductive biology.
- 1999Unit 12: Discuss the application of the human genetics in the field of forensic science and diagnosis and treatment of genetic disorders.
- 1996Unit 9.3: Discuss the concepts of balanced polymorphism and relaxed selection with special reference to Malaria dependent polymorphisms in man.