

- The Indian fertilizer industry has done best in nitrogenous fertilizers, and leans on imports for phosphate and potash inputs.
- It supplied the cradle in which high-yielding variety (HYV) seeds and assured irrigation flourished in the Green Revolution, easing India’s food security problem.
- Plant location follows a mix of feedstock, ports, pipelines and farm markets, and today’s supply depends heavily on world gas and mineral markets.
Position and Importance
India’s Position
- India is the second largest consumer of urea after China. Older accounts rank it second or third in nitrogenous production, behind China and the USA, and third in phosphatic production.
- Potash: reserves are limited and there is no indigenous capacity, so needs are met entirely through imports.
- Urea self-reliance has moved with demand:
- Older figures give 85% of need met at home, later 80%.
- In 2025-26, output of 293.26 lakh tonnes against sales of 396.60 gave about 74%.
- Older accounts note low general productivity and about 50% of all fertilizers imported.
- Ownership was long largely state-controlled. Leading public units have included the Fertilizer Corporation of India (FCI), National Fertilizers Limited and Hindustan Fertilizer Corporation. The industry today runs across public, cooperative and private sectors.
Importance and Linkages
- Regions of heavy use came to be known as the “granaries of India”. The industry was long called the second most important after iron and steel.
- Indian soils commonly lack nitrogen, phosphorus and potassium. Falling land fertility and a growing population have raised the industry’s value many times over.
- Foodgrain output grew from 50.83 million tonnes in 1950-51 to 255.36 in 2012-13 and 357.73 in 2024-25.
- Use per hectare rose from 0.55 kg in 1951-52 to 128.3 kg in 2011-12 and 150.11 kg in 2024-25.
- Linkages:
- Forward to agriculture.
- Backward to the petrochemical industry, whose by-products serve as raw material.
- Spatial and seasonal variation in use is high, because fertilizer works best with ample water:
- Older estimates gave rainfed areas 70% of farm land but only 20% of consumption. The rainfed share is now put at about 51–52% of net sown area.
- Rabi crops, grown mostly under irrigation, took about 66% of fertilizers while giving 33% of output in older estimates.
Growth and Organisation
Growth and Development
- Few basic industries have grown as fast, and it took rapid strides in recent decades. Yet it is essentially a post-Independence development.
- First steps:
- The first superphosphate factory came up at Ranipet (Tamil Nadu) in 1906.
- Fertilisers and Chemicals Travancore (FACT) was founded at Udyogamandal in 1943 and began production in 1947.
- Sindri (then in Bihar, now in Jharkhand), 1951: the turning point.
- It was run by Sindri Fertilizers and Chemicals, which passed in January 1961 into the company renamed the Fertilizer Corporation of India.
- Progress stayed slow till 1966.
- Output then rose sharply with HYV programmes, faster irrigation growth and urea as a straight fertilizer.
- Three decades of planning put India in the front rank of producers, and the industry grew under both public and private sectors. Its product list now spans many grades, matched to differing crops and soils.
| Measure | 1951-52 | Later |
|---|---|---|
| Nitrogen capacity | 85,000 tonnes | 11.07 million tonnes (1999-2000) |
| Phosphate capacity | 63,000 tonnes | 3.65 million tonnes (1999-2000) |
| Nitrogen production | 16,000 tonnes | 12.03 million tonnes (2004-05, older account) |
| Capacity utilisation, nitrogen | 18.82% | 82% (2004-05) |
- An older unit count was 56 large units (29 urea, 9 giving ammonium sulphate as a by-product) and about 72 medium and small single superphosphate units. Installed capacity was 119.60 lakh tonnes in 2004 and 120.61 lakh tonnes in 2012-13.
Reasons and Trends of Growth
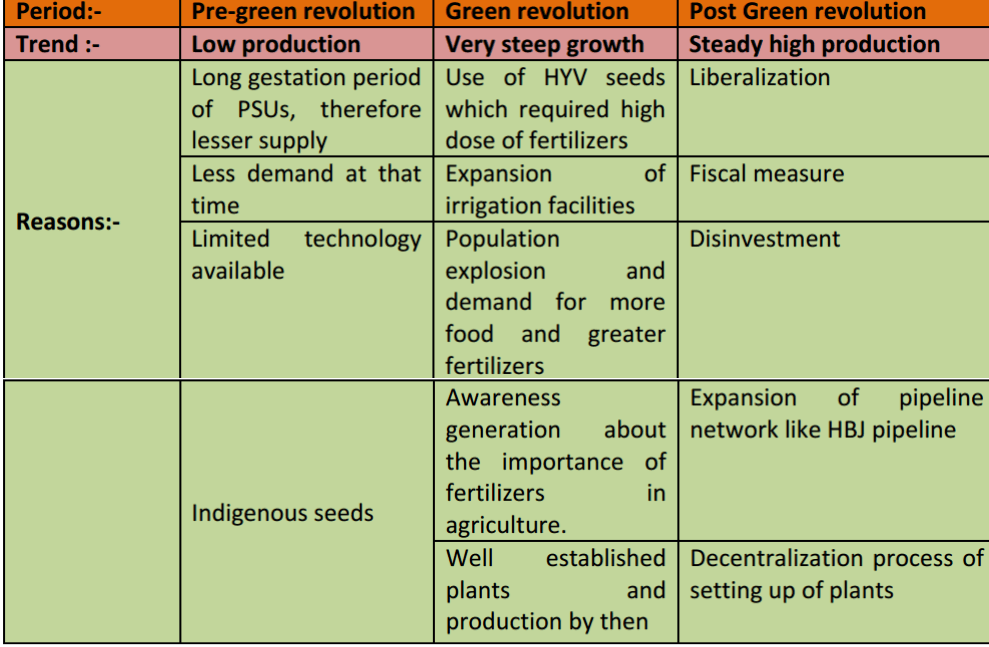
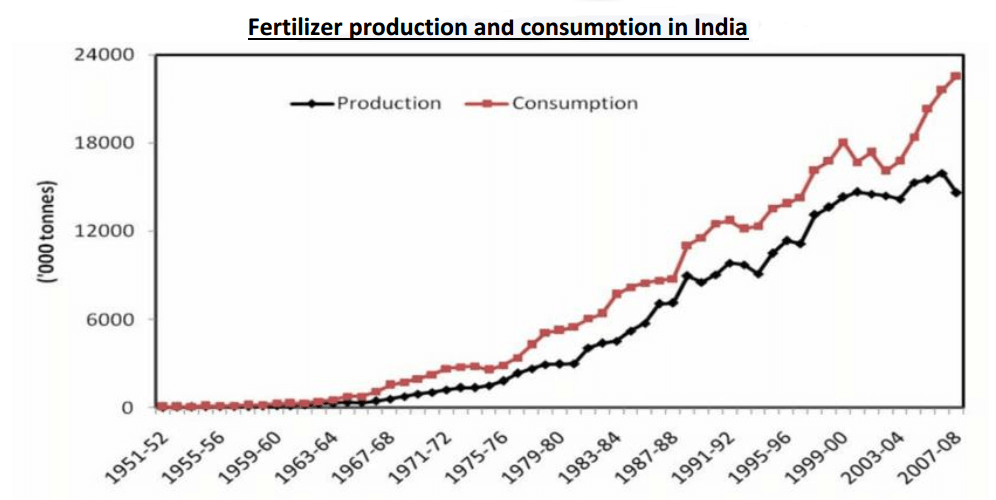
- This chart stops at 2007-08. Consumption has stayed ahead of production since, as the table below shows.
Output Today
| Lakh tonnes | 2024-25 | 2025-26 |
|---|---|---|
| Urea production | 306.67 | 293.26 |
| DAP production | 37.72 | 39.14 |
| Urea imports | 56.47 | 103.50 |
| DAP imports | 45.69 | 61.94 |
| All fertilizers, production | 517.74 |
- Urea peaked at a record 314.07 lakh tonnes in 2023-24, up from 225 in 2014-15.
- There are 33 urea units, with a reassessed capacity of 269.42 lakh tonnes (July 2026).
- Six new plants of 12.7 lakh tonnes each were built under the New Investment Policy 2012:
- Ramagundam.
- Gorakhpur, Sindri and Barauni, under Hindustan Urvarak and Rasayan.
- Matix and Chambal (Gadepan).
- Under way:
- Talcher, on coal gasification, which would use a domestic feedstock in place of imported gas.
- Namrup IV in Assam, 12.7 lakh tonnes, costing Rs 10,601.40 crore and due in 2030. Its foundation stone was laid on 21 December 2025, inside the Brahmaputra Valley Fertilizer Corporation’s premises.
- The National Investment Policy for Urea 2026, approved on 15 July 2026, supports about 8–9 more gas-based plants, with a return on equity band of 12–16%.
Public, Cooperative and Private Sectors
| Company | Base | Note |
|---|---|---|
| Fertilizer Corporation of India (FCI) | Sindri, Gorakhpur, Talcher, Ramagundam | Sick in 1992, closed in 2002; sites revived by new companies |
| National Fertilizers Limited (NFL) | Nangal, Bathinda, Panipat, Vijaipur | Set up on 23 August 1974; a leading nitrogen producer |
| FACT | Udyogamandal, Kochi | |
| Rashtriya Chemicals and Fertilizers (RCF) | Trombay, Thal | Took FCI’s Trombay units in 1978 |
| Hindustan Fertilizer Corporation (HFCL) | Namrup, Durgapur, Barauni | Sick in 1992, closed in 2002 |
| Madras Fertilizers Limited | Manali, Chennai | Joint venture with National Iranian Oil Company |
| Pyrites, Phosphates and Chemicals | Amjhore, Saladipura, Mussoorie | Mining and superphosphate; closed in 2000 |
| Paradip Phosphates | Paradip | Founded in 1981; phases in 1986 and 1992 |
| Brahmaputra Valley Fertilizer Corporation | Namrup | Hived off from HFCL in 2002 |
| FCI Aravali Gypsum and Minerals | Jodhpur | Gypsum mining, from 2003 |
| Projects and Development India | Design and engineering of plants |
- Cooperatives:
- Indian Farmers Fertiliser Cooperative (IFFCO), formed in November 1967, runs units at Kalol, Kandla, Phulpur and Aonla.
- Krishak Bharati Cooperative (KRIBHCO) runs the gas-based plant at Hazira.
- Private sector: Kanpur (IEL), Kota (SRC), Bharuch (GNFC), Visakhapatnam (Coromandel), Goa (ZACL), Ennore (EID Parry), Vadodara (GSFC), Tuticorin (SPIC) and Mangaluru (MFC).
Location and Distribution
Location Factors
- Raw materials: most units are raw-material oriented.
- Naphtha was once the preferred feedstock, with over 70% of nitrogen capacity tied to it. It is a by-product of the petroleum industry and was largely imported, which drew plants towards oil refineries. Pipelines and rail then freed plants from that tie, with priority for sites on the seaboard.
- Natural gas has since replaced it. About 80% of the gas used by urea units was imported (Rajya Sabha, December 2023).
- Coal serves as fuel and as raw material for the ammonia that nitrogenous fertilizer needs. Coal-based units stood at Ramagundam and Korba, and at Talcher and Sindri.
- Neyveli was the only lignite-based unit.
- Coke oven gas (COG), a by-product of steel plants, also serves as raw material, and it drew units to Bhilai, Durgapur, Jamshedpur and Rourkela.
- Rock phosphate is the base of phosphatic fertilizers, and about 90% of need has been imported.
- Small commercial deposits occur in Singhbhum (Jharkhand), Visakhapatnam (Andhra Pradesh) and Rajasthan.
- Mine output now comes only from Rajasthan and Madhya Pradesh. Reserves and resources were 311.25 million tonnes (April 2020), about 1% of it chemical-fertilizer grade.
- Apatite has had no output since 2017-18.
- Sulphur: India has no large elemental reserves. Older accounts linked supply to Tamil Nadu. It now comes as a refinery and fertilizer by-product, with about 0.21 million tonnes of native sulphur estimated at Puga in Ladakh.
- Hydro-grade gypsum is used in large quantities for ammonium sulphate.
- Naphtha was once the preferred feedstock, with over 70% of nitrogen capacity tied to it. It is a by-product of the petroleum industry and was largely imported, which drew plants towards oil refineries. Pipelines and rail then freed plants from that tie, with priority for sites on the seaboard.
- Energy: the industry is highly energy-intensive, so some plants seek cheap power, as Nangal did.
- Transport: inputs and outputs are bulky.
- Ports suit it, hence the many port-based plants.
- Gas pipelines such as HBJ have shaped plant sites.
- Many plants sit where the rail network is dense.
- Market: in Punjab and Uttar Pradesh, market pull has guided location.
- Technology: chemical processes need constant upgrading, and fuel efficiency matters.
- Government policy: this was a major factor, as at Sindri and Jagdishpur.
- The Administered Price Mechanism once set the industry’s prospects.
- International agreements on subsidy also affect it. Consumption has fallen in some years when subsidies were cut. Total nutrient use still rose from 28,122 thousand tonnes in 2010-11 to 32,928 in 2024-25.
- Capital: heavy needs for materials, machinery, transport and technique favoured the Gujarat–Maharashtra region.
Fertilizer Regions
- The industry is spread over five main regions:
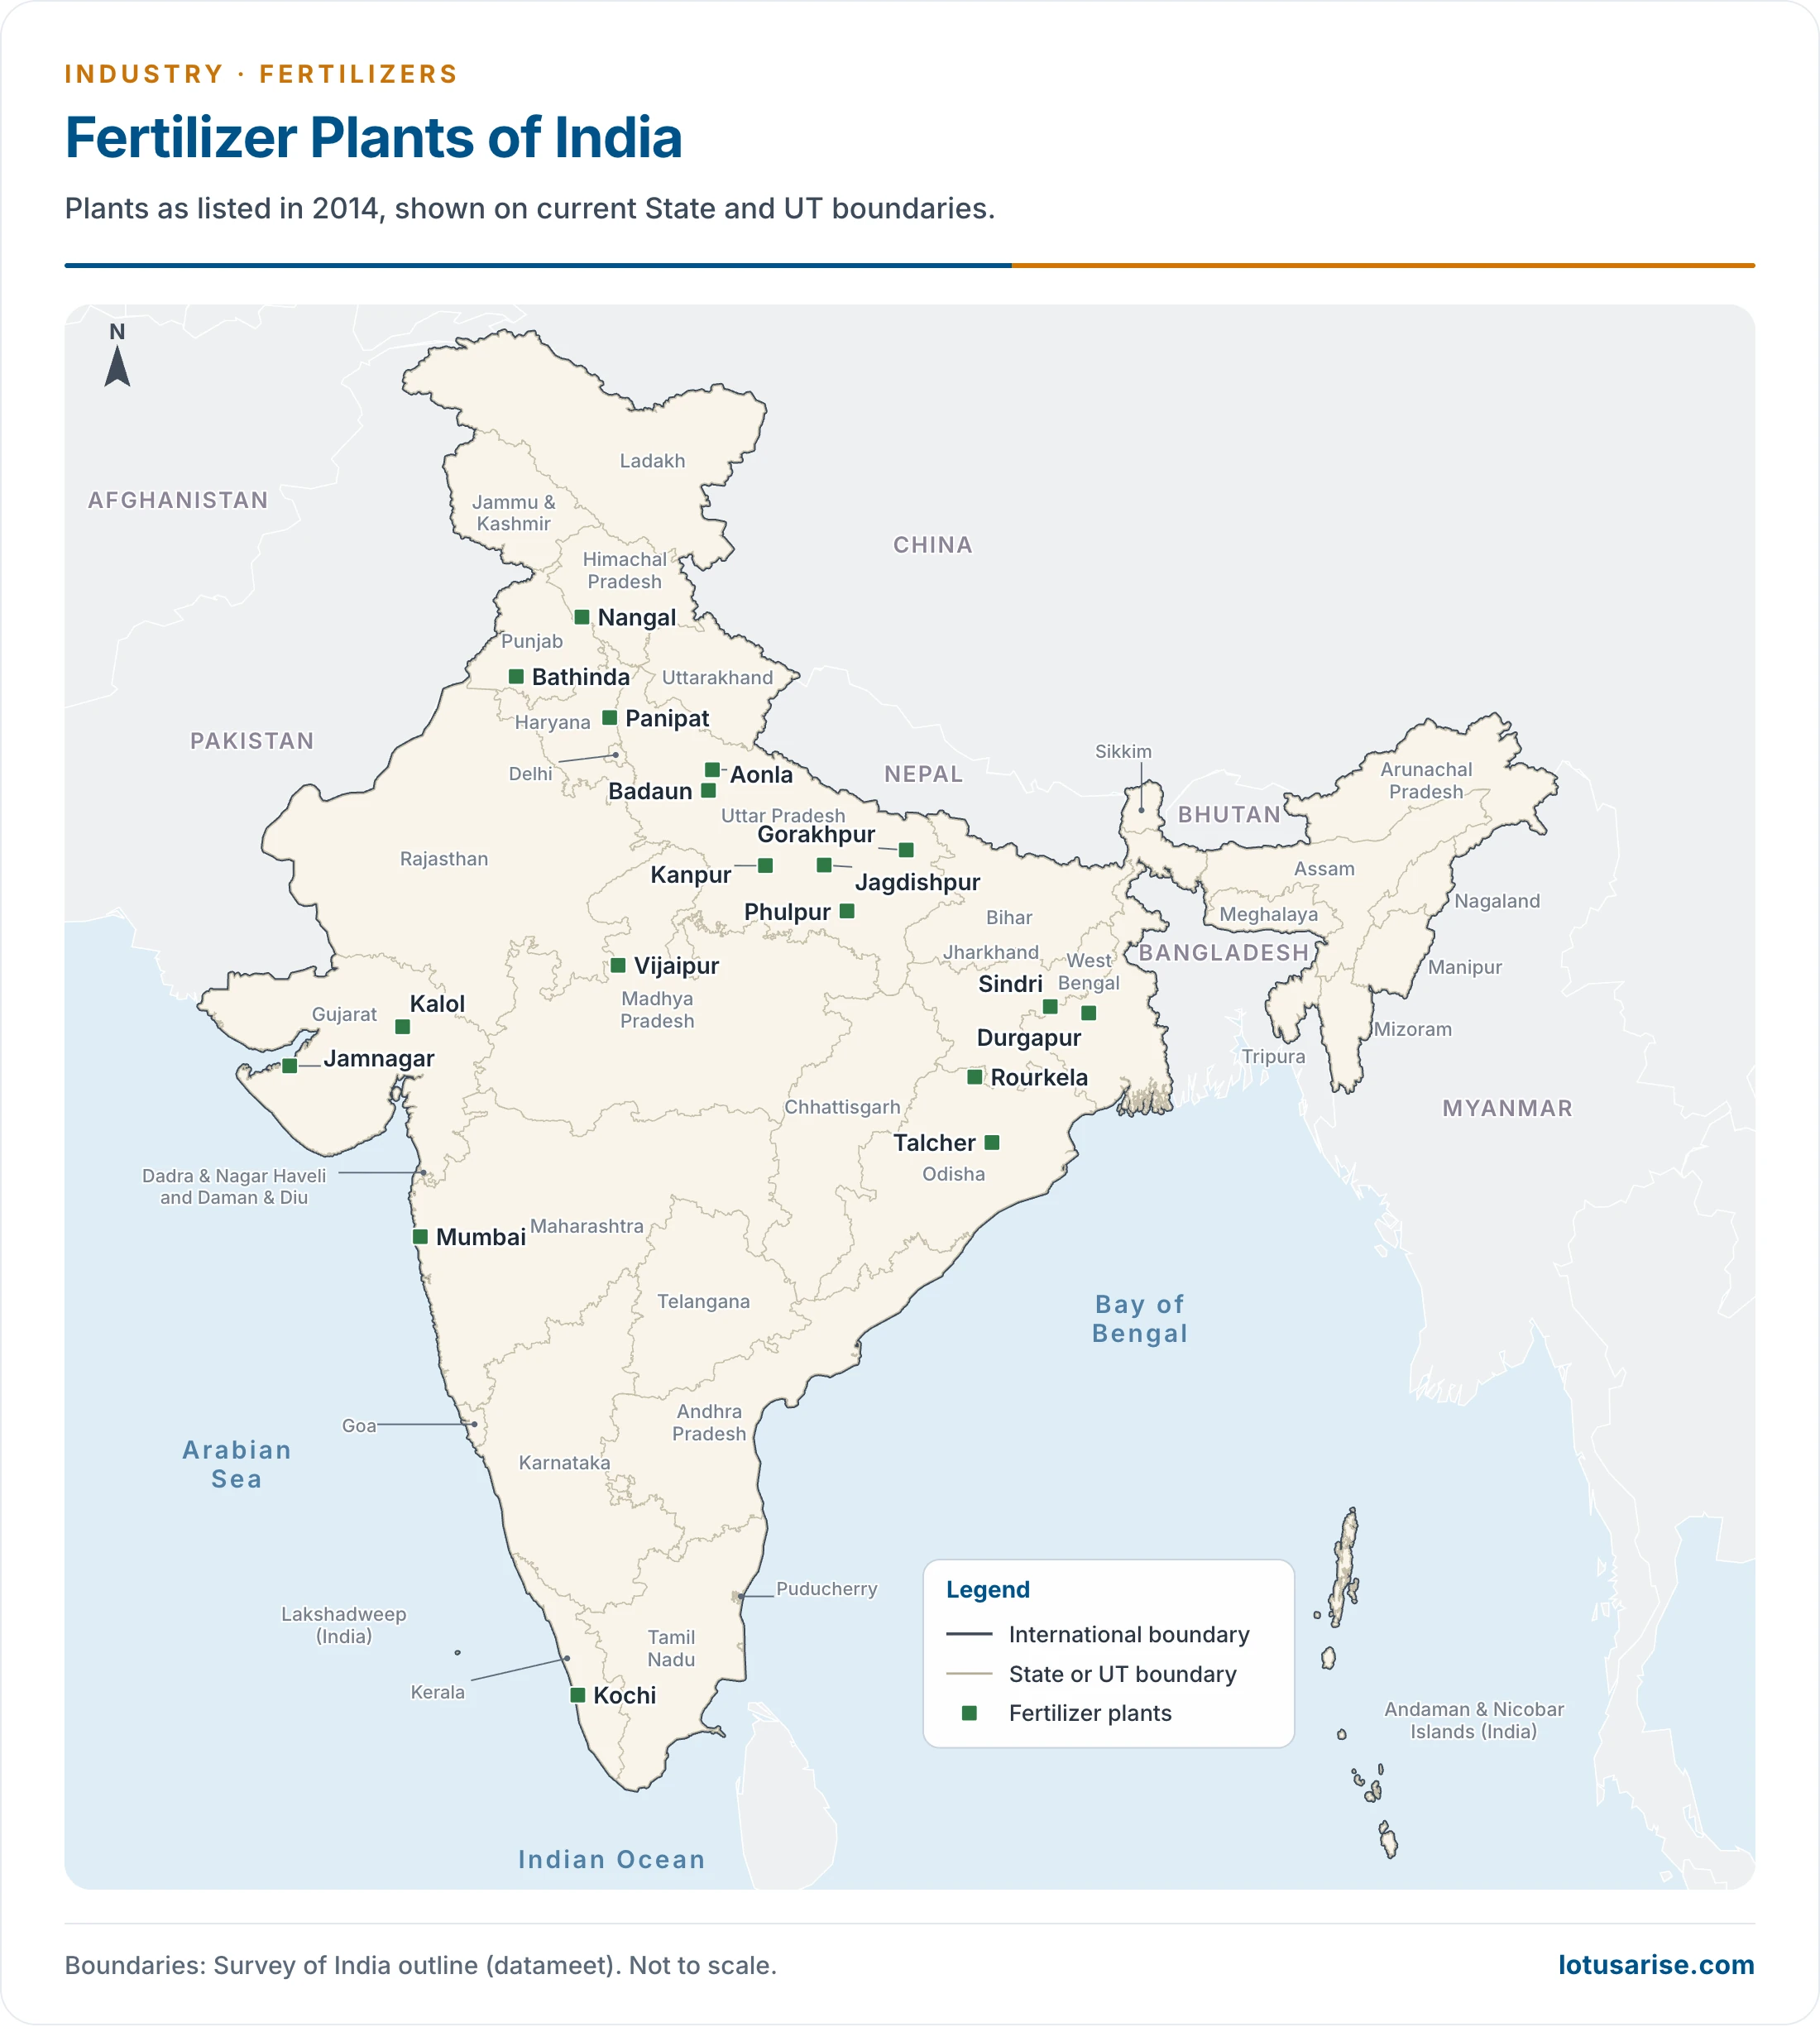
- Gujarat region, with Maharashtra:
- This is the largest producing region.
- Refineries and petrochemical units here supply naphtha and gas, the basic raw material for nitrogenous fertilizer.
- Important centres are Vadodara, Kalol, Ahmedabad, Kandla and Trombay.
- Chotanagpur plateau and other steel towns:
- Plants came up here because they are close to iron and steel works, whose by-products serve as raw material: basic slag and coke, with coke oven gas as noted above.
- Important centres are Jamshedpur, Rourkela, Durgapur, Burnpur, Sindri and Bhilai.
- Visakhapatnam and Mettur are other centres listed with this group. Neyveli has a separate base in lignite.
- Tamil Nadu region, with Keralam (Kerala):
- Older accounts credit its rise to sulphur supply and to a deliberate dispersal of the industry to the south. Port sites have served it since.
- Important centres are Coimbatore, Neyveli, Alwaye and Kochi (Keralam), Tuticorin and Ennore.
- North-West region:
- As the most advanced farm region, it offers a huge market, and this demand drove the plants.
- Important centres are Bathinda and Nangal (Punjab), Panipat (Haryana) and Delhi.
- Uttar Pradesh region:
- Pipeline gas and a vast market made it a hub, and mineral phosphate also occurs in the State.
- Centres are Jagdishpur, Gorakhpur, Aonla, Shahjahanpur and Babrala.
- An older State-wise picture (shares of national output):
| State | Nitrogen | Phosphate | Installed capacity | Centres beyond those above |
|---|---|---|---|---|
| Gujarat | Over 25% | Over 25% | 14%+ | Bharuch, Udhna, Bhavnagar, Hazira, Surat, Navsari |
| Tamil Nadu | 9% | 16% | 11% | Ranipet, Mettur Dam, Cuddalore, Avadi, Manali |
| Uttar Pradesh | 17% | 3.4% | 9% | Kanpur, Phulpur, Varanasi, Magarwara |
| Maharashtra | 11% | 7% | Mumbai, Ambarnath, Loni-Kalbhor | |
| Andhra Pradesh and Telangana | 3.5% | 11% | 7% | Visakhapatnam, Ramagundam, Kakinada, Hyderabad |
| Odisha | 3% | 11.6% | 6% | Rourkela, Talcher, Paradip |
| Keralam | 3.5% | 6% | 6% | Alwaye, Kochi |
| Rajasthan | 2.3% | 1.6% | 5% | Kota, Debari, Khetri, Saladipura, Chittaurgarh |
- Gujarat and Tamil Nadu have held the largest numbers of plants, and these eight States carry most of the installed capacity.
- Others: Barauni (Bihar), Dhanbad (Jharkhand), Haldia and Rishra (West Bengal), Korba (Chhattisgarh), Namrup (Assam), Mangaluru (Karnataka) and Sancoale in Goa.
HBJ Pipeline
- The Hazira–Bijaipur–Jagdishpur (HBJ) pipeline, now the HVJ line, was built by the Gas Authority of India Limited (GAIL) to carry gas. Naphtha or gas by pipeline and rail has spread plants far from the coast.
- GAIL’s line changed the map of the industry, because gas could now reach inland markets in the north.
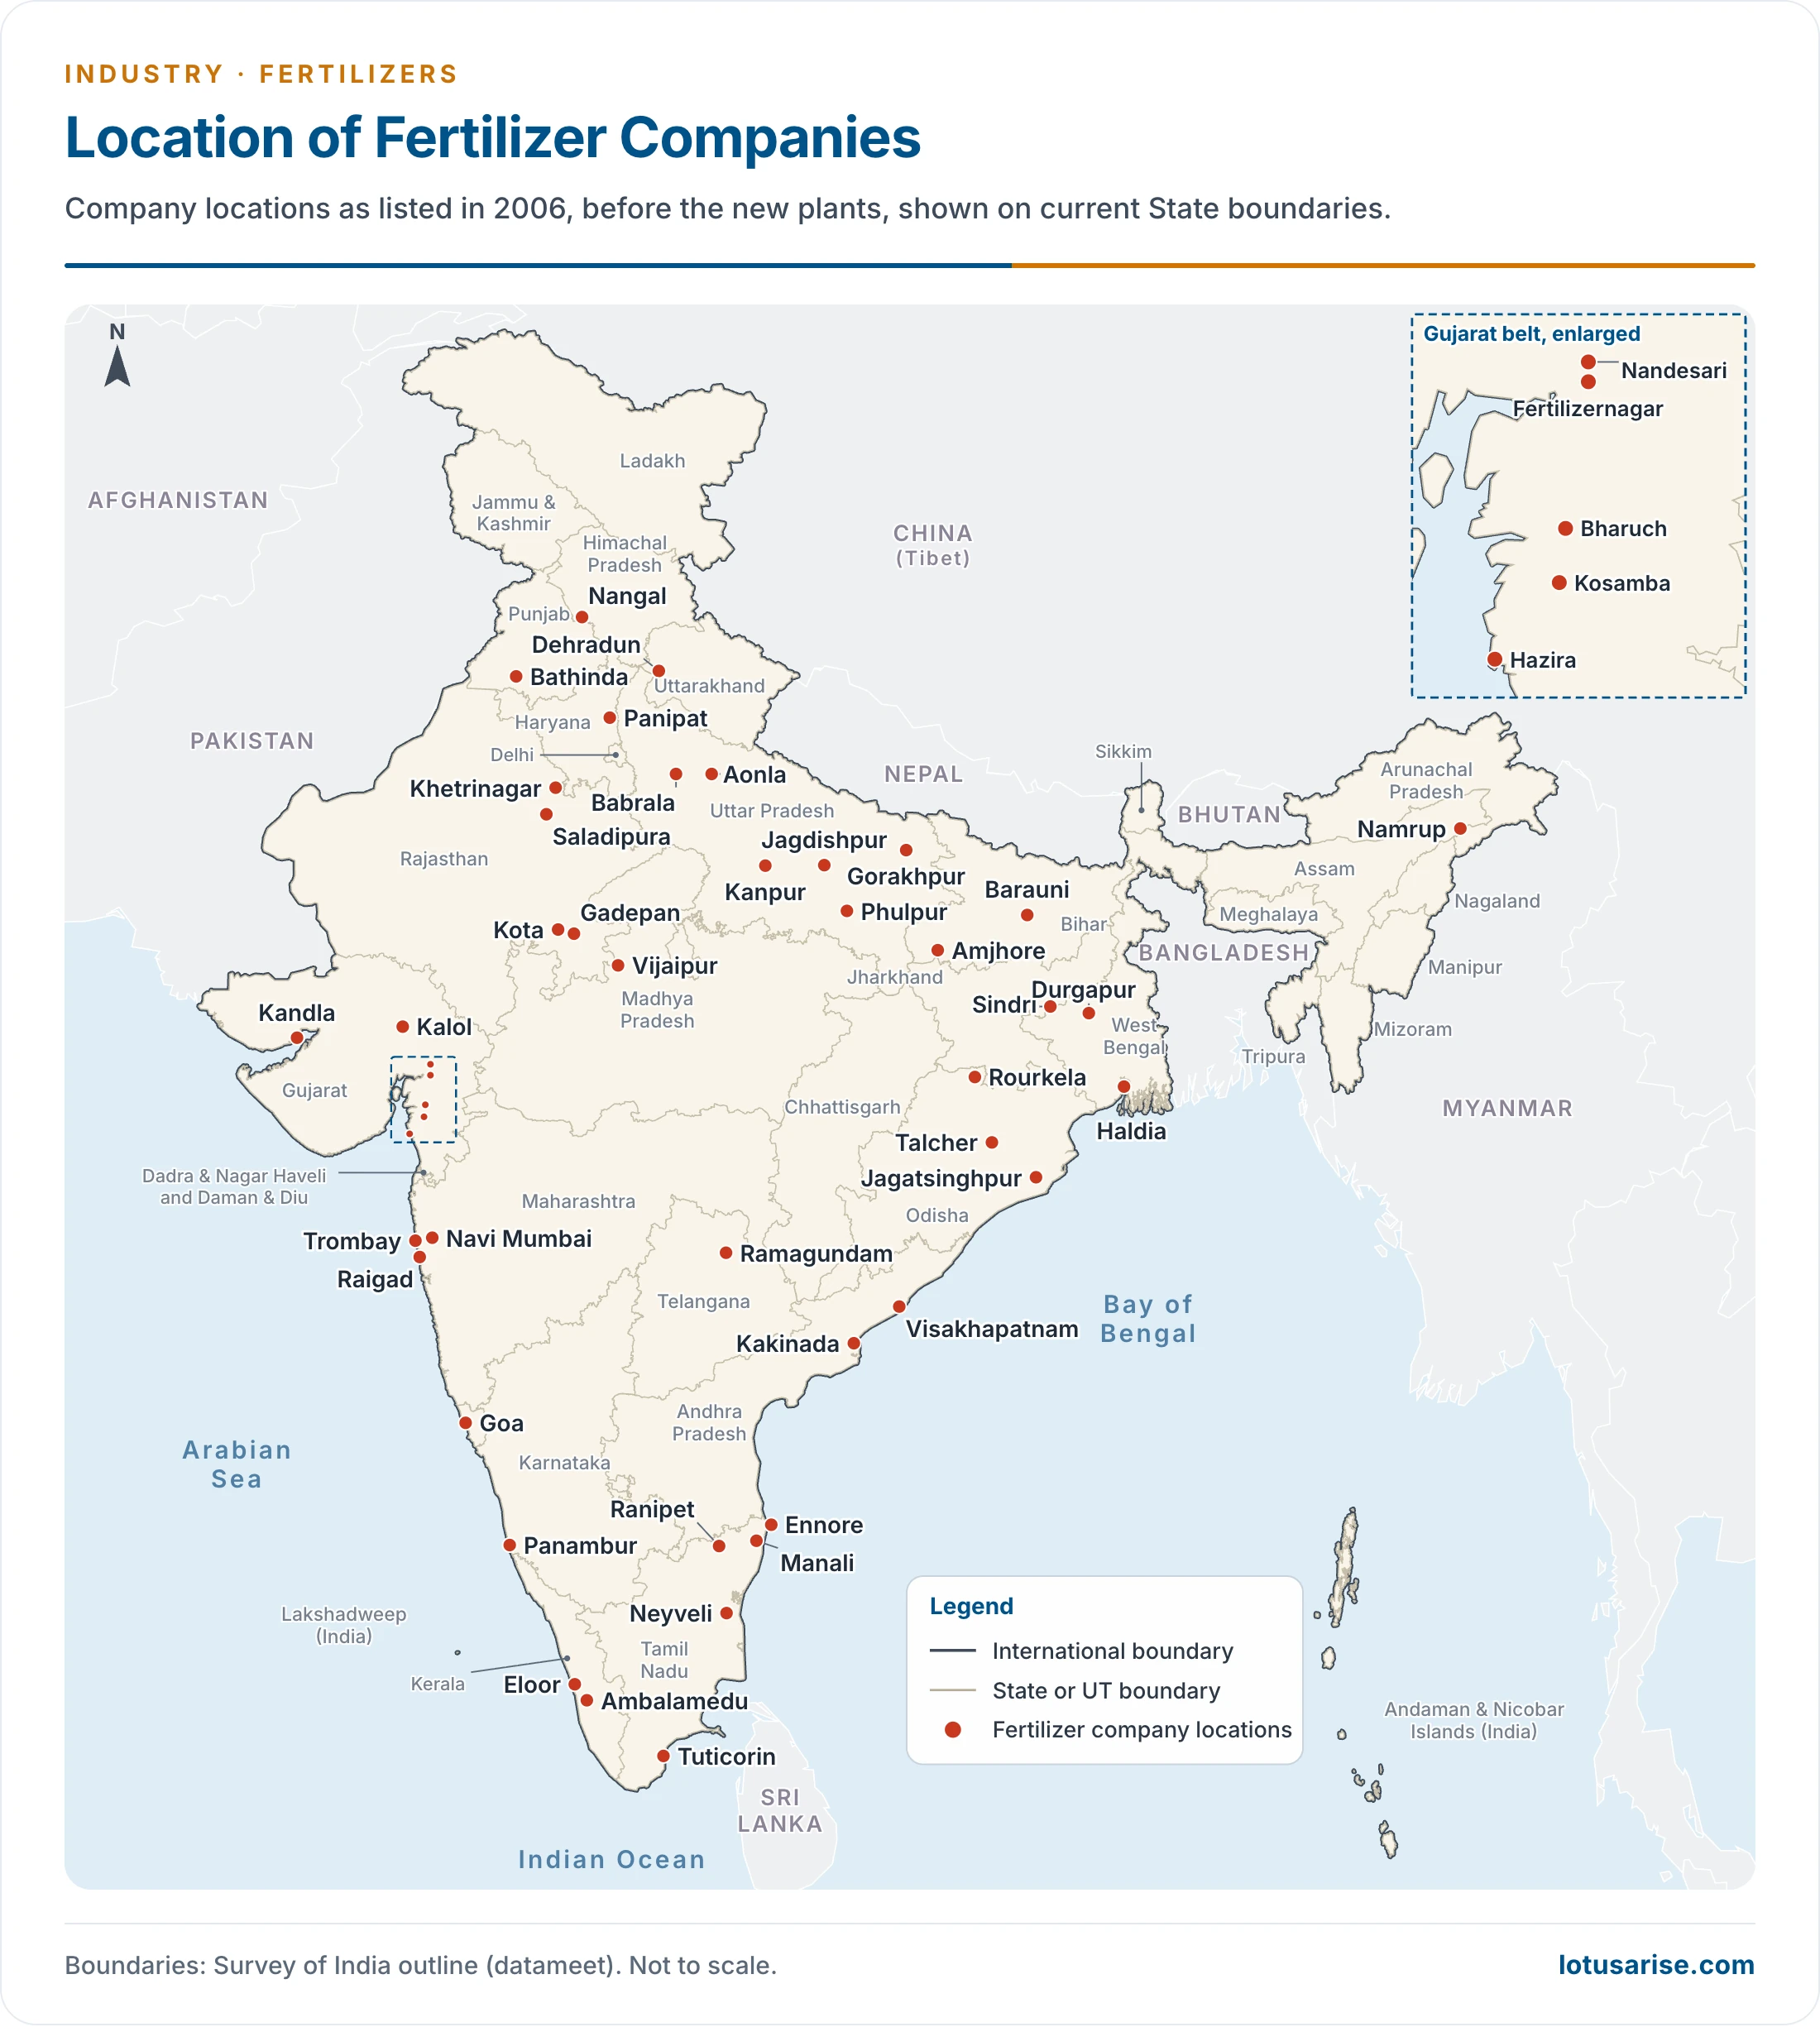
- It runs about 1,750 km and links Hazira in Gujarat, Vijaipur in Madhya Pradesh and Jagdishpur in Uttar Pradesh.
- It was designed to carry 18 million cubic metres of gas a day to:
- Three power stations: Kawas (Gujarat), Anta (Rajasthan) and Auraiya (Uttar Pradesh).
- Six fertilizer plants: Vijaipur, Gadepan near Kota (listed in older accounts under Sawai Madhopur), Jagdishpur, Shahjahanpur, Aonla and Babrala.
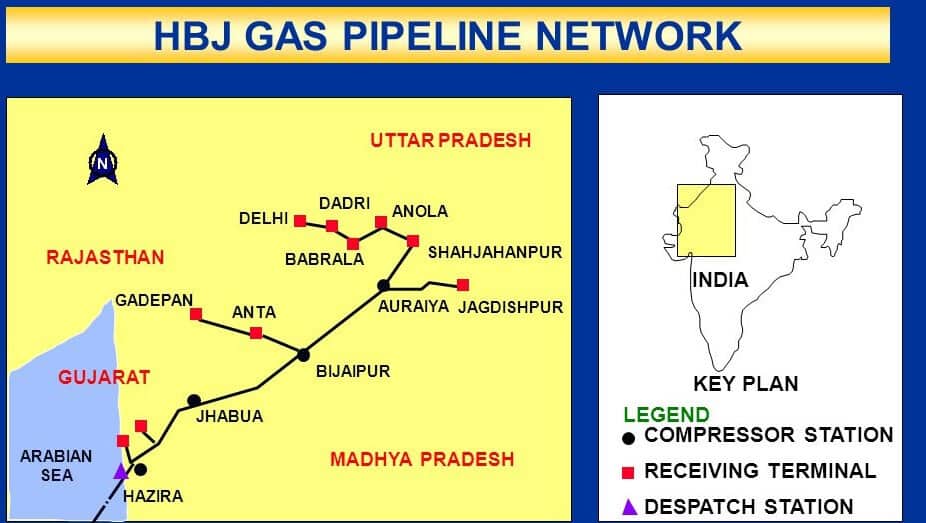
- In this map, read “Anola” as Aonla.
- Coal-based plants sit close to coal-producing regions: Korba, Talcher and Ramagundam, with Neyveli on lignite. Ramagundam has since been rebuilt on gas, and Talcher is being rebuilt on coal gasification.
Problems, Supply Chain and Policy
Problems of the Industry
- Raw material availability and pricing:
- Supply and demand swings drive price fluctuations.
- India lacks the natural resources for fertilizers, and domestic gas falls short for urea.
- Oil price rises abroad hit the industry.
- Government policy:
- Subsidies keep fertilizer cheap for farmers and food crop costs low.
- WTO rules press for lower subsidies, which goes against the industry’s growth.
- Slow irrigation growth: lower consumption and weak demand restrict the industry, as stressed in older accounts.
- Obsolete technology: most PSUs ran on decades-old technology, losing money and their competitive edge. FCI and HFCL sites have since been rebuilt with new plants, and the New Urea Policy 2015 set out to raise domestic output, push energy efficiency and trim the subsidy bill.
- Subsidy burden: the budget for fertilizer subsidy stood at Rs 1,86,460 crore (revised) in 2025-26, and is set at Rs 1,70,799 crore for 2026-27.
- Feedstock dependence: even a record domestic output of urea rests on imported gas, so self-reliance in the product is not self-reliance in the input.
- Imports keep growing:
| Year | 1960-61 | 1970-71 | 1980-81 | 1990-91 | 2000-01 | 2010-11 | 2013-14 |
|---|---|---|---|---|---|---|---|
| Thousand tonnes | 307 | 2,392.7 | 5,560.2 | 7,560.3 | 7,423.4 | 20,658.9 | 22,154.2 |
| Rs crore | 13 | 86 | 818 | 1,766 | 3,034 | 31,533 | 38,231 |
The Global Supply Chain
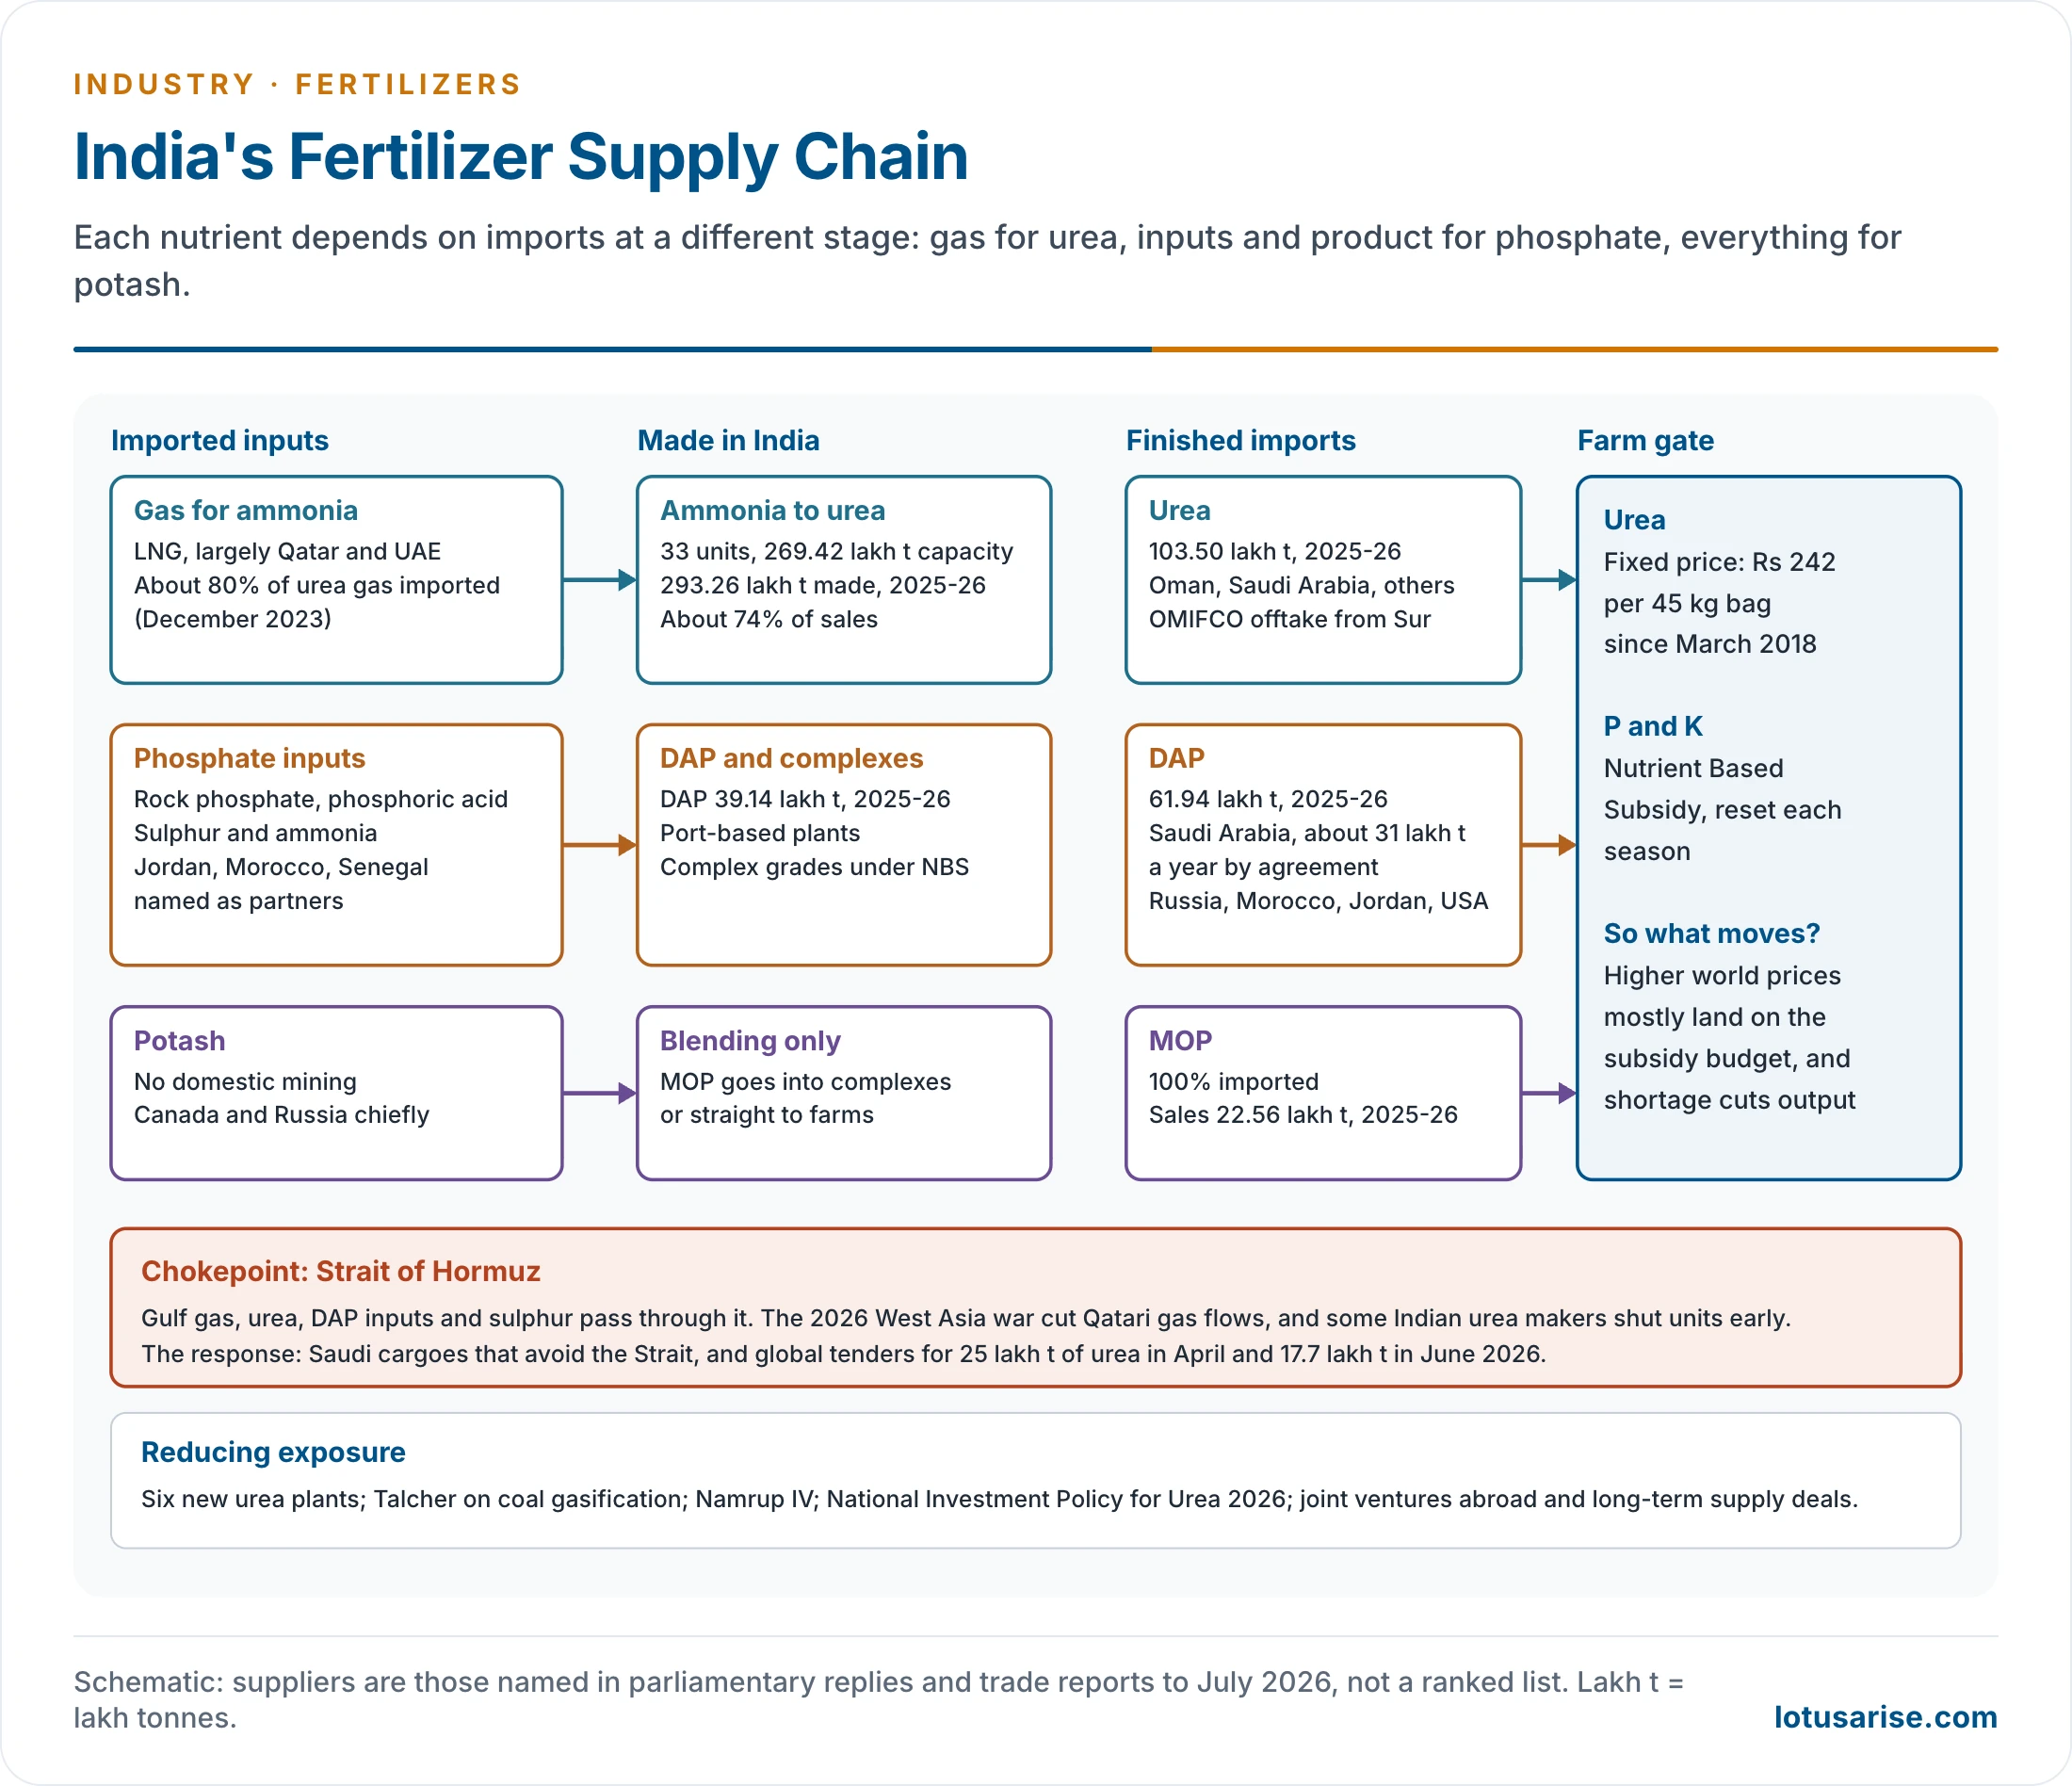
- Nitrogen:
- Dependence is hidden in the gas. Liquefied natural gas comes largely from Qatar and the UAE.
- Finished urea comes from suppliers such as Oman and Saudi Arabia.
- Oman India Fertiliser Company (OMIFCO) at Sur, owned with IFFCO and KRIBHCO, ships 1.65 million tonnes of urea a year to India.
- Phosphate:
- Rock phosphate, phosphoric acid, ammonia and sulphur are largely imported, and so is much of the finished DAP.
- Suppliers named in 2026 include Saudi Arabia, Morocco, Russia, Jordan and the USA.
- Potash: 100% imported, chiefly from Canada and Russia.
- How input prices reach domestic output:
- Urea has a fixed farm price of Rs 242 per 45 kg bag, unchanged since March 2018. Higher gas prices therefore land on the subsidy bill.
- For phosphate and potash, higher prices squeeze makers and call for bigger subsidy. Cabinet raised the Kharif 2026 outlay to Rs 41,533.81 crore, about Rs 4,317 crore above Kharif 2025.
- A physical shortage of gas cuts output directly.
- The 2026 test:
- The West Asia war and the Hormuz disruption cut Qatari gas flows, and some Indian urea makers shut units or advanced maintenance.
- DAP prices rose from about US$625 to US$865 a tonne.
- India bought 25 lakh tonnes of urea in April and 17.7 in June through global tenders. Urea imports had already jumped 83% in 2025-26.
- Older accounts also named Russia, Canada, Japan and the USA as suppliers, with parts of Europe.
Prospects of the Industry
- Self-reliance drive: new plants, coal gasification at Talcher and long-term supply deals aim to reduce exposure to any one region.
- Population: growing numbers and food security needs brighten the outlook.
- Food consumption: demand for varied, better grains raises the role of fertilizers.
- Awareness: education, literacy and digital communication are spreading use to new areas.
Neem-Coated Urea
- Neem has proven nitrification inhibition properties. It slows the release of nitrogen from urea, cutting use by an estimated 10–15%. For the farmer, the coating means better nitrogen use and less leaching, and it checks the diversion of subsidised urea to industry.
- 24 March 2015: indigenous producers had to neem-coat 75% of subsidised urea.
- 25 May 2015: under the New Urea Policy, the Department of Fertilizers raised the mandate to 100%, with an extra 5% on the MRP of Rs 5,360 per tonne.
- Domestic urea was fully coated from 1 September 2015, and imported urea from 1 December 2015.
Nutrient Based Subsidy Scheme
- The Nutrient Based Subsidy (NBS) programme began in 2010, and pays subsidy by nutrient content (N, P, K and S).
- It first covered 22 decontrolled grades: DAP, MAP, TSP, DAP Lite, MOP, SSP, ammonium sulphate and 15 complex grades. It now covers 28 grades.
- The Cabinet Committee on Economic Affairs extended it till 2019-20, and rates are now set season by season.
- These fertilizers reach farmers at subsidised rates through makers and importers, and the farm price is left to move more than for urea. Urea itself stays outside the scheme.
Joint Ventures Abroad
- The Government encourages companies to set up joint ventures in resource-rich countries, with buy-back arrangements and long-term supply deals for fertilizers and inputs.
- Companies need natural gas, ammonia, phosphoric acid, rock phosphate and sulphuric acid.
- OMIFCO is the model, with production from January 2006.
- Ma’aden of Saudi Arabia agreed in 2025 to supply about 31 lakh tonnes of DAP a year for five years.
Previous Year Questions
2026Explain the global supply chain for the fertilizer industry in India. How do international prices of key inputs affect domestic production?2023Map item: Ramagundam2020Elucidate the benefits of the neem-coated urea scheme for Indian agriculture.2013Map item: Sindri





Thank you very much 🙏🏼🙏🏼
i am very very grateful to you sir
lotus arise is now my primary preparation place for geography optional and graduation
thank you so much sir🙏🏼
Hazira port (Surat) is in Gujarat rather than in Maharashtra