

Official syllabusPaper II · Unit 4 · Work Psychology and Organisational Behaviour
Ergonomics.
Definition
Ergonomics (or human factors) is “the scientific discipline concerned with the understanding of interactions among humans and other elements of a system, and the profession that applies theory, principles, data, and methods to design in order to optimize human well-being and overall system performance.”
International Ergonomics Association (2000)
Ergonomics reverses the older logic of industrial psychology: instead of selecting and training people to suit a machine, it designs the machine, task and setting to suit people. Its psychological core is the man-machine system, where errors once blamed on operators proved to be built into displays and controls, a discovery first made in aircraft cockpits.
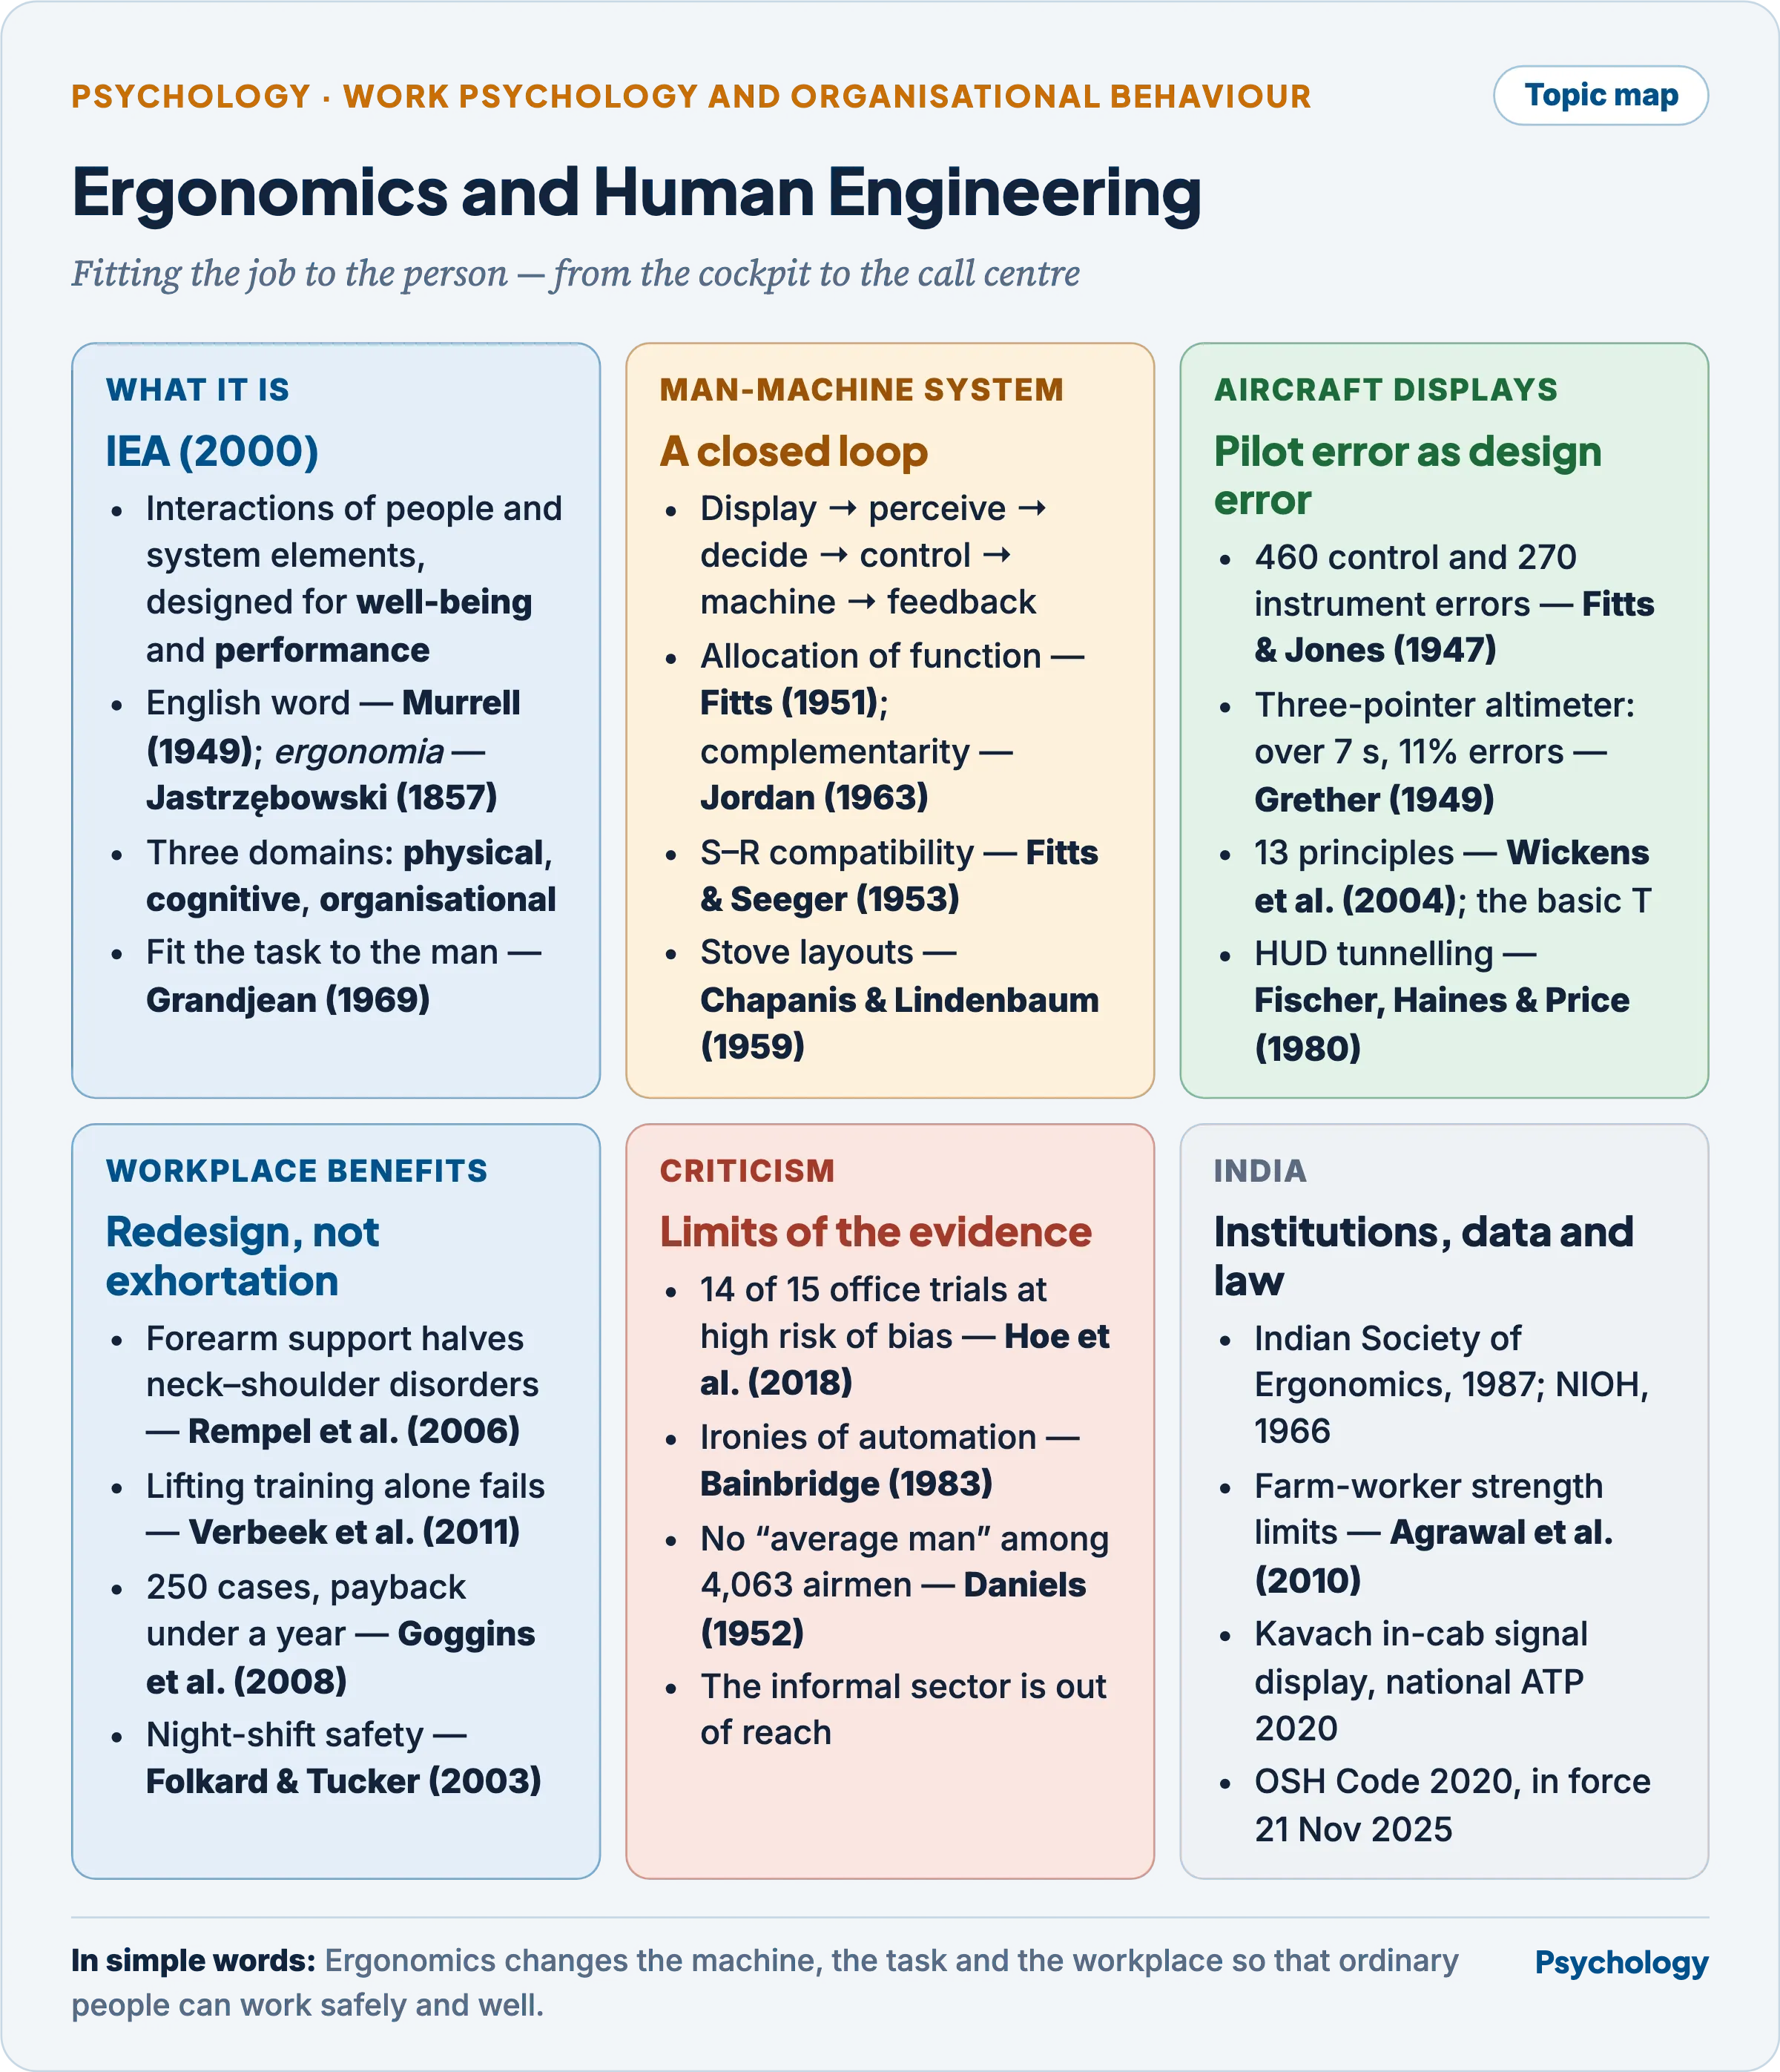
Every gain in the bottom row comes from changing the design, the one idea of the top row.
Ergonomics, human factors and human engineering
- The word joins Greek ergon (work) and nomos (law). Jastrzębowski (1857), a Polish naturalist, used ergonomia for a science of work.
- Murrell (1949) coined the English term; a July 1949 meeting in his Admiralty office formed the society named the Ergonomics Research Society in 1950.
- Human engineering and human factors are the American names for the same field. The Human Factors Society dates from 1957 and the International Ergonomics Association from 1959; the IEA’s 2000 definition treats the terms as synonyms.
- The defining shift is from fitting the man to the job to fitting the task to the man, the title of Grandjean’s (1969) English textbook.
- Taylor (1911) optimised the method for a given worker, and selection and training adapt the person (Personnel Selection and the Use of Psychological Tests in Industry; Training and Human Resource Development); ergonomics changes the equipment, for every operator at once.
- Chapanis (1943), at the Aero Medical Laboratory, Wright Field, traced B-17 landing accidents in which pilots raised the wheels instead of the flaps to two identical levers placed side by side.
- He fixed a small rubber wheel to the gear lever and a wedge to the flap lever, and the confusion virtually disappeared — the origin of shape coding.
- Fitts and Jones (1947) collected 460 accounts of errors in operating aircraft controls through interviews and written reports.
- The error classes included operating the wrong control (substitution), adjusting it wrongly, forgetting to operate it, and being unable to reach it.
- Fitts and Jones (1947) concluded that much “pilot error” was design error, reducible by designing and locating controls to human requirements.
- Limitation: the data are pilots’ recollections of incidents, so the counts reflect memory and willingness to admit a mistake.
- Dul and colleagues (2012) reduce the field to three features: a systems approach, a design orientation, and two joint outcomes, performance and well-being.
Physical, cognitive and organisational ergonomics
| Domain (IEA, 2000) | Concerned with | Typical topics | Where psychology enters | Landmark |
|---|---|---|---|---|
| Physical | Anatomical, anthropometric, physiological and biomechanical characteristics | Posture, lifting, repetitive work, musculoskeletal disorders, layout | Perceived exertion, comfort, fatigue | Revised NIOSH lifting equation (Waters and colleagues, 1993) |
| Cognitive | Perception, memory, reasoning, motor response | Workload, decision-making, human–computer interaction, human reliability | Attention, information processing, error | Cockpit instrument errors (Fitts and Jones, 1947) |
| Organisational | Sociotechnical systems: structures, policies, processes | Work design, working time, teamwork, participatory design | Groups, motivation, participation | Longwall coal mining (Trist and Bamforth, 1951) |
- Methods: task analysis (breaking a job into steps and demands), simulator experiments, field observation and incident records.
- Workload is often rated on the NASA-TLX of Hart and Staveland (1988), six subscales running from mental demand to frustration.
The man-machine system
- Sanders and McCormick (1993) define a man-machine system as one or more people and one or more physical components interacting so that given inputs yield a desired output. The “machine” may be a tool, a vehicle or a whole control room.
- In a closed-loop system the operator corrects continuously from feedback:
- the machine’s state appears on a display;
- the operator senses it, perceives and interprets it, and decides;
- the decision is executed through a control;
- the machine changes, and its new state returns to the display.
- The loop sits inside a working environment — light, noise, heat, vibration, time pressure — that can degrade any link.
- An open-loop system runs without correction once set. By who supplies power and control, systems are manual (hand tools), mechanical or semi-automatic (machine power, human control, as in driving) and automatic (the machine senses, decides and acts while the human monitors).
- Reliabilities of components in series multiply: an operator correct 99 times in 100 with a 0.999-reliable instrument gives about 0.989. A better machine alone cannot lift the system above its human link.
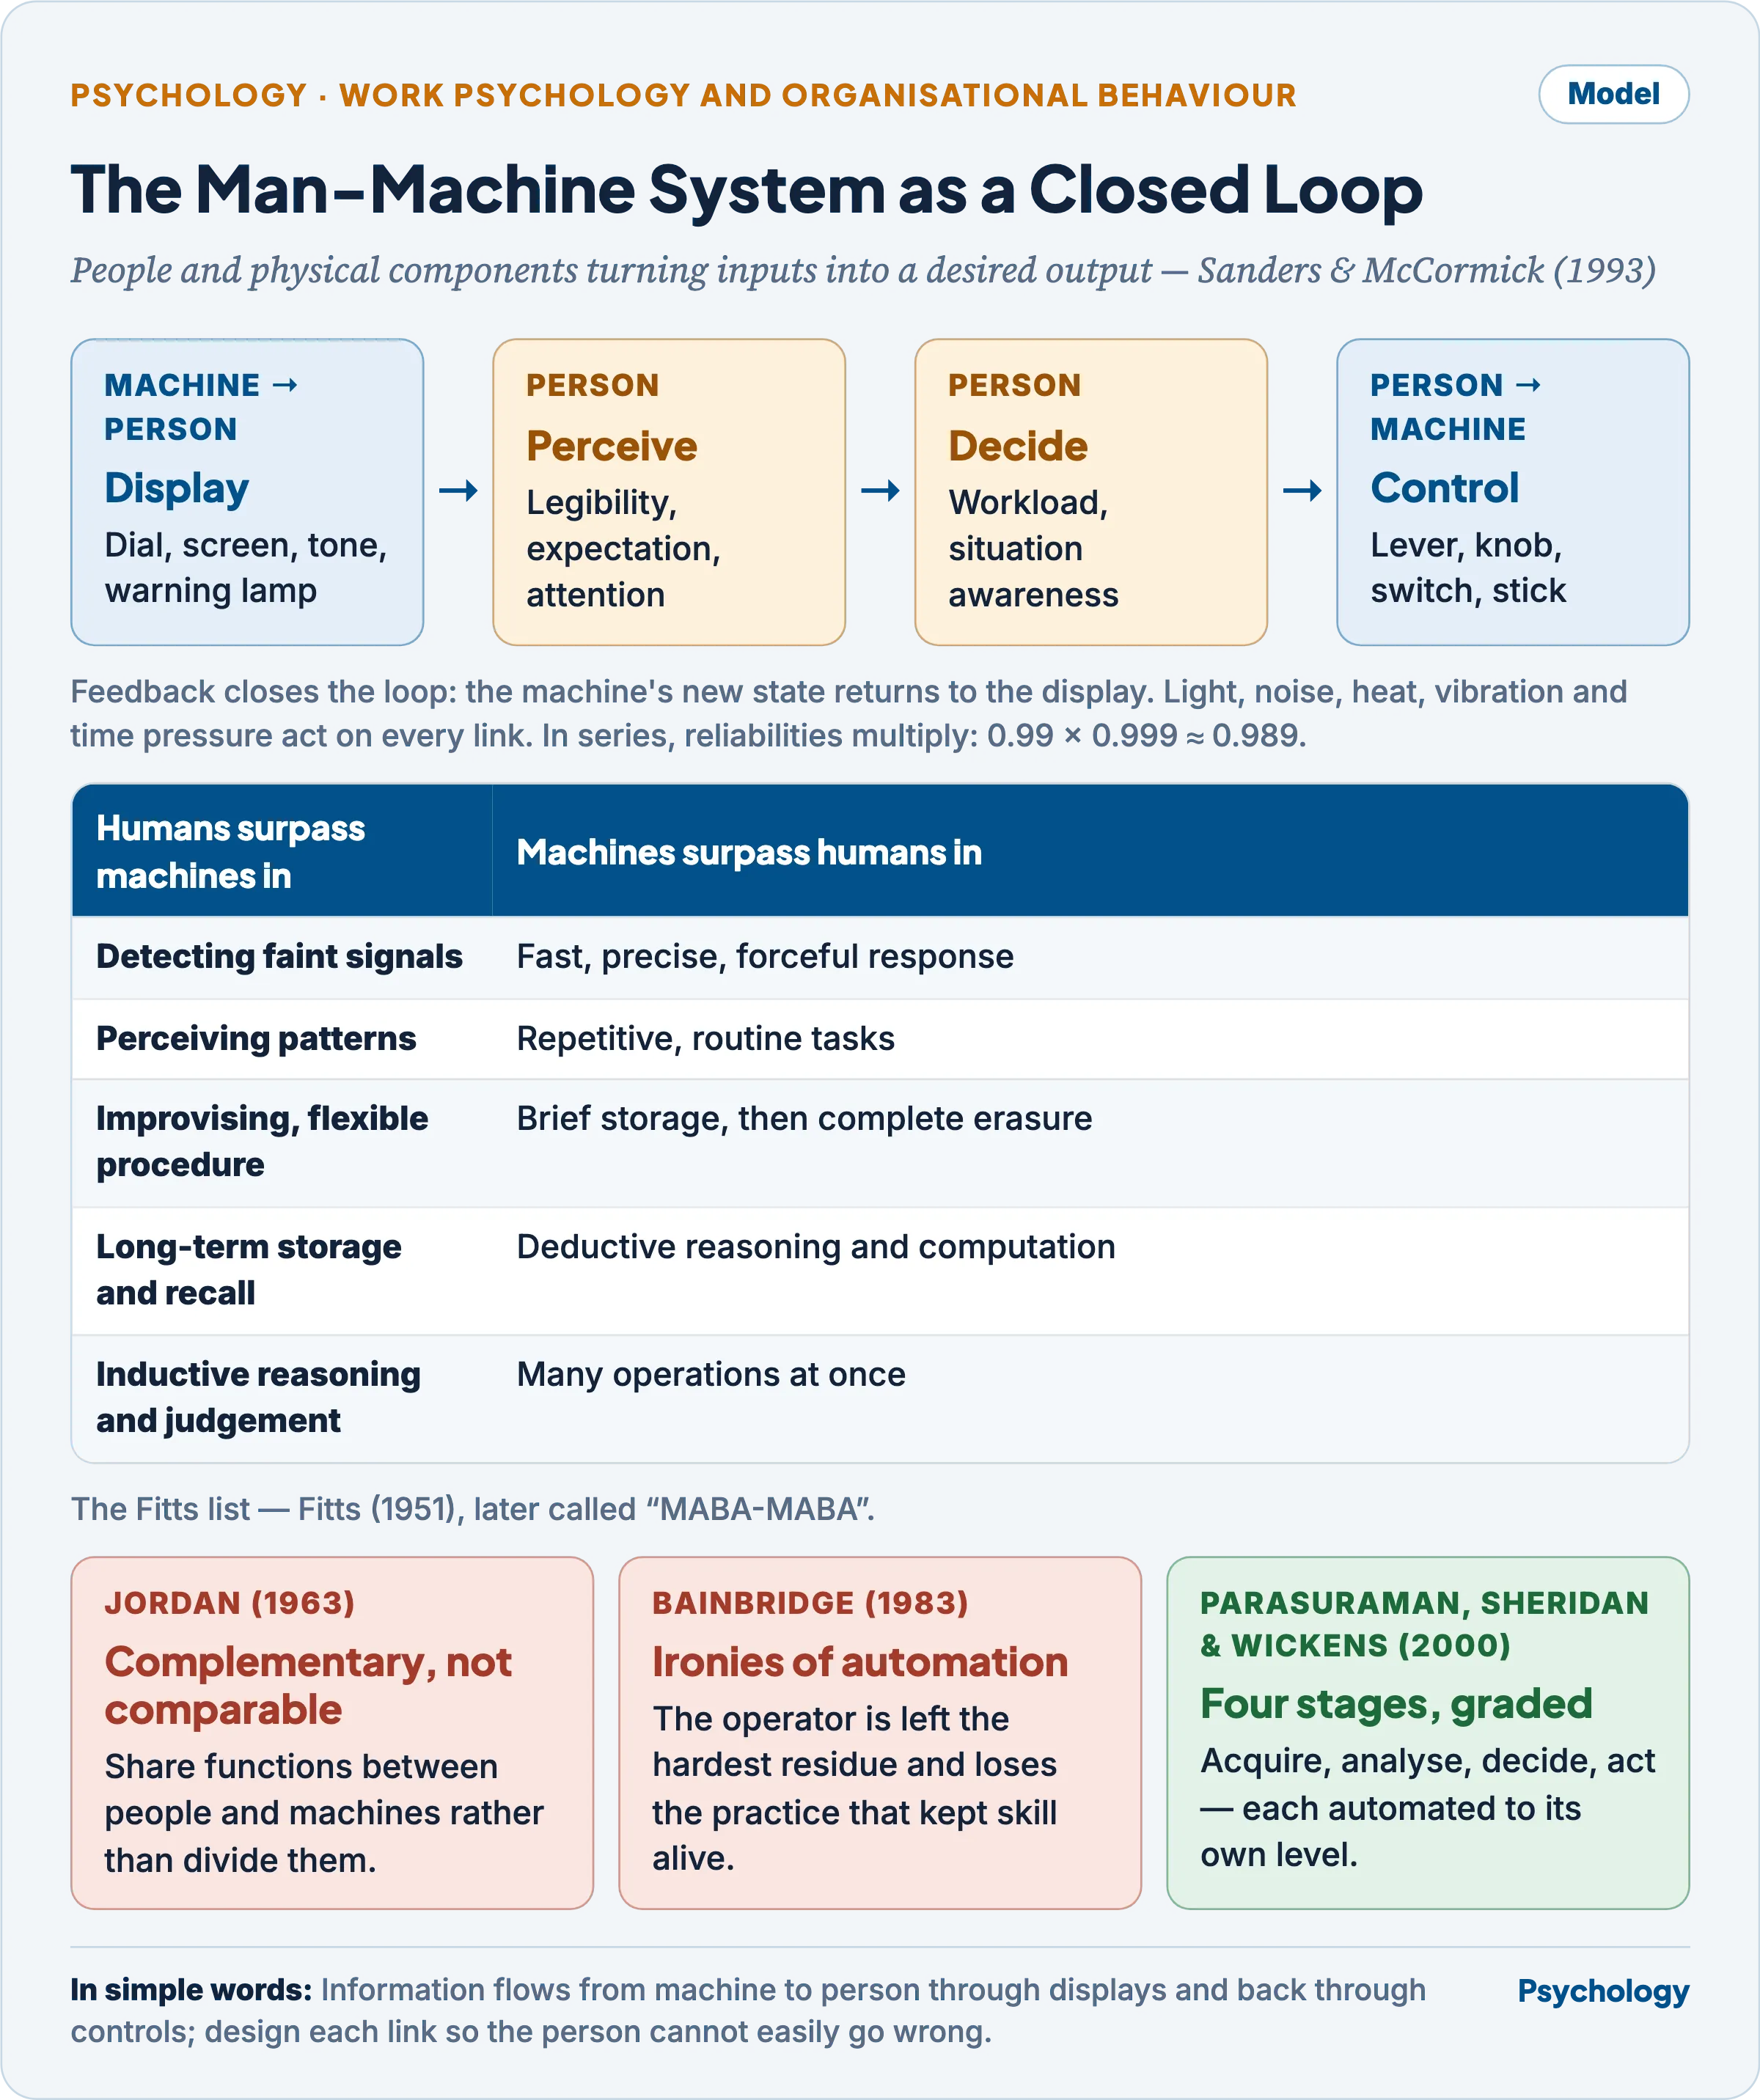
A failure anywhere on the loop — a misread dial, a mistaken control, an unnoticed alarm — looks like “human error” at the output.
Allocation of function: the Fitts list
- Fitts (1951) listed what people and machines each do better, later nicknamed “MABA-MABA” (men are better at, machines are better at).
- Humans: detecting faint signals, perceiving patterns, improvising, long-term recall, inductive reasoning, judgement.
- Machines: fast, precise force; repetitive routine tasks; brief storage with complete erasure; deductive computation; many operations at once.
- The list was soon attacked.
- Jordan (1963) argued that people and machines are complementary rather than comparable, so functions should be shared, not divided.
- Fitts (1962) later admitted that he “fell into the trap of trying to make a list”.
- Bainbridge (1983), in Ironies of Automation, showed that automating what machines do well leaves the operator the residual, hardest tasks while removing the practice that keeps manual skill alive.
- Parasuraman, Sheridan and Wickens (2000) set automation separately at four stages — information acquisition, information analysis, decision and action selection, action implementation — each at its own level.
- Parasuraman and Riley (1997) named the failures: misuse (over-reliance and complacency), disuse (switching off automation after false alarms) and abuse (automating without regard to the operator).
Compatibility and the design of controls
- Stimulus–response compatibility: Fitts and Seeger (1953) showed that speed and accuracy depend on how stimulus and response arrangements are paired, not on either alone.
- Sanders and McCormick (1993) distinguish four kinds: spatial (controls laid out like the displays they serve), movement (clockwise or upward to increase), conceptual (red for danger, symbols resembling their referents) and modality (spoken responses to auditory signals).
- Population stereotypes are the movement expectations a population shares; a design that violates one invites reversal errors.
- Chapanis and Lindenbaum (1959) built a model stove whose burners lit up in turn; participants operated the matching control as fast as they could, on four burner-control layouts.
- The staggered layout, each burner in line with its control, produced no errors; the three square layouts erred on about 6, 10 and 11 per cent of trials (Chapanis and Lindenbaum, 1959).
- Limitation: a laboratory model, where real kitchens add labels and long habit.
- Controls are coded by shape, size, colour, location, mode of operation and labelling. Fitts (1954) showed that movement time rises with the logarithm of distance over target width, so frequently used controls should be large and near.
Human engineering in designing aircraft display systems
Pilot error as display error
- Fitts and Jones (1947) separately analysed 270 errors in reading and interpreting instruments.
- Misreading the multi-pointer altimeter by 1,000 feet alone made up about 13 per cent of incidents; reversal errors — reading an indication backwards, as with the attitude indicator — made up 17 per cent (Fitts and Jones, 1947).
- Grether (1949) compared altimeter designs — one to three pointers, with and without a counter, and moving vertical scales — for speed and accuracy of reading.
- In Grether’s (1949) trials the conventional three-pointer took over 7 seconds to read and produced 11 per cent errors of 1,000 feet or more; he recommended a counter-pointer design.
- Limitation: static dials read in the laboratory, not instruments scanned under in-flight workload.
- Misreadings by 10,000 feet followed in service: a Viscount hit the ground near Prestwick in April 1958 (no deaths), a Britannia crash near Christchurch, England, killed nine that December, and a Boeing 727 lost in Lake Michigan in 1965 is believed another.
Principles of display design
- Displays serve quantitative reading (an exact value), qualitative reading (range and trend), check reading (is it normal?) and situation awareness (Sanders and McCormick, 1993). Counters suit exact values; a moving pointer shows rate and direction.
- Wickens, Lee, Liu and Gordon-Becker (2004) gathered thirteen principles in four groups.
- Perceptual: legibility; avoid absolute-judgement limits; allow for top-down expectation; redundancy gain; discriminability.
- Mental model: pictorial realism; the moving part, which should move as the operator’s model of the system moves.
- Attention: minimise information-access cost; proximity compatibility (Wickens and Carswell, 1995) — information used together is shown together; multiple resources.
- Memory: knowledge in the world rather than the head; predictive aiding; consistency.
- The attitude indicator sets two principles against each other. The inside-out display moves the horizon behind a fixed aircraft symbol, as the windscreen view does; the outside-in display moves the aircraft, obeying the moving part (Roscoe, 1968).
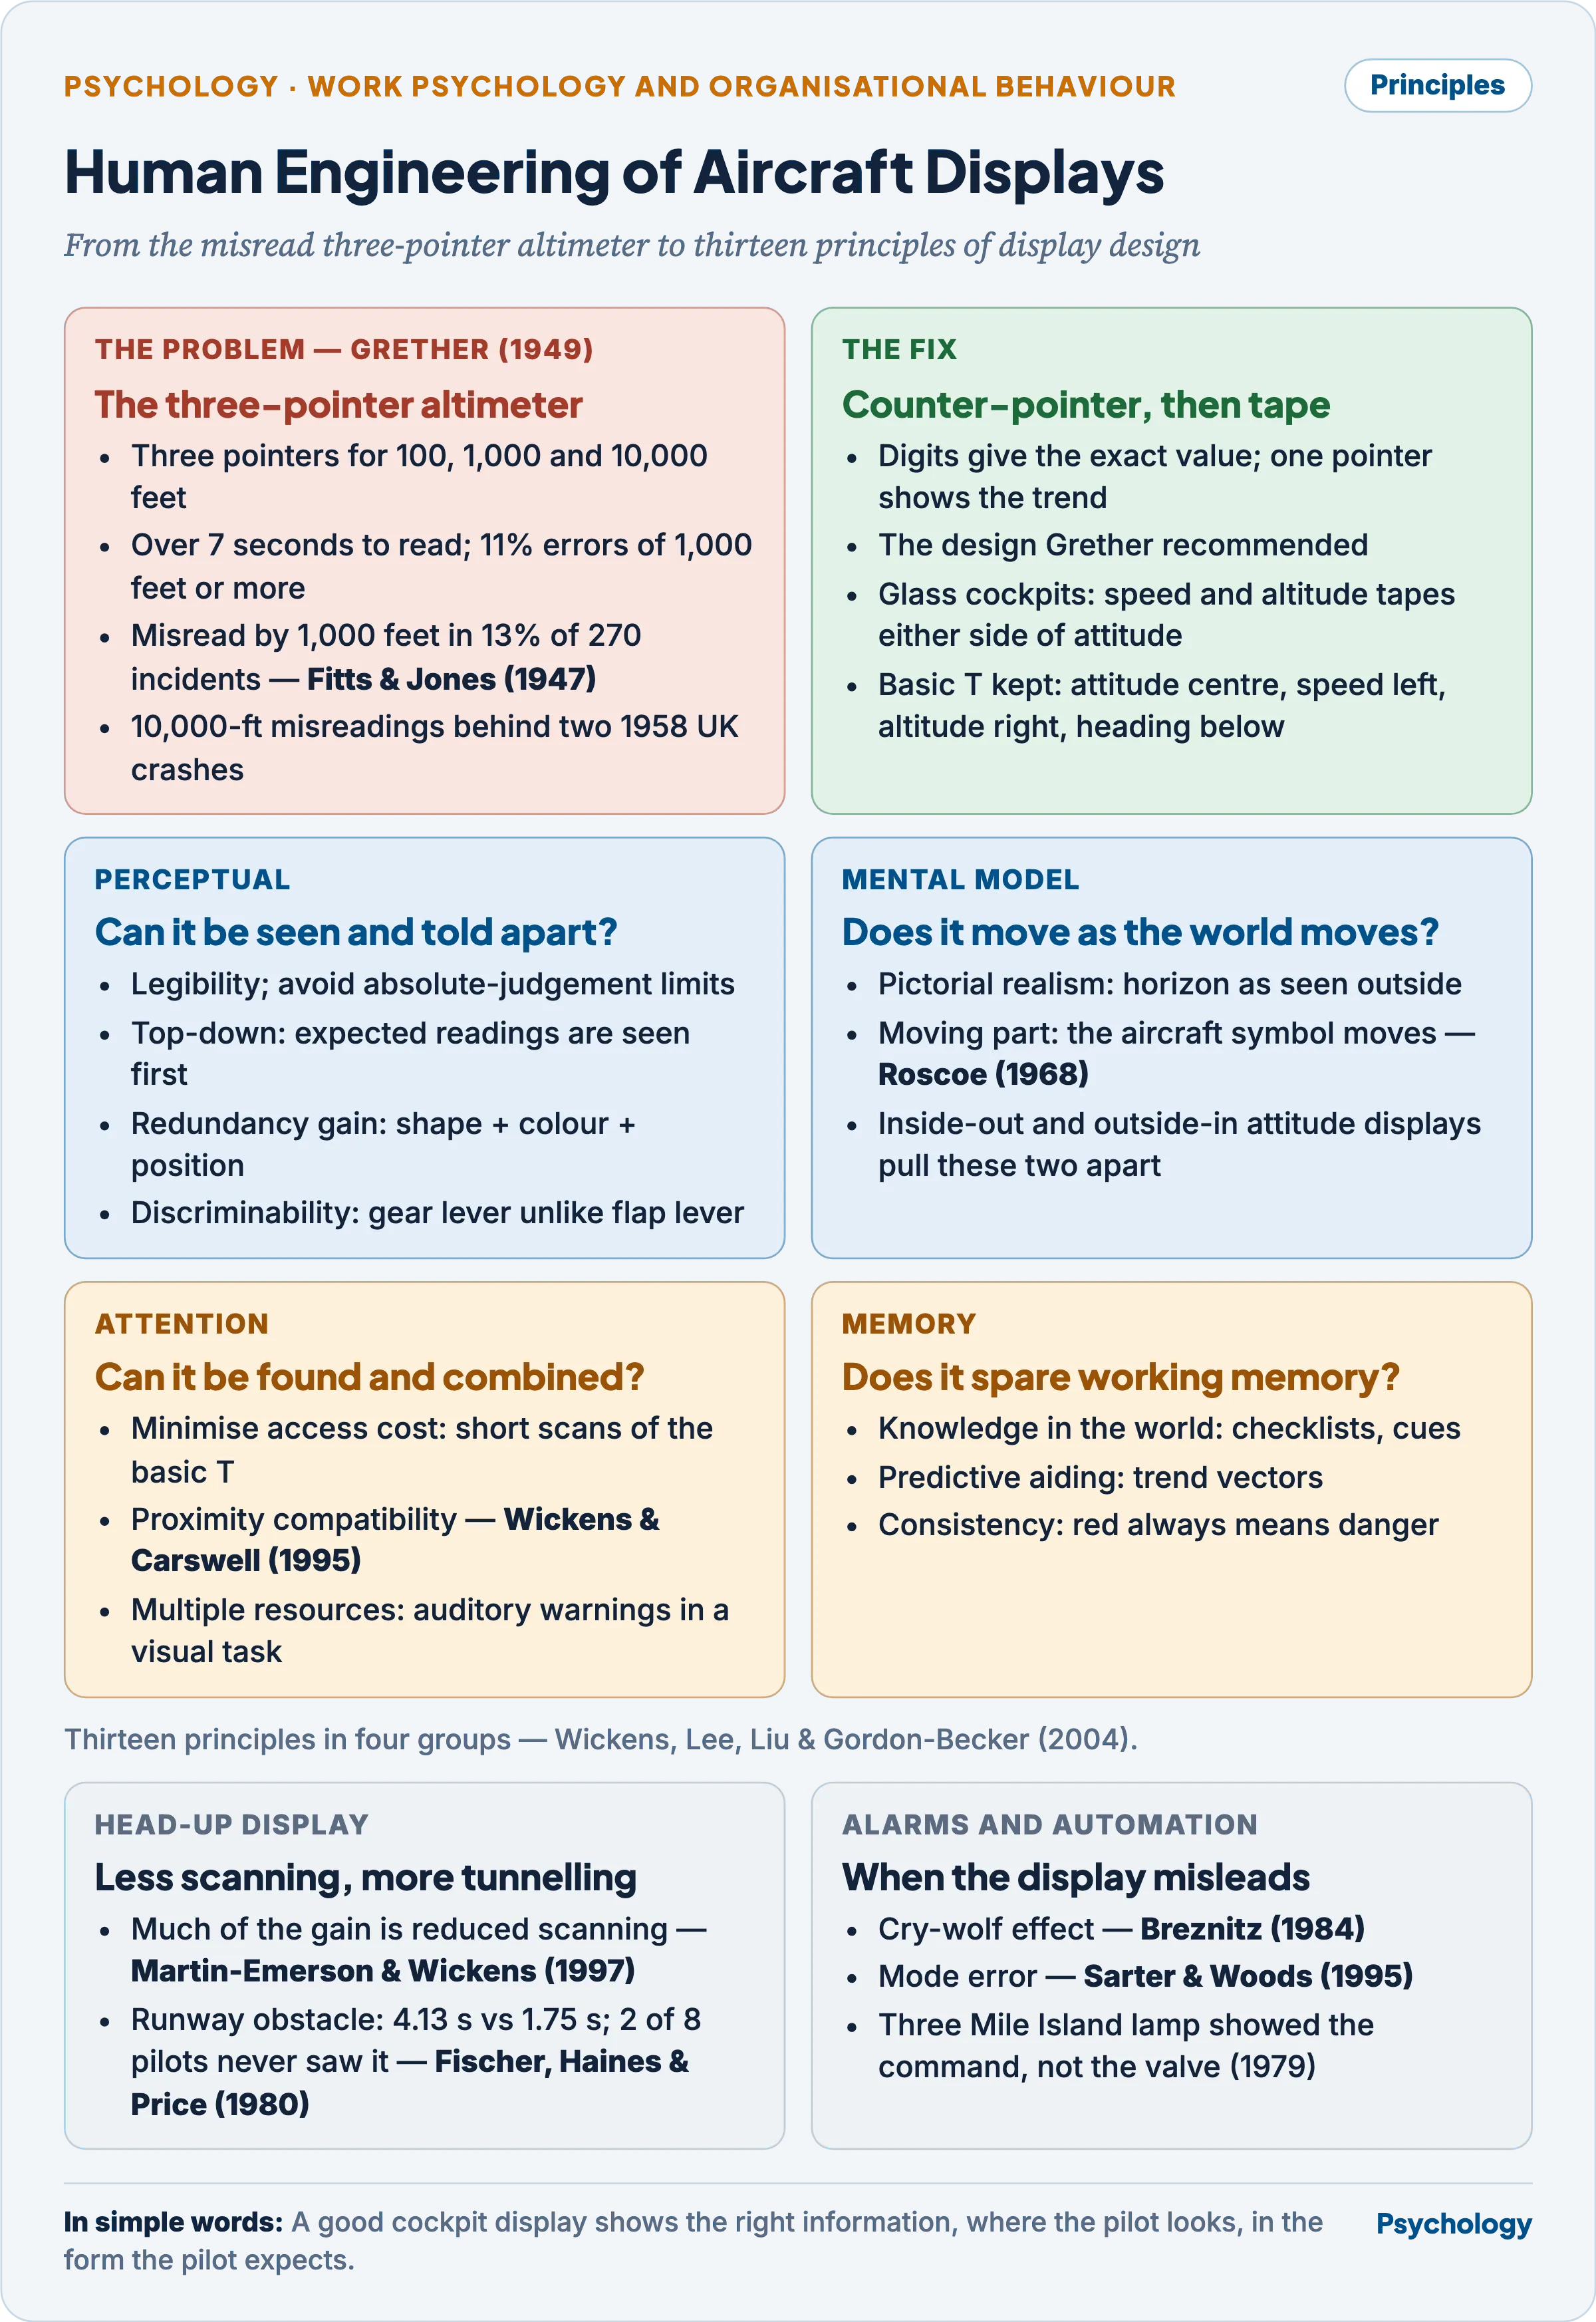
Each fix in the top-right box meets one of the four principle groups beneath it.
Layout: from the basic six to the basic T
- The Royal Air Force standardised a six-instrument blind-flying panel in 1937.
- The basic T — attitude indicator top centre, airspeed left, altimeter right, heading indicator below — became standard on American aircraft from the 1940s.
- Fitts, Milton and Jones (1949) filmed the eye fixations of forty Air Force pilots flying ground-controlled approaches: over three-quarters fell on three instruments, the directional gyro, gyro horizon and airspeed indicator.
- Hence frequency-of-use and sequence-of-use layout: instruments scanned most, and in succession, sit together.
Glass cockpits and head-up displays
- Glass cockpits put attitude and navigation on screens in the early 1980s (Airbus A310, Boeing 757 and 767); the A320 and 747-400 later replaced the remaining mechanical gauges, keeping only standby instruments.
- The primary flight display integrates attitude with speed and altitude tapes in the T arrangement and adds predictive aids such as trend vectors.
- The new cost is mode error: Sarter and Woods (1995) described pilots losing track of which automation mode was active and being surprised by what the aircraft did.
- Head-up displays project symbology focused at infinity onto a glass in the pilot’s forward view. Martin-Emerson and Wickens (1997) traced much of their advantage to reduced scanning between panel and outside world.
- Fischer, Haines and Price (1980) had eight airline pilots fly simulated Boeing 727 approaches in low visibility with and without a head-up display, introducing unexpected events.
- Response to a runway obstacle was slower with the display (4.13 against 1.75 seconds), and two pilots never saw the obstacle — attention held by the symbology, or cognitive tunnelling.
- Limitation: eight pilots in a fixed-base simulator.
Attention, workload and alarms
- Kahneman (1973) treated attention as a limited pool; Wickens (2002) divided it into multiple resources by stage, modality, code and visual channel, which is why cockpit warnings are auditory in a visual task (Attention: Factors, Theories and Failures, Paper I).
- Situation awareness, in Endsley (1995), has three levels: perceiving the elements, comprehending their meaning, and projecting their future state.
- An alarm is a detection decision: a criterion set to avoid misses produces false alarms, which teach operators to ignore alarms, the cry-wolf effect of Breznitz (1984). The decision logic is in Signal Detection Theory and Vigilance (Paper I).
- At Three Mile Island in 1979 the relief-valve lamp showed only that a close signal had been sent, not the valve’s position, so operators took a stuck-open valve for shut; the Kemeny Commission (1979) faulted the control-room design.
- On Air France 447 (2009), iced airspeed probes disconnected the autopilot; the stall warning fell silent when airspeed read below 60 knots and sounded again as the nose came down, and at one point both pilots were moving their side-sticks at once (BEA, 2012).
- Military cockpits, weapon sights and equipment for border posts are treated in Human Engineering in Defence (Unit 13).
Benefits of ergonomics in the workplace
- Fewer musculoskeletal disorders, by redesign rather than exhortation.
- The revised NIOSH equation (Waters, Putz-Anderson, Garg and Fine, 1993) starts from a 23 kg load constant and cuts it for horizontal reach, height, travel, twisting, frequency and grip; a lifting index above 1 flags risk.
- Verbeek and colleagues (2011) reviewed nine trials of 20,101 workers: lifting advice and training, with or without lifting aids, did not prevent back pain.
- Workstation and computer work.
- Rempel and colleagues (2006) randomised 182 call-centre operators for a year to training alone or training plus a trackball, a wide forearm support, or both.
- The forearm support halved incident neck and shoulder disorders (hazard ratio 0.49) and was predicted to repay its cost in 10.6 months.
- Limitation: a single company, and pain was self-rated.
- Amick and colleagues (2003): a highly adjustable chair with training slowed the growth of symptoms across the workday; training alone did not.
- Sharan and colleagues (2011) surveyed 4,500 Indian IT professionals: 63 per cent reported pain, linked to few breaks, deadline pressure and daily hours at the computer.
- Rempel and colleagues (2006) randomised 182 call-centre operators for a year to training alone or training plus a trackball, a wide forearm support, or both.
- The physical environment.
- The Hawthorne illumination studies (1924–1927) are said to show output rising whether light rose or fell; re-analysing the data, Levitt and List (2011) found no such pattern, only hints of an observation effect.
- Venugopal, Latha and Shanmugam (2026) measured heat (wet-bulb globe temperature) for 1,560 outdoor workers in 11 Tamil Nadu districts: readings exceeded 30 °C, and high exposure carried a 1.4-fold risk of self-reported productivity loss.
- Working time. Folkard and Tucker (2003) showed safety falling across successive night shifts, with longer hours and with longer spells between breaks. Strain and burnout are treated in Occupational Stress and Its Management.
- Error reduction. Reason (2000) contrasted the person approach (blame and retrain) with the system approach (defences in depth); ergonomics supplies the defences — interlocks, shape-coded controls, displays of state rather than command.
- Economics. Goggins, Spielholz and Nothstein (2008) compiled 250 case studies: fewer disorders, lost workdays and compensation costs, gains in productivity and quality, and payback typically within a year — Hendrick (1996): “Good Ergonomics Is Good Economics”.
- Participation. Sommer (1983) argued for social design, planning settings with their users and giving them control; participatory ergonomics applies this at work.
- Trist and Bamforth (1951) showed that mechanised longwall mining broke up self-regulating work groups, the founding case of sociotechnical design.
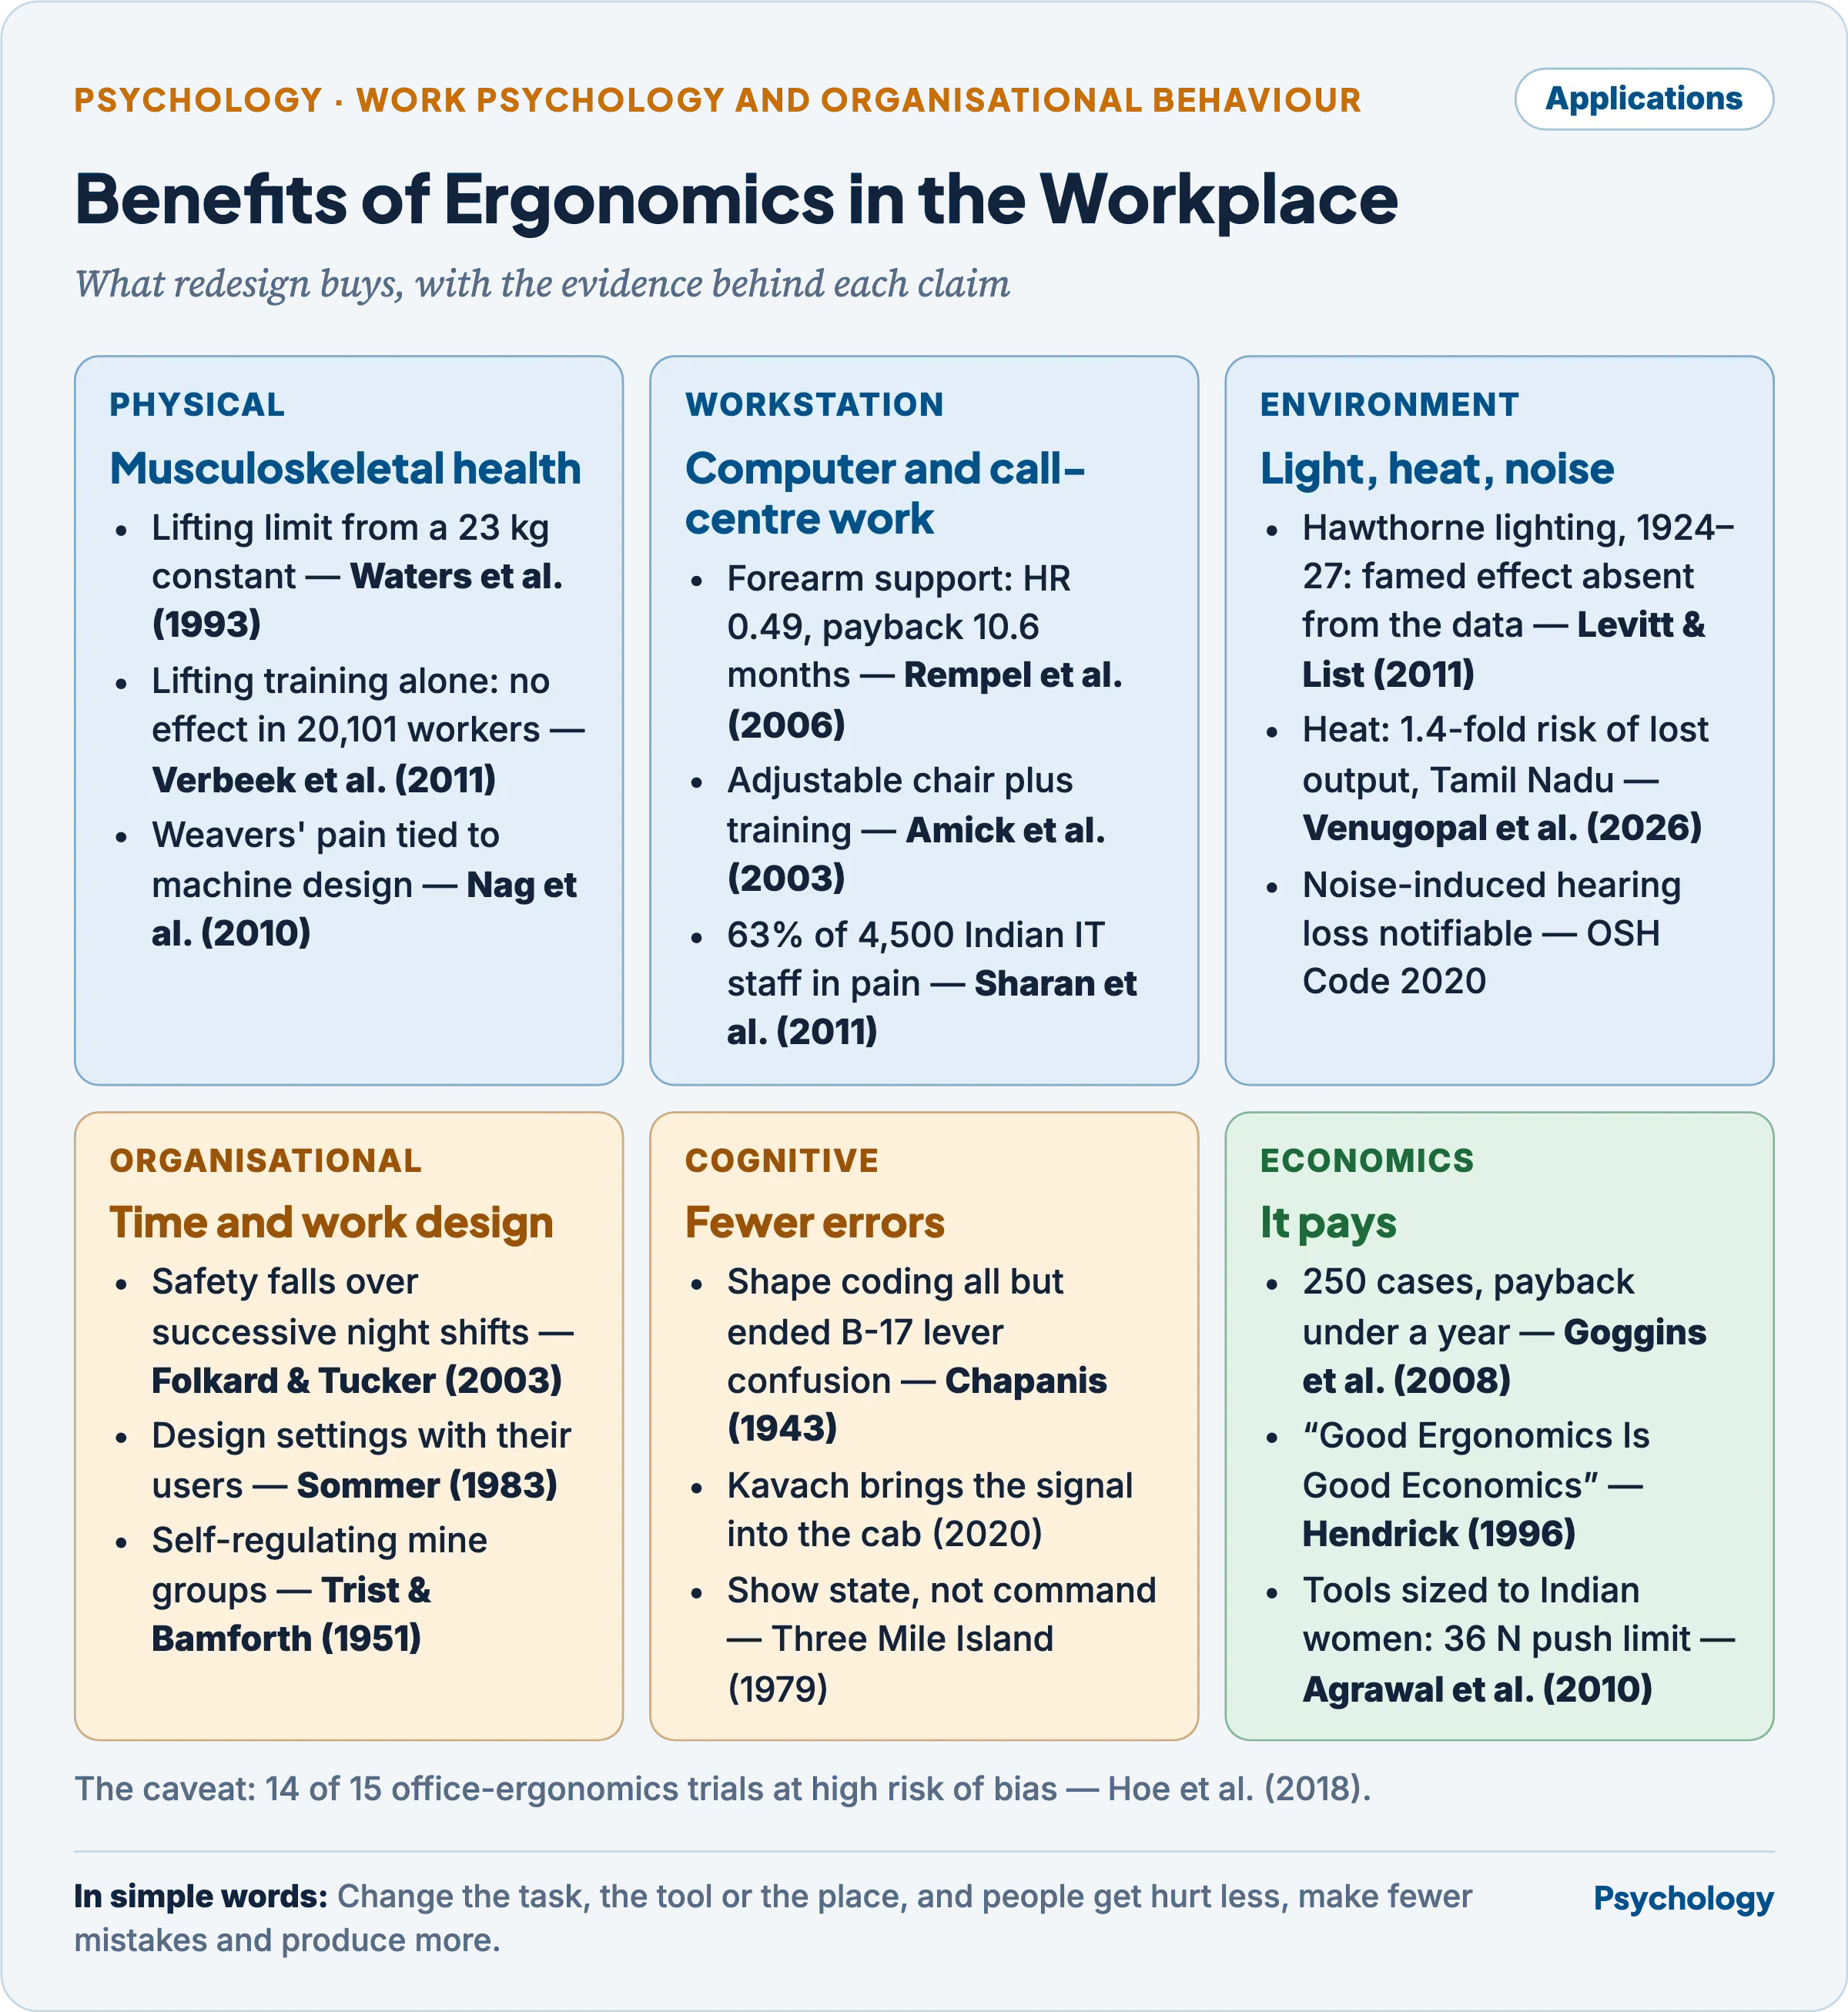
The interventions that worked changed the task or the equipment; the ones that only instructed the worker did not.
Criticisms and limitations
- A thin trial base. Hoe and colleagues (2018) found 15 trials of office ergonomics (2,165 workers), 14 at high risk of bias; only arm support with an alternative mouse gave moderate-quality benefit (risk ratio 0.52 for neck and shoulder disorders).
- The laboratory, not the field. Of 90 heat-stress intervention studies, 68 per cent were laboratory-based and 73 per cent came from developed countries (Venugopal and colleagues, 2026).
- Automation moves error rather than removing it: Bainbridge’s ironies, mode error and complacent misuse are all products of design, and the Fitts list treats capacities as fixed when machines change every decade.
- Imported and average bodies. Western anthropometric tables misfit Indian users, and the average fits nobody: of 4,063 US airmen, Daniels (1952) found none in the middle 30 per cent on all ten dimensions. Design spans the 5th to 95th percentile of actual users.
- “Human error” is a hindsight label. Pushed too far, the design account can neglect deliberate violations, and the production pressure and management decisions that Reason (2000) places upstream as latent conditions.
- Reach. Most Indian workers are in the informal sector, where no employer designs a workstation, so the evidence covers a minority of Indian work.
Indian context
- The Indian Society of Ergonomics grew out of the First National Seminar on Ergonomics (Calcutta, 1972) and R. N. Sen’s (1979) Indian Science Congress address on ergonomics in national development; agreed on in 1983, it was founded at NIOH, Ahmedabad, on 13 January 1987.
- ICMR’s National Institute of Occupational Health, Ahmedabad, began in 1966 and took its name in 1970.
- Nag, Vyas and Nag (2010) studied 516 power-loom and hand-loom weavers: among hand-loom weavers, poor machine design (odds ratio 2.2) and mental overload (5.7) predicted pain; women were more prone to back disorders.
- AICRP on Ergonomics and Safety in Agriculture (ICAR, Central Institute of Agricultural Engineering, Bhopal) built India’s farm-worker anthropometric and strength database.
- Agrawal, Tiwari, Gite and Bhushanababu (2010) measured 1,701 Madhya Pradesh farm workers: mean stature 1,649 mm (men) and 1,519 mm (women); frequent-push limits of 45 N and 36 N, the design ceiling for weeders and decorticators.
- Chakrabarti (1997), at the National Institute of Design, Ahmedabad, compiled Indian Anthropometric Dimensions for Ergonomic Design Practice.
- Indian Railways. Since 2014, 7,286 three-phase locomotives have been built with ergonomic seats and driver desks (719 before), and new locomotives have had air-conditioned cabs since 2017–18 (Rajya Sabha reply; PIB, 26 July 2024).
- Kavach (Ministry of Railways; developed by RDSO; national automatic train protection from July 2020, version 4.0 approved July 2024) — an in-cab display of movement authority, target speed, distance and signal aspect, braking automatically before a danger signal or on overspeed.
- In service on over 2,200 route kilometres by February 2026 (PIB, 6 February 2026).
- It operationalises knowledge in the world (the signal comes into the cab, even in fog) and allocation of function, with the machine as backstop.
- RDSO is developing TRI-Netra, an enhanced-vision system combining optical and infra-red cameras with radar or lidar ranging, for loco pilots in fog and rain (PIB, 12 March 2026).
- Occupational Safety, Health and Working Conditions Code, 2020 (Ministry of Labour and Employment; in force from 21 November 2025; consolidates 13 central Acts including the Factories Act, 1948).
- Mechanism: national standards on physical, chemical and biological hazards; employer duties on lighting, ventilation, temperature and overcrowding; seating for workers obliged to stand.
- Noise-induced hearing loss is a notifiable disease (Third Schedule), and workers over 40 get a free annual health check-up (PIB, 21 November 2025).
- It operationalises control at the source: the workplace is made safe rather than the worker made tougher.
Previous Year Questions
- 2024What is ergonomics? Explain the benefits of ergonomics in the work place with suitable examples.
- 2017What is man-machine system? In this context, explain the applications of human engineering in designing the display systems of the aircrafts.