

- Automobile joins two words: auto (self) and mobile (movable). The term means a vehicle that moves without the help of human or animal force, carrying goods and passengers by road, track, water or air in the widest sense. In the industry the word means road vehicles.
- The industry is a key part of India’s manufacturing industry. Its deep linkages give it a strong multiplier effect: steel, tyres, batteries, glass, plastics, paint, textiles and electronics all feed it.
- It produced 3.47 crore vehicles in 2025-26, and domestic sales reached a record 2.83 crore.
- Today its geography is one of market-and-port clusters, around Chennai, Pune and Gurugram, with Gujarat emerging.
Automobile Industry in India
Growth and Development
- Before Independence there was no real industry, only assembly from imported parts:
- General Motors (India) Ltd: trucks and cars at Mumbai from 1928.
- Ford Motor Co. (India) Ltd: cars and trucks at Chennai from 1930 and at Mumbai from 1931.
- The real start: Premier Automobiles Ltd opened at Kurla (Mumbai) in 1947, followed by Hindustan Motors Ltd at Uttarpara near Kolkata in 1948.
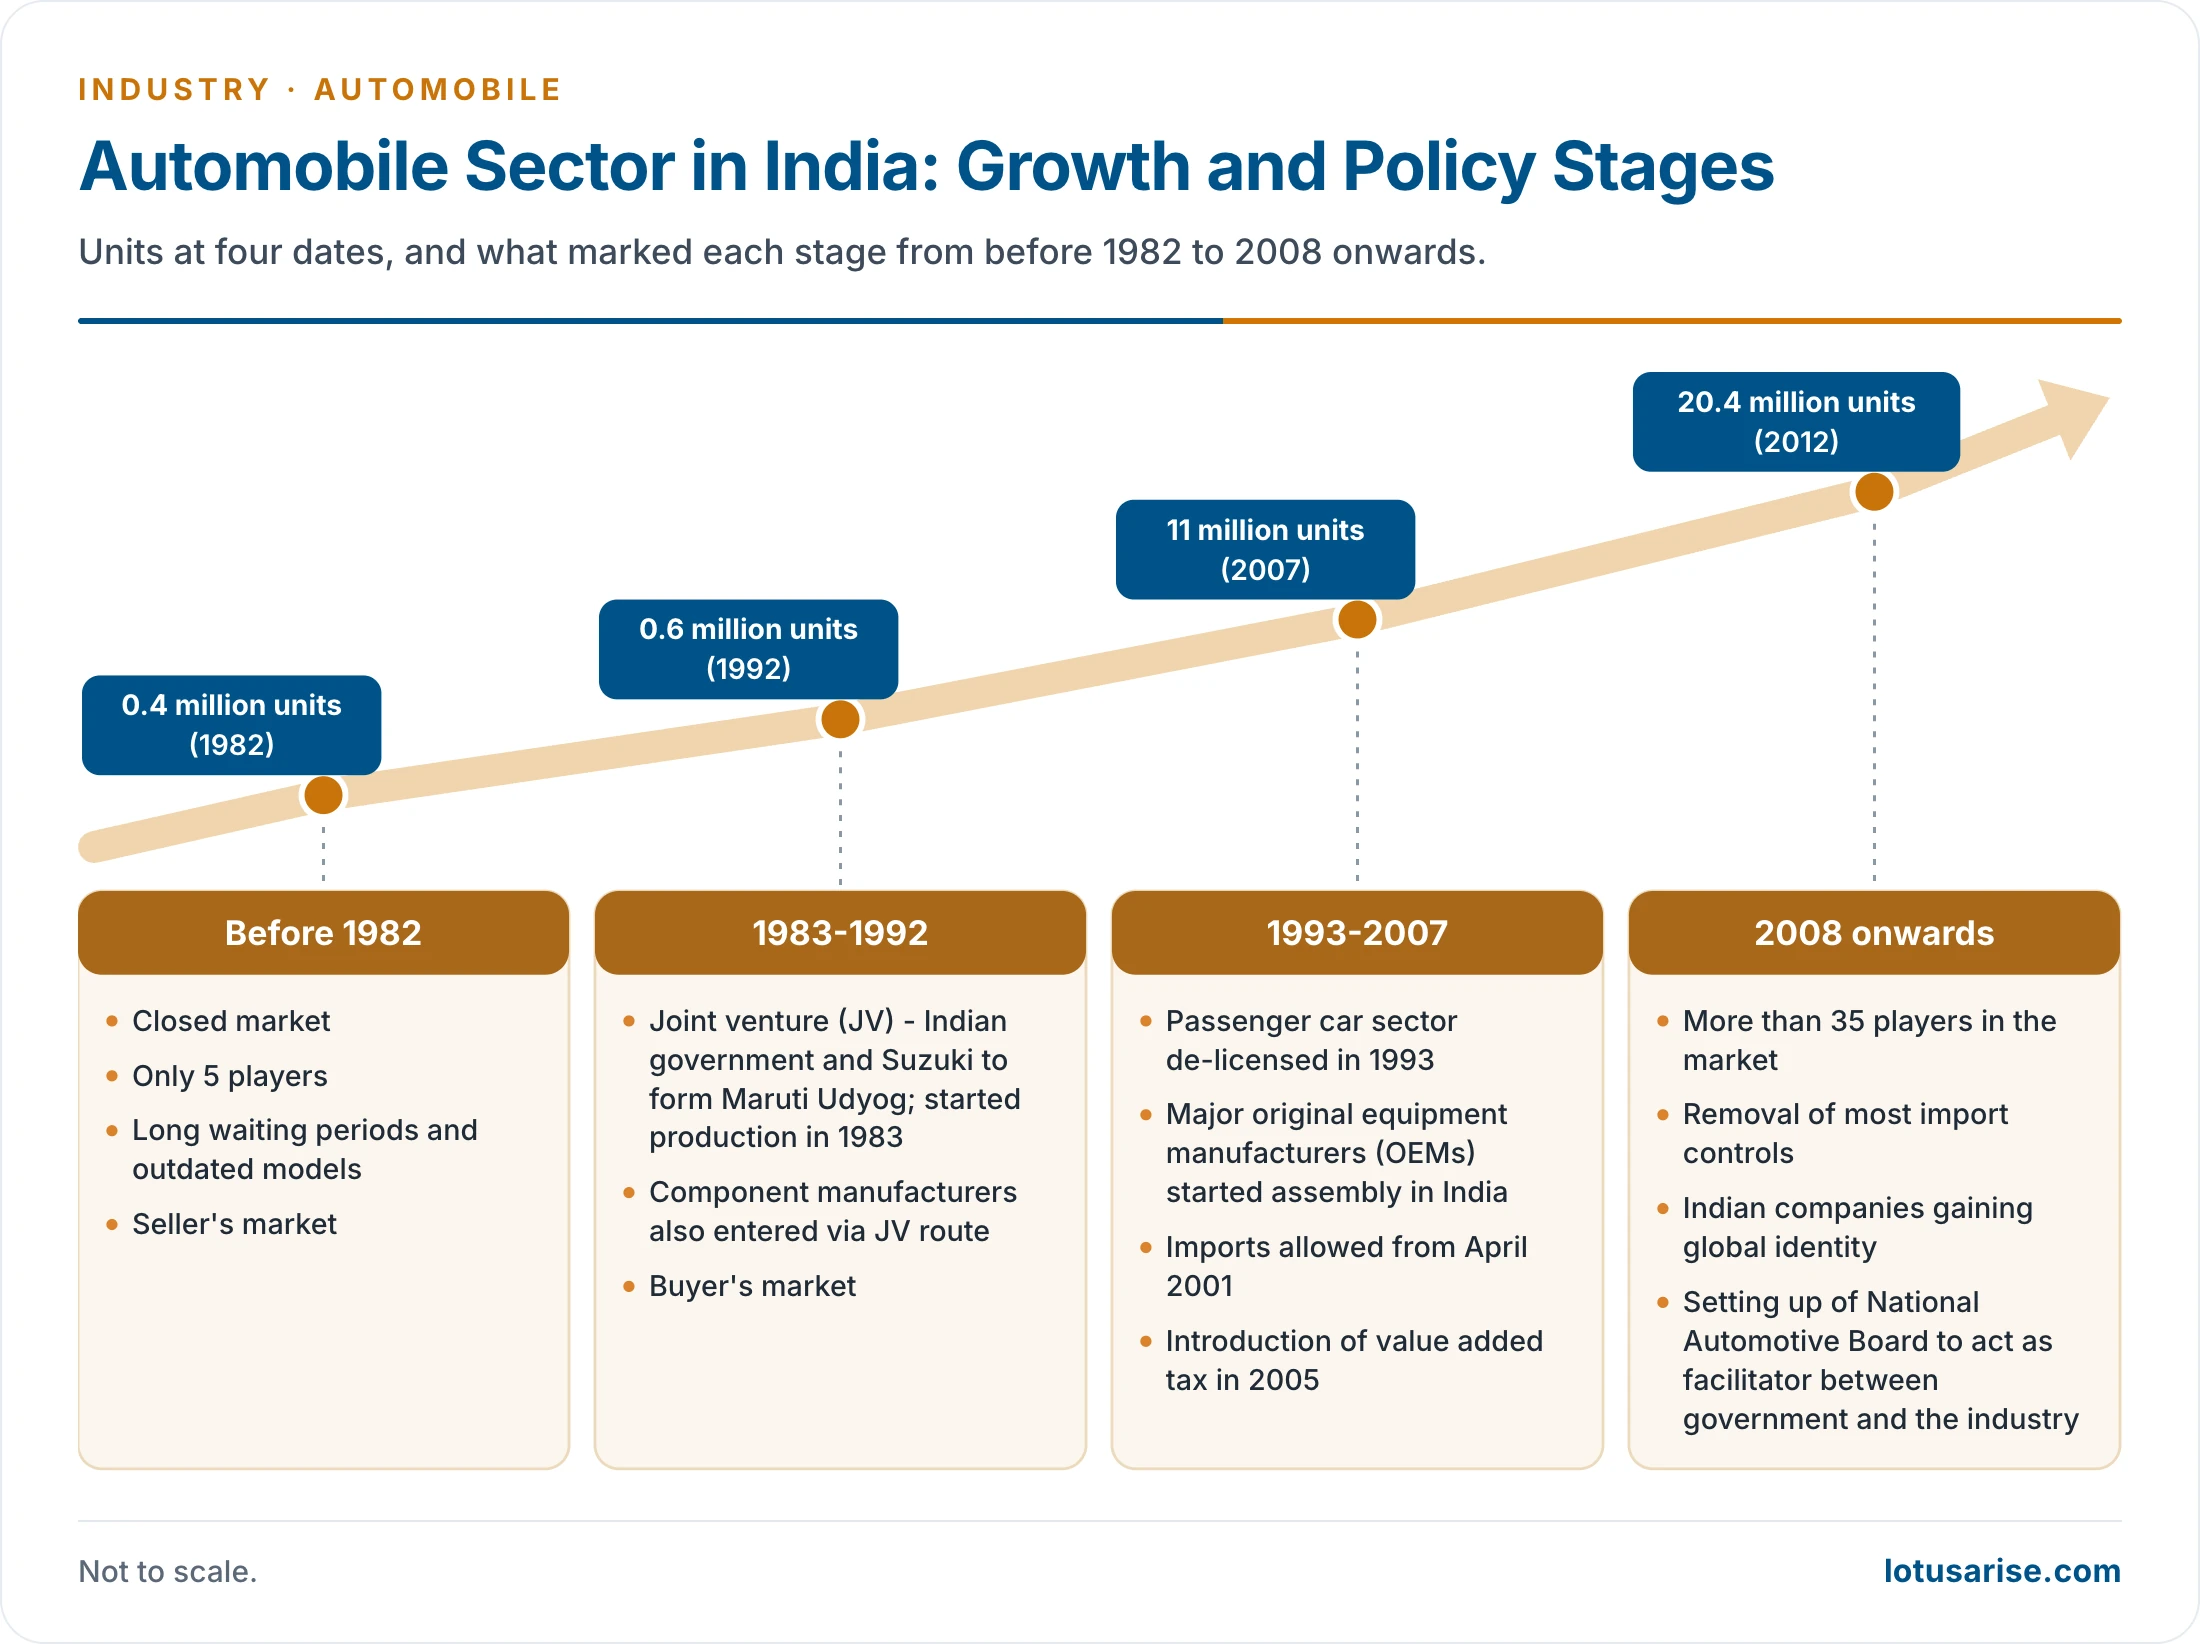
- Closed market to 1982: only 5 players, long waiting lists and old models.
- 1983: Maruti Udyog, a joint venture of the government and Suzuki, started production.
- After 1991: liberalisation brought in more makers. The industry was delicensed in 1991, and passenger cars in 1993.
- Today it is among the most vibrant sectors of the economy, and has been called a sunrise sector. It grew about 12–15% a year in the decade before 2008-09, when the world slowdown hit it, and then recovered.
- Number of makers (older count): 15 of passenger cars and multi-utility vehicles, 9 of commercial vehicles, 14 of two and three-wheelers, 14 of tractors and 5 of engines, or about 38 vehicle units in all.
| Measure | 1992-93 to 2003-04 | Early 2010s | 2025-26 |
|---|---|---|---|
| Investment and turnover | Over ₹50,000 crore invested; turnover over ₹1,00,000 crore (2003-04) | – | Contribution to the economy put at over ₹22.75 lakh crore |
| Employment | 4.5 lakh direct, about 1 crore indirect | 13.1 million | Over 30 million |
| Share of GDP | 2.77% (1992-93) to 4.7% (2002-03) | Nearly 6% | – |
| Share of taxes | – | Nearly 20% of indirect taxes | About 15% of GST |
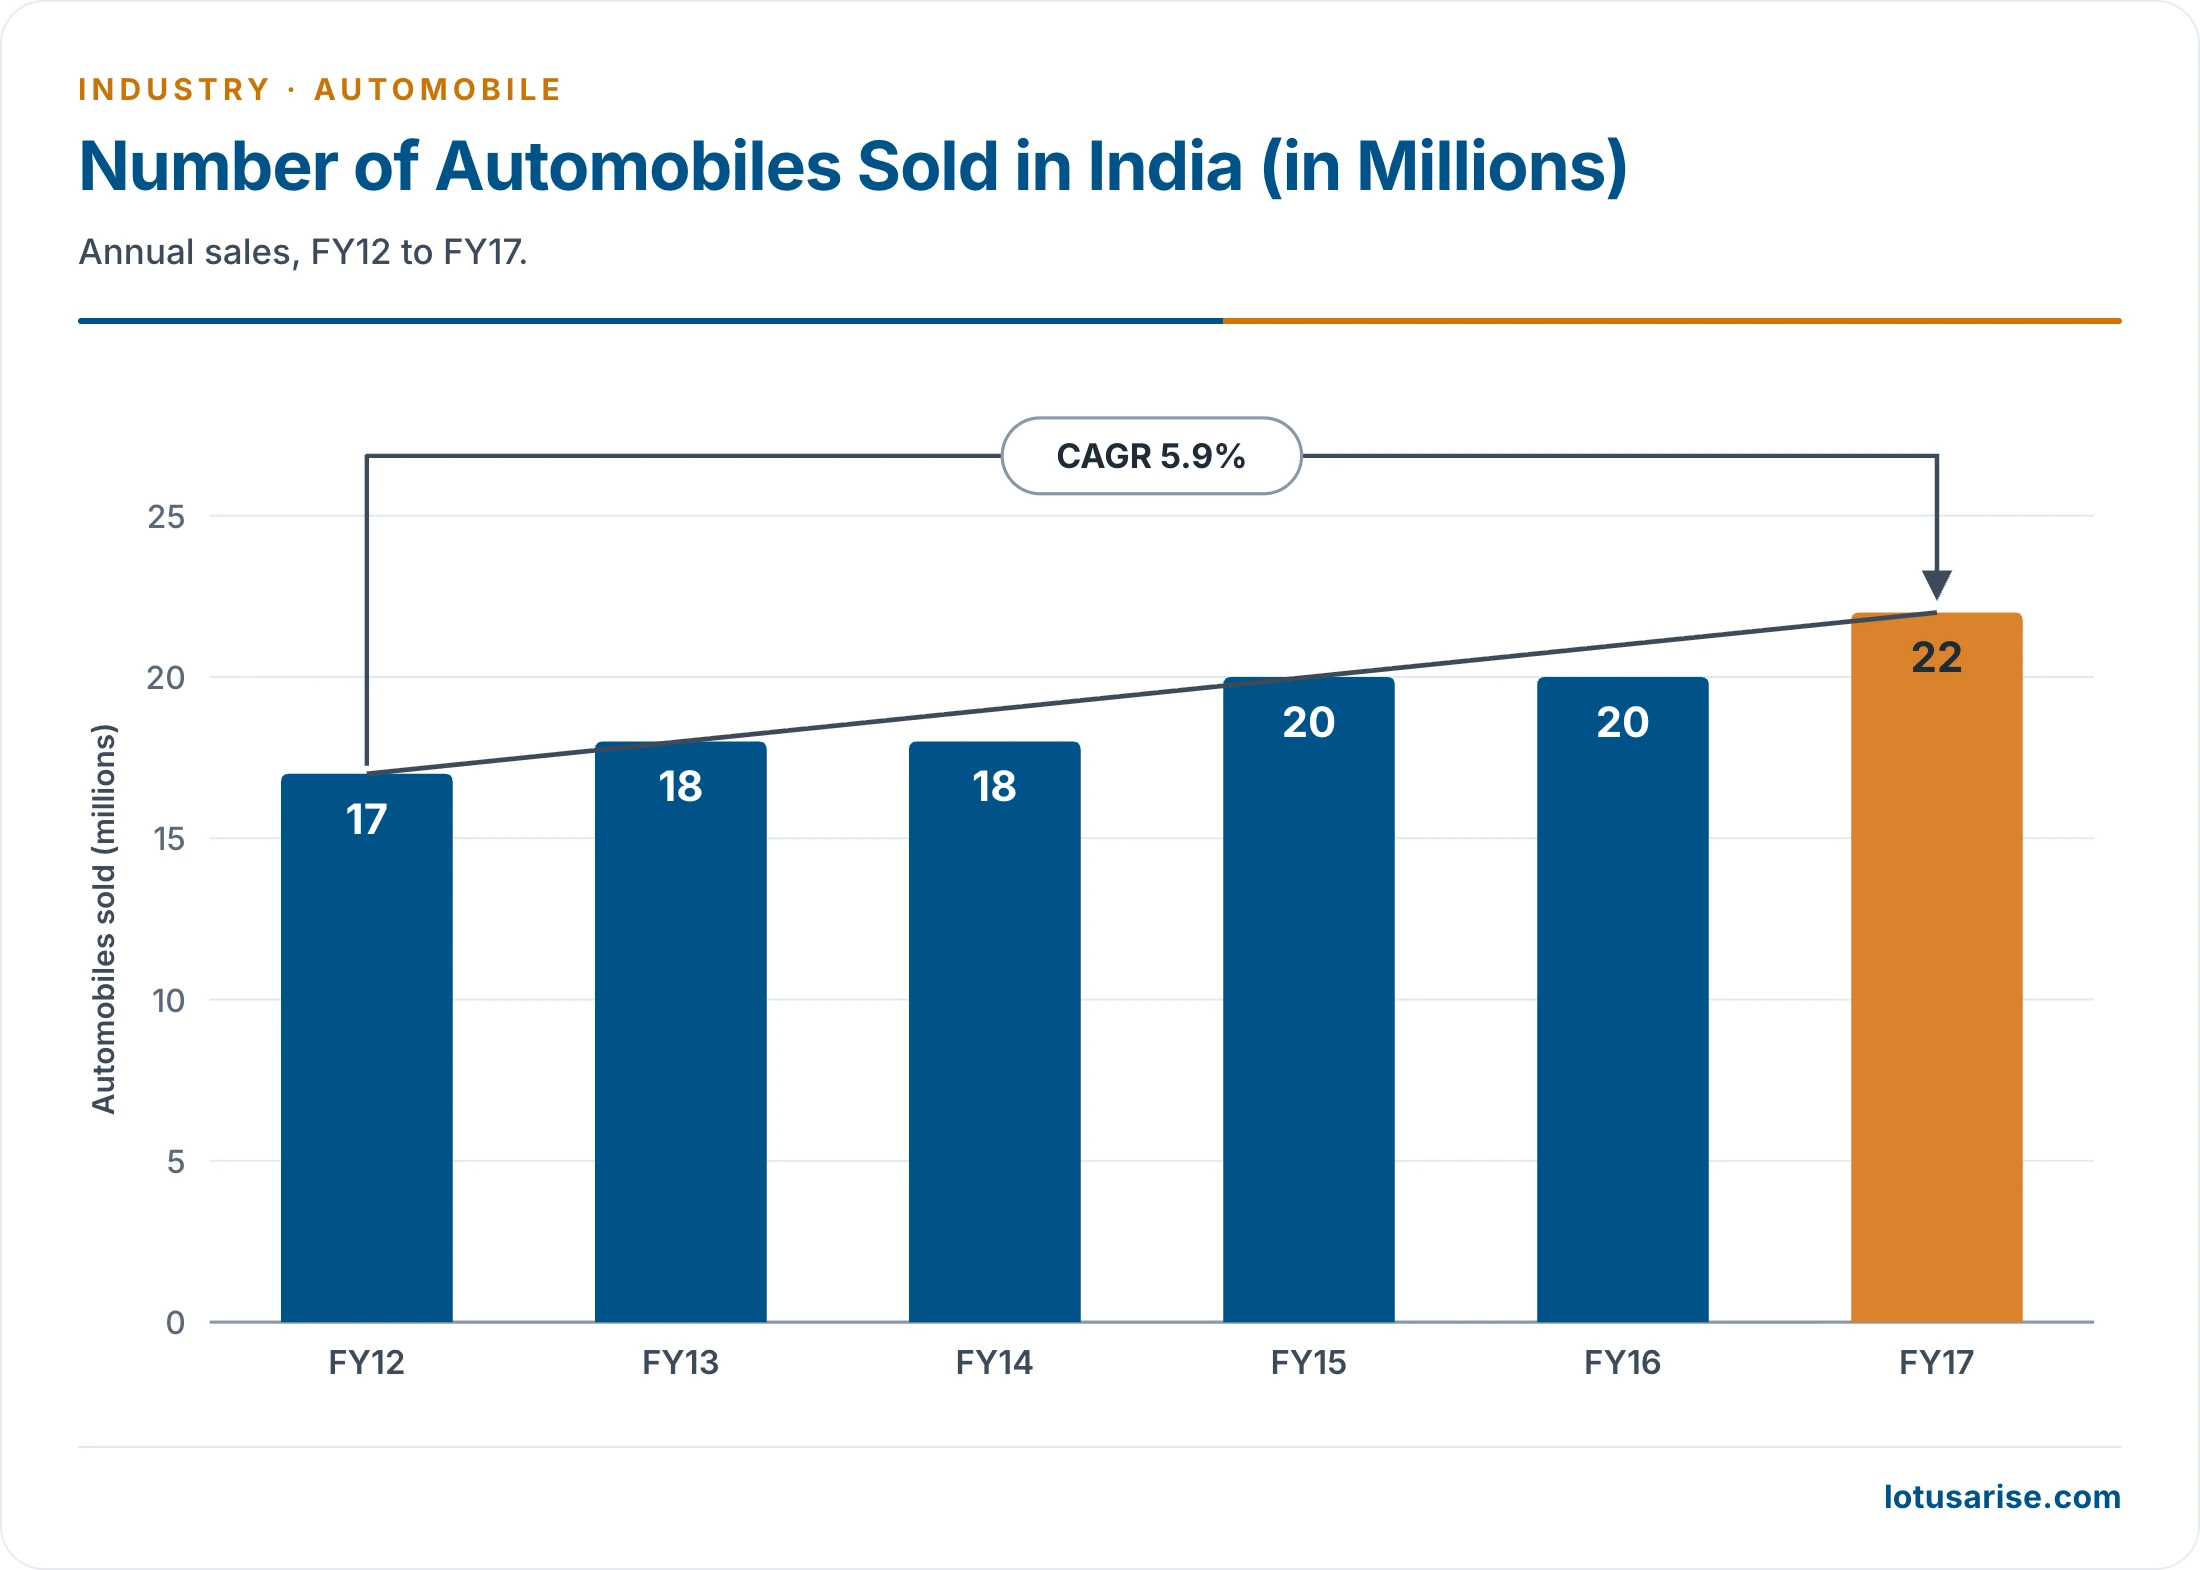
- This chart stops at 22 million units in 2016-17. Domestic sales reached 2.83 crore (28.3 million) in 2025-26.
Location Factors
- Raw materials from other industries: it uses the finished products of metallurgical industry, along with steel, non-ferrous metals, window glass, plastics, rubber, wood, paint, textiles, electronic cables and seat cushions.
- Assembly line logic: mass production needs a continuous supply of spare parts and materials, which draws suppliers close.
- Steel: being the basic input, it first pulled the industry towards iron and steel centres, as at Jamshedpur.
- Ancillaries: nearby makers of tyres, tubes, storage batteries and paints add to the advantage.
- Ports: port cities suit imports and exports. Chennai, Mumbai and Kolkata gained this way.
- Market: the industry has grown market-oriented, and prefers places with ready demand.
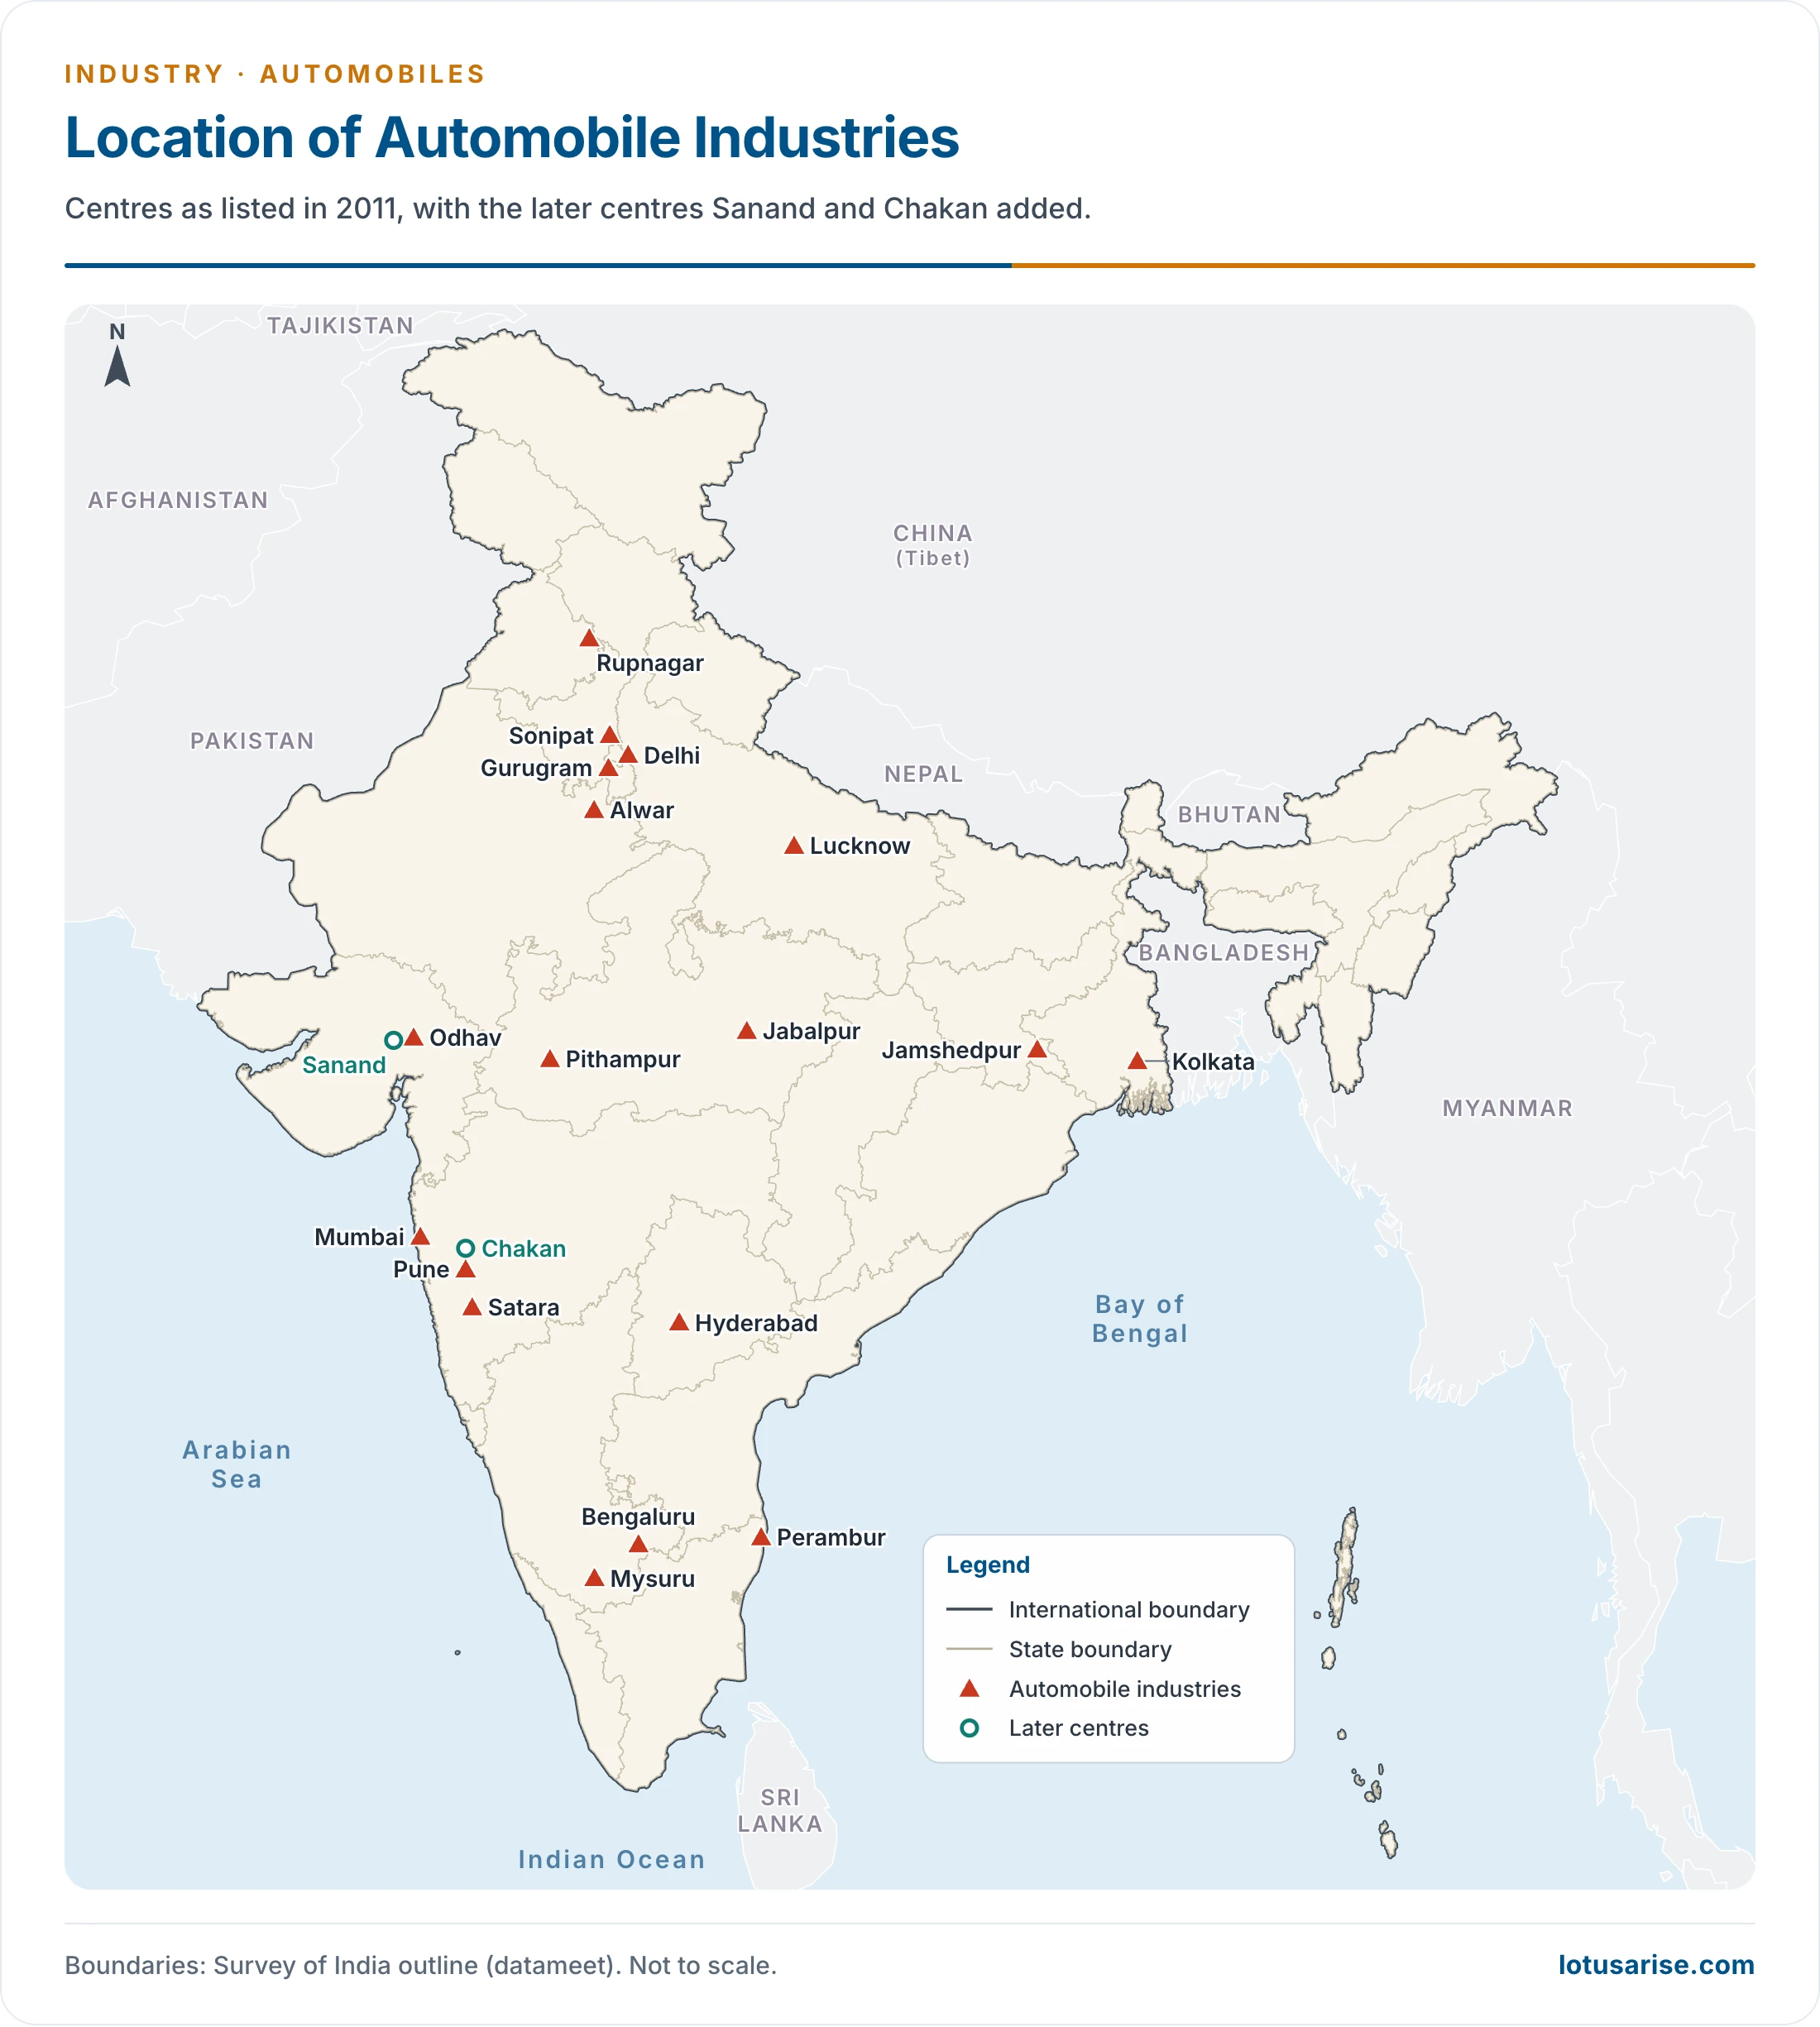
- Government policy: plans for decentralisation gave priority to some remote and backward areas. State incentives and land now do much of this work, as at Pithampur and Sanand.
- Labour: cheap and also skilled labour.
- Path dependence: one anchor firm draws a ring of suppliers, and this keeps a cluster growing. Maruti did so at Gurugram.
Automobile Clusters
- Three big clusters dominate, and in 2010 they held about 35% (Chennai), 33% (Mumbai–Pune) and 30% (National Capital Region) of revenue.
| Cluster | Main centres | Anchor firms | Why it grew |
|---|---|---|---|
| South: Chennai | Sriperumbudur, Irungattukottai, Oragadam, Maraimalai Nagar, Ennore, Tiruvottiyur | Hyundai, Renault-Nissan, Daimler, Ashok Leyland, Royal Enfield, BMW | Three ports, export access, skilled labour, State policy; older Ford and Ashok Leyland base |
| West: Mumbai–Pune | Kurla, Pimpri, Chakan, Talegaon, Akurdi, Satara, Aurangabad, Nashik | Mahindra, Tata Motors, Bajaj, Hyundai | Mumbai’s port and market, engineering base, labour pool |
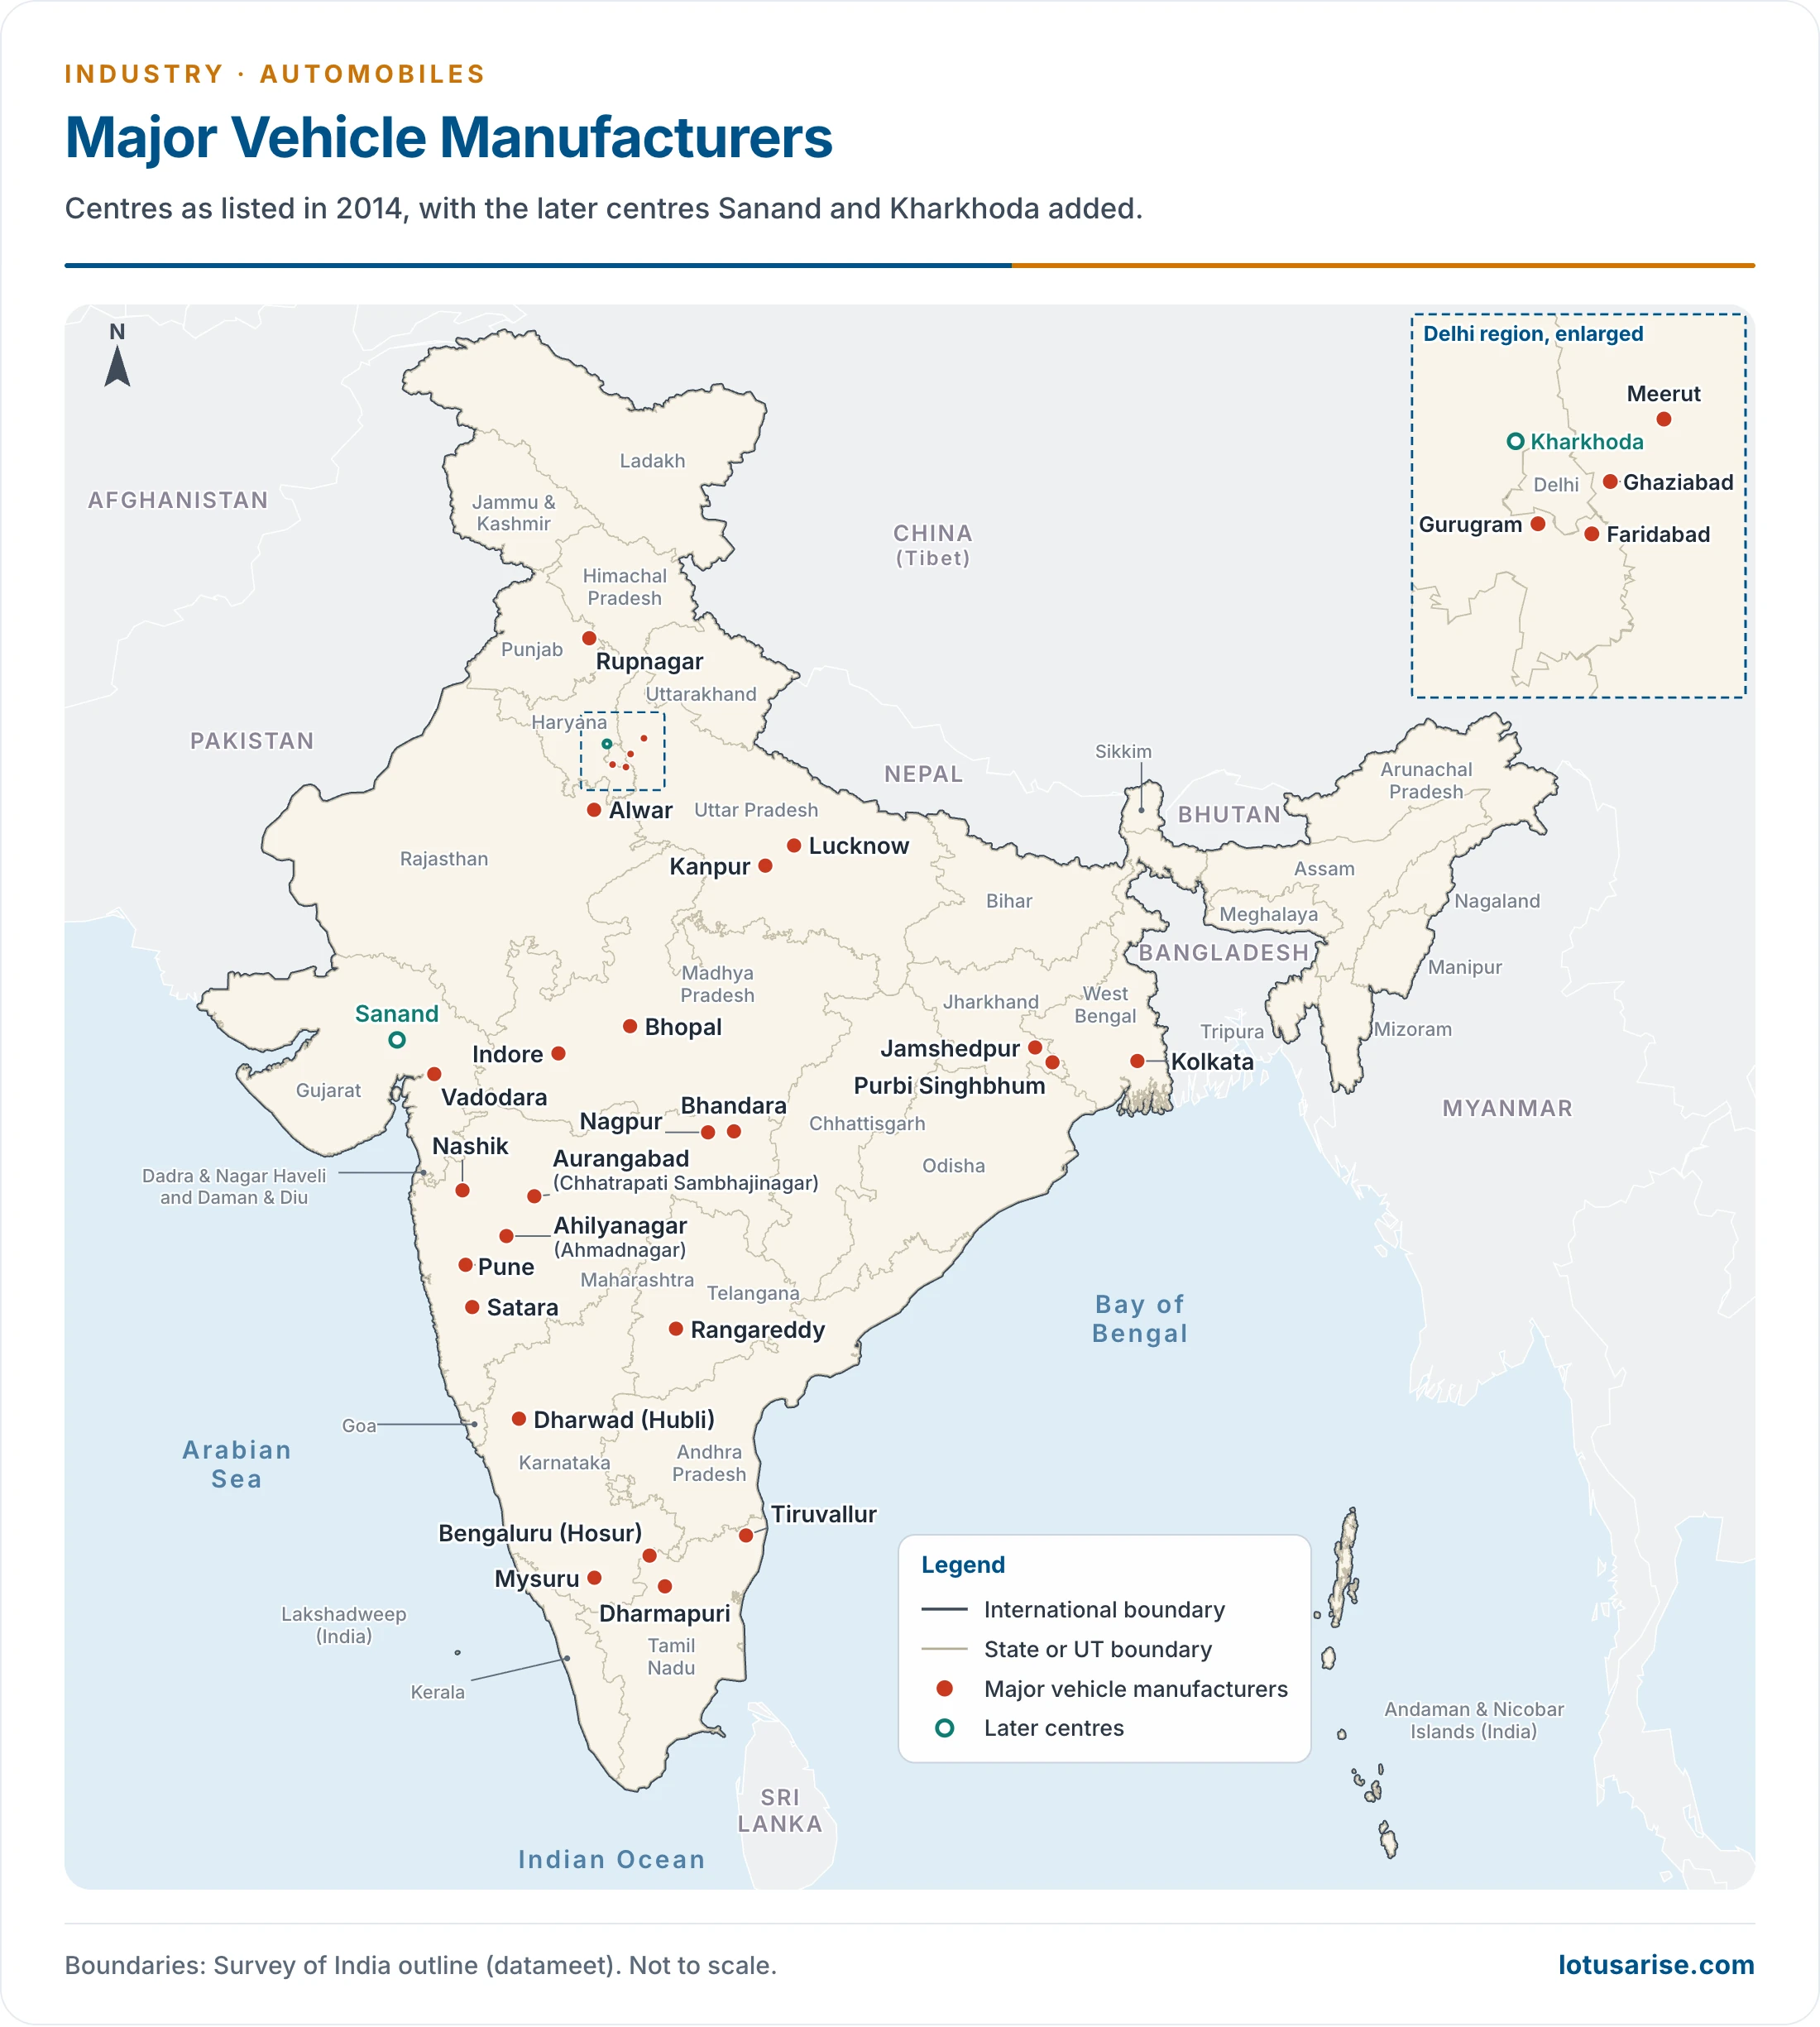
| North: National Capital Region | Gurugram, Manesar, Kharkhoda, Faridabad, Noida, Surajpur, Alwar, Neemrana | Maruti Suzuki, Hero, Honda | Maruti as anchor, Delhi market, suppliers, Haryana policy |
| Gujarat (emerging) | Sanand, Hansalpur, Odhav | Tata Motors, Maruti Suzuki | State policy, land, ports; firms moving from labour disputes and from Singur |
| East | Jamshedpur, Kolkata (Uttarpara) | Tata Motors, Hindustan Motors | Steel nearby; lost ground as the old Ambassador ended in 2014 |
| Central and others | Pithampur, Jabalpur, Lucknow, Hyderabad, Bengaluru, Mysuru, Hosur | Tata Motors, TVS, defence works | Decentralisation policy, regional markets |
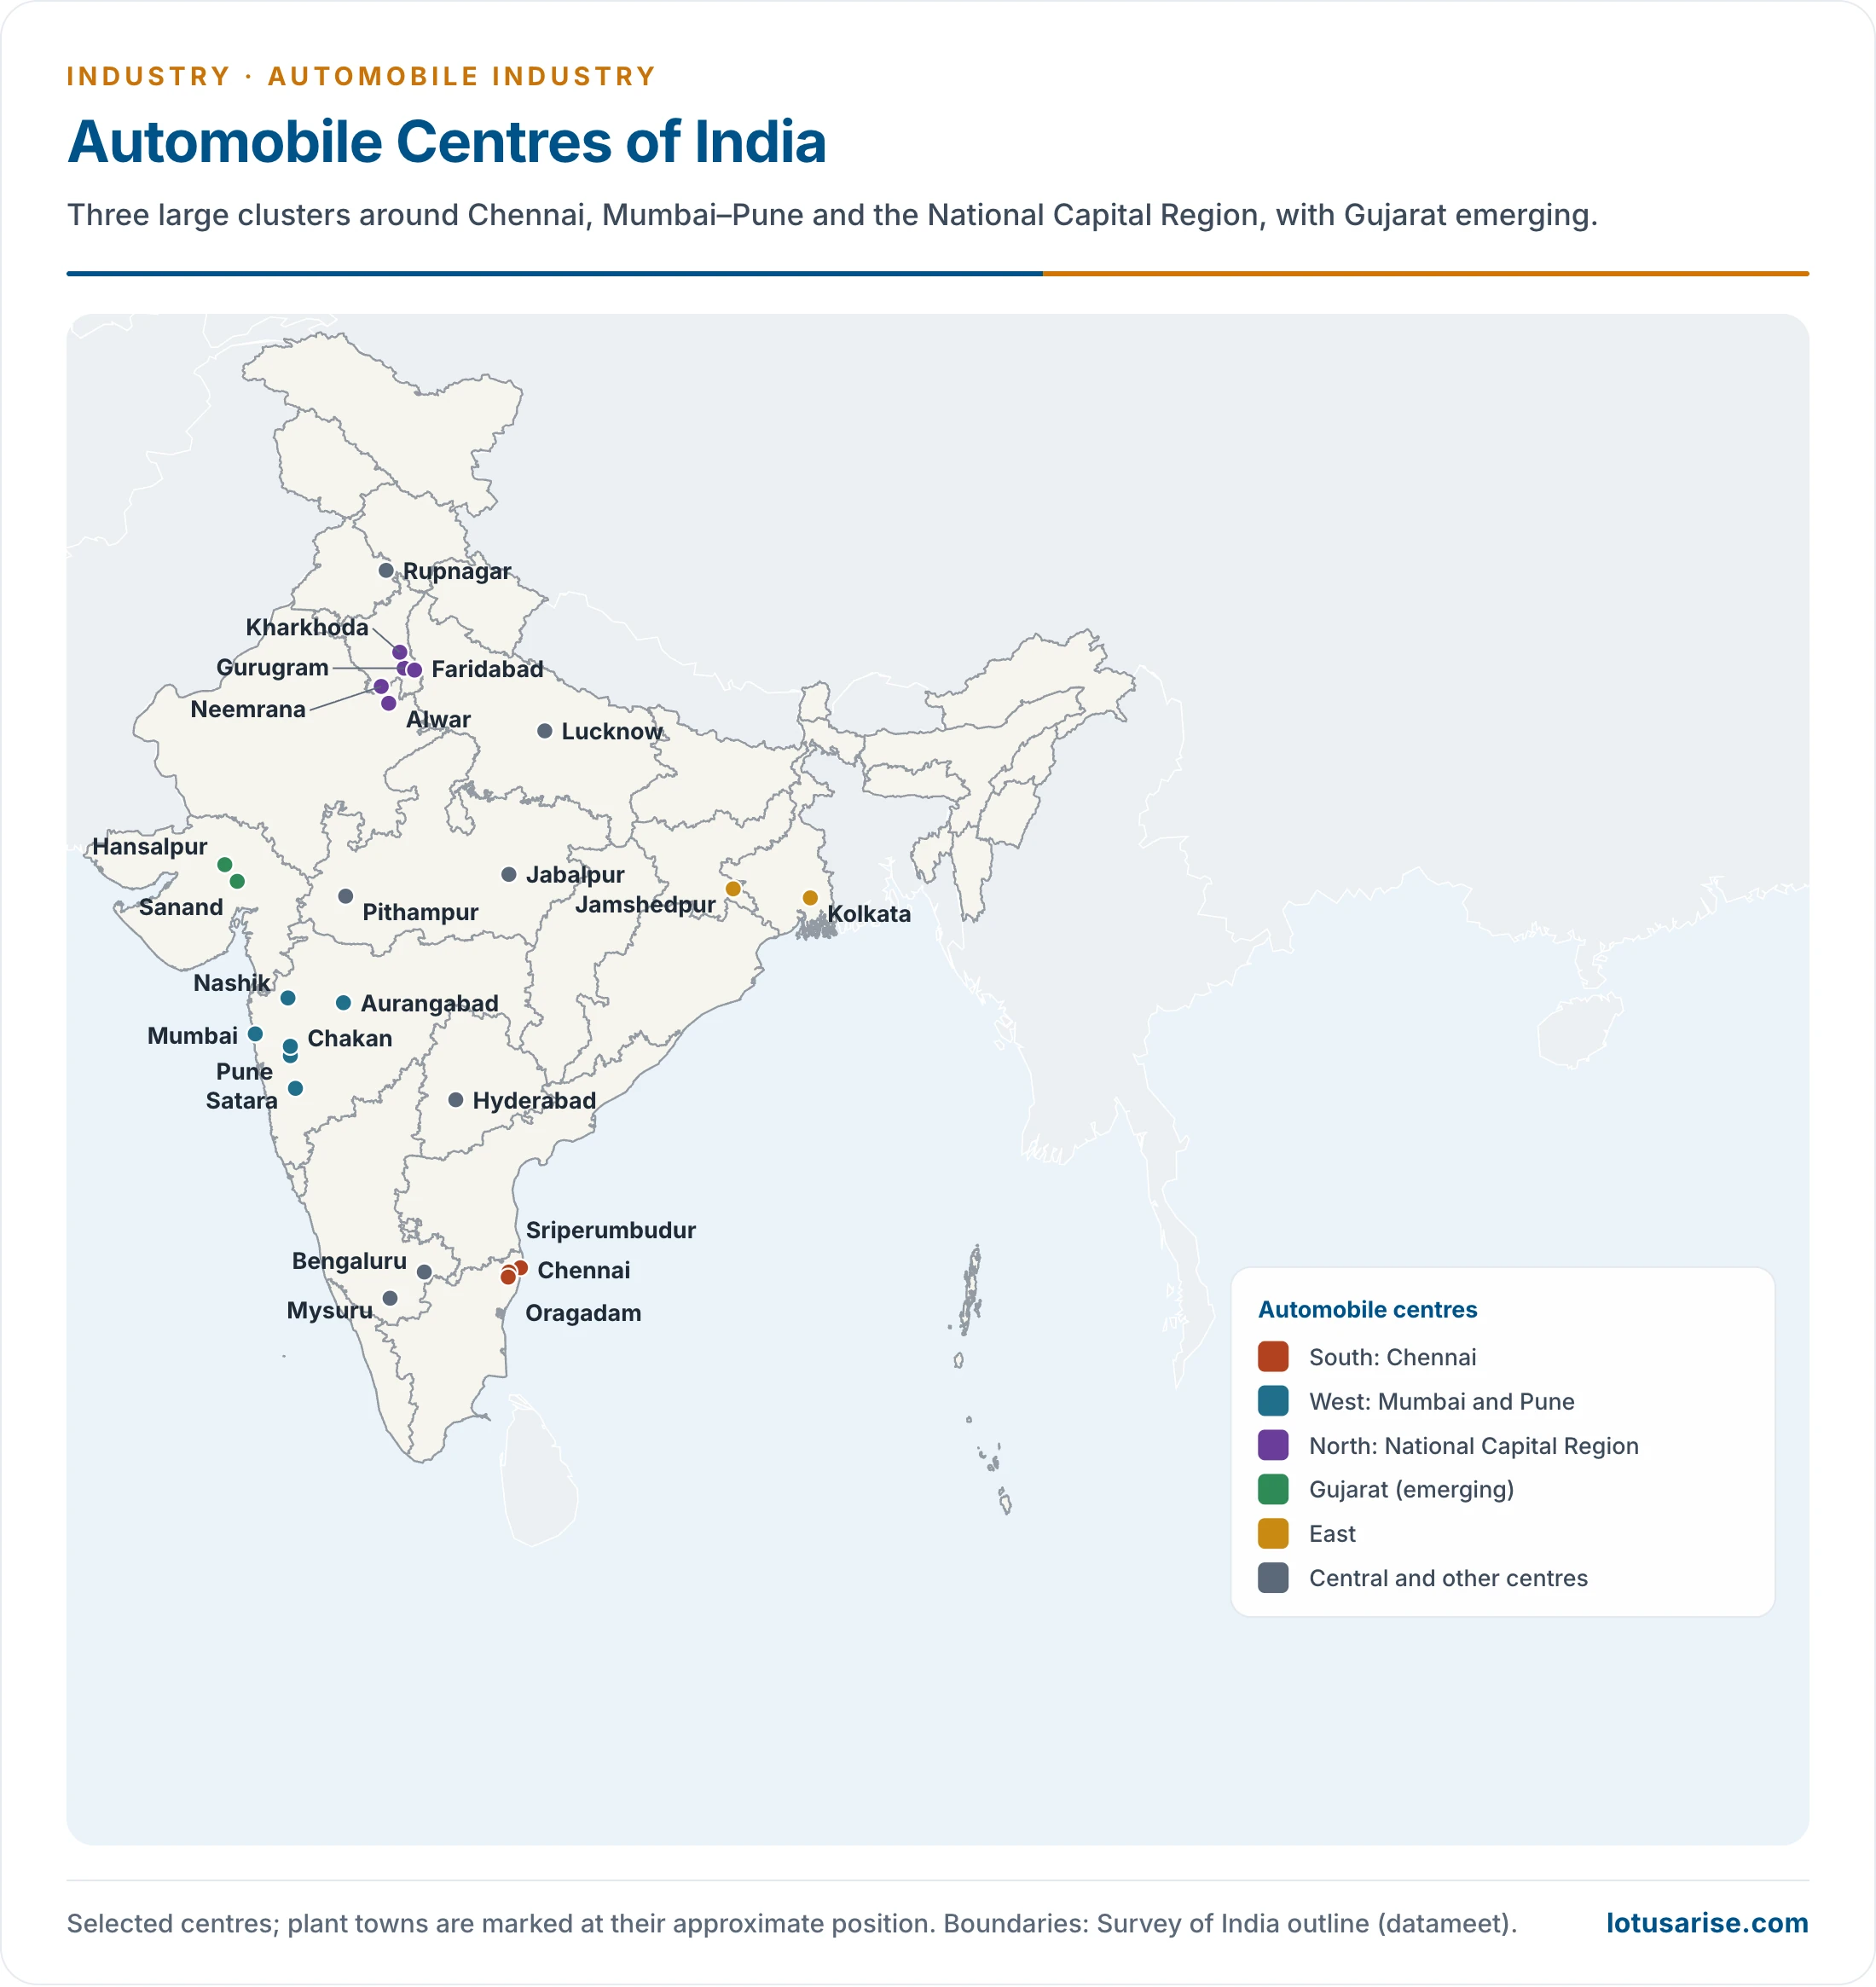
- Chennai has the nickname “Detroit of Asia”. Its ports are Chennai, Kamarajar and Kattupalli.
- Pune area: Hyundai bought the General Motors plant at Talegaon in 2023, and began making vehicles there on 1 October 2025, with 1.7 lakh units a year at first.
- Haryana: Maruti Suzuki started Kharkhoda in February 2025 and a second plant there in May 2026, for 5 lakh units. Its plants at Gurugram, Manesar, Kharkhoda and Hansalpur total 26.5 lakh units.
- Sanand: Tata Motors bought Ford’s plant there, in a deal reported at ₹726 crore in 2023, after Ford stopped making cars for India in late 2021.
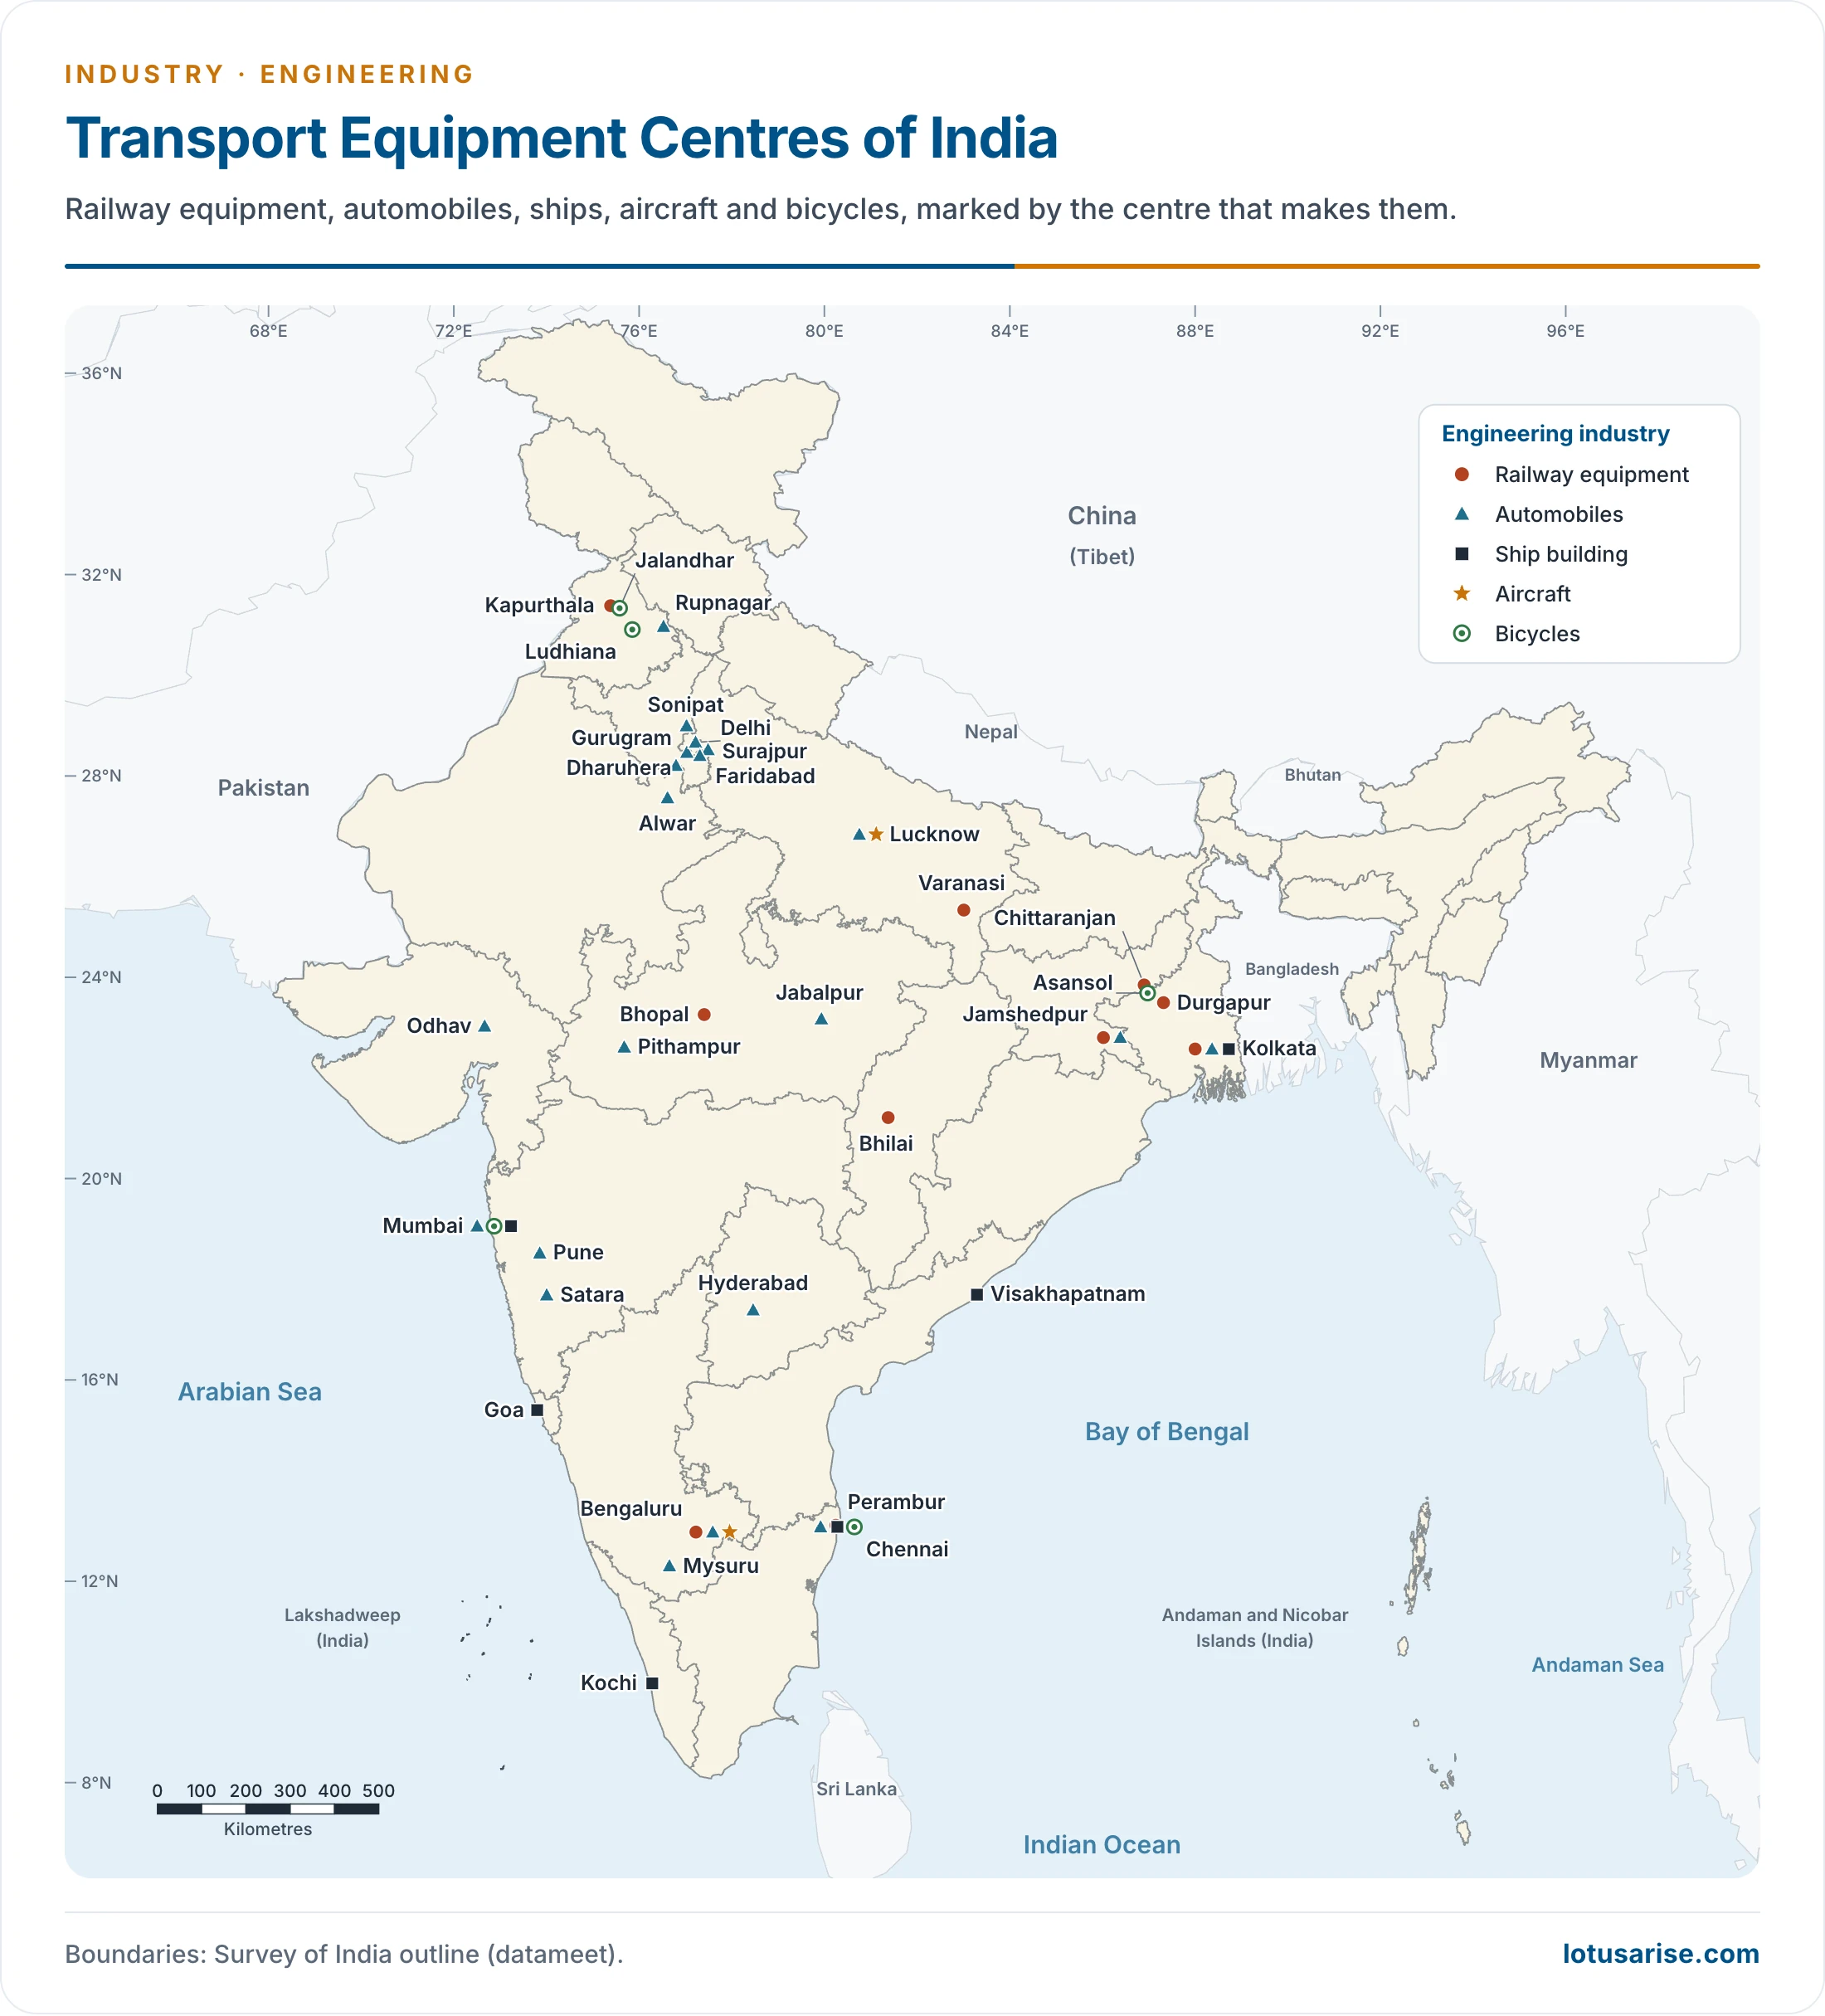
- Classical chief centres: Kolkata, Jabalpur, Jamshedpur, Chennai and Mumbai, which between them made nearly every kind of vehicle. Mysuru and Faridabad added motorcycles. Scooter makers stood at Odhav (Ahmedabad district), Panki (Kanpur), Akurdi (Pune), Satara and Lucknow.
How the Three Hubs Emerged
- Chennai:
- Early base: Ford assembled here from 1930, and Ashok Leyland and Standard Motor Products grew up here.
- Ports: three ports give easy export of finished cars and import of parts, which made it a natural export base for Hyundai and others.
- Suppliers and skills: a dense ring of component makers and a large pool of trained engineers and workers.
- State policy: Tamil Nadu offered land and industrial estates along the Sriperumbudur–Oragadam belt.
- Pune:
- Spillover from Mumbai: the old Mumbai engineering base, with Premier and Mahindra, spread up to the plateau where land was more open.
- Anchor firms: Telco at Pimpri and Bajaj at Akurdi drew suppliers, and Chakan and Talegaon later took in new plants.
- Market and port: Mumbai gives both, within easy reach.
- Labour: a strong pool of technical training and skilled workers.
- Gurugram:
- One anchor: Maruti’s plant of 1983 is the classic case. Its suppliers settled nearby, and a whole belt grew around them.
- Market: the rich Delhi and northern Indian demand lies next door.
- Followers: Hero and Honda came into the same belt, and capacity has spread outward to Manesar, Kharkhoda and the Neemrana area.
- Limits: land costs and labour disputes have pushed new capacity outward and into Gujarat.
- The common logic: port or market access, ancillary agglomeration, a labour pool, State industrial policy and path dependence from an anchor firm. Steel is now bought in from far away, so it no longer fixes location as it once did.
Production and Distribution
| Segment | Domestic sales, 2025-26 | Growth | Exports, 2025-26 | Share of domestic sales |
|---|---|---|---|---|
| Two-wheelers | 2.17 crore | 10.7% | 51.8 lakh | 76.8% |
| Passenger vehicles | 46.43 lakh | 7.9% | 9.05 lakh | 16.4% |
| Commercial vehicles | 10.80 lakh | 12.6% | 0.95 lakh | 3.8% |
| Three-wheelers | 8.36 lakh | 12.8% | 4.61 lakh | 3.0% |
- Total domestic wholesales were 2,82,65,519 units in 2025-26, up 10.4%, and all four segments reached record levels together.
- Exports reached new highs in passenger vehicles and two-wheelers, so the coastal plants matter more than ever.
- India’s rank: it made about 6.01 million motor vehicles in 2024, excluding two and three-wheelers, and ranked fourth in the world in 2023, behind China, the USA and Japan. An older ranking placed it seventh overall and fifth in commercial vehicles.
Commercial Vehicles
- Two segments: passenger and goods. State transport undertakings (STUs) largely control the passenger side, while the goods vehicles are generally made in the private sector.
- Manufacture began in the 1950s, and growth was fast after liberalisation, helped by government incentives.
- Output (buses, trucks, tempos and 3 and 4-wheelers):
| Year | 1950-51 | 1990-91 | 1996-97 | 2003-04 | 2011-12 |
|---|---|---|---|---|---|
| Thousand units | 8.6 | 145.5 | 327.3 | 275.1 | 910.2 |
- Output varied after 1996-97, before rising strongly.
- Seven major companies made buses and trucks in the older pattern:
- TELCO (Tata Engineering and Locomotive Co. Ltd, now Tata Motors): the leader in medium and heavy vehicles, with over 70% of such vehicles at that time.
- Light commercial vehicle plants: four, at Hyderabad, Pithampur (Madhya Pradesh), Asron near Rupnagar (Punjab) and Surajpur (Uttar Pradesh).
- Premier Automobiles and Mahindra and Mahindra: Mumbai.
- Ashok Leyland and Standard Motor Products: Chennai.
- Hindustan Motors: Kolkata.
- Bajaj Tempo: Pune.
- Defence: Ministry of Defence works made Shaktiman trucks, and Jabalpur made jeeps in partnership with Nissan of Japan.
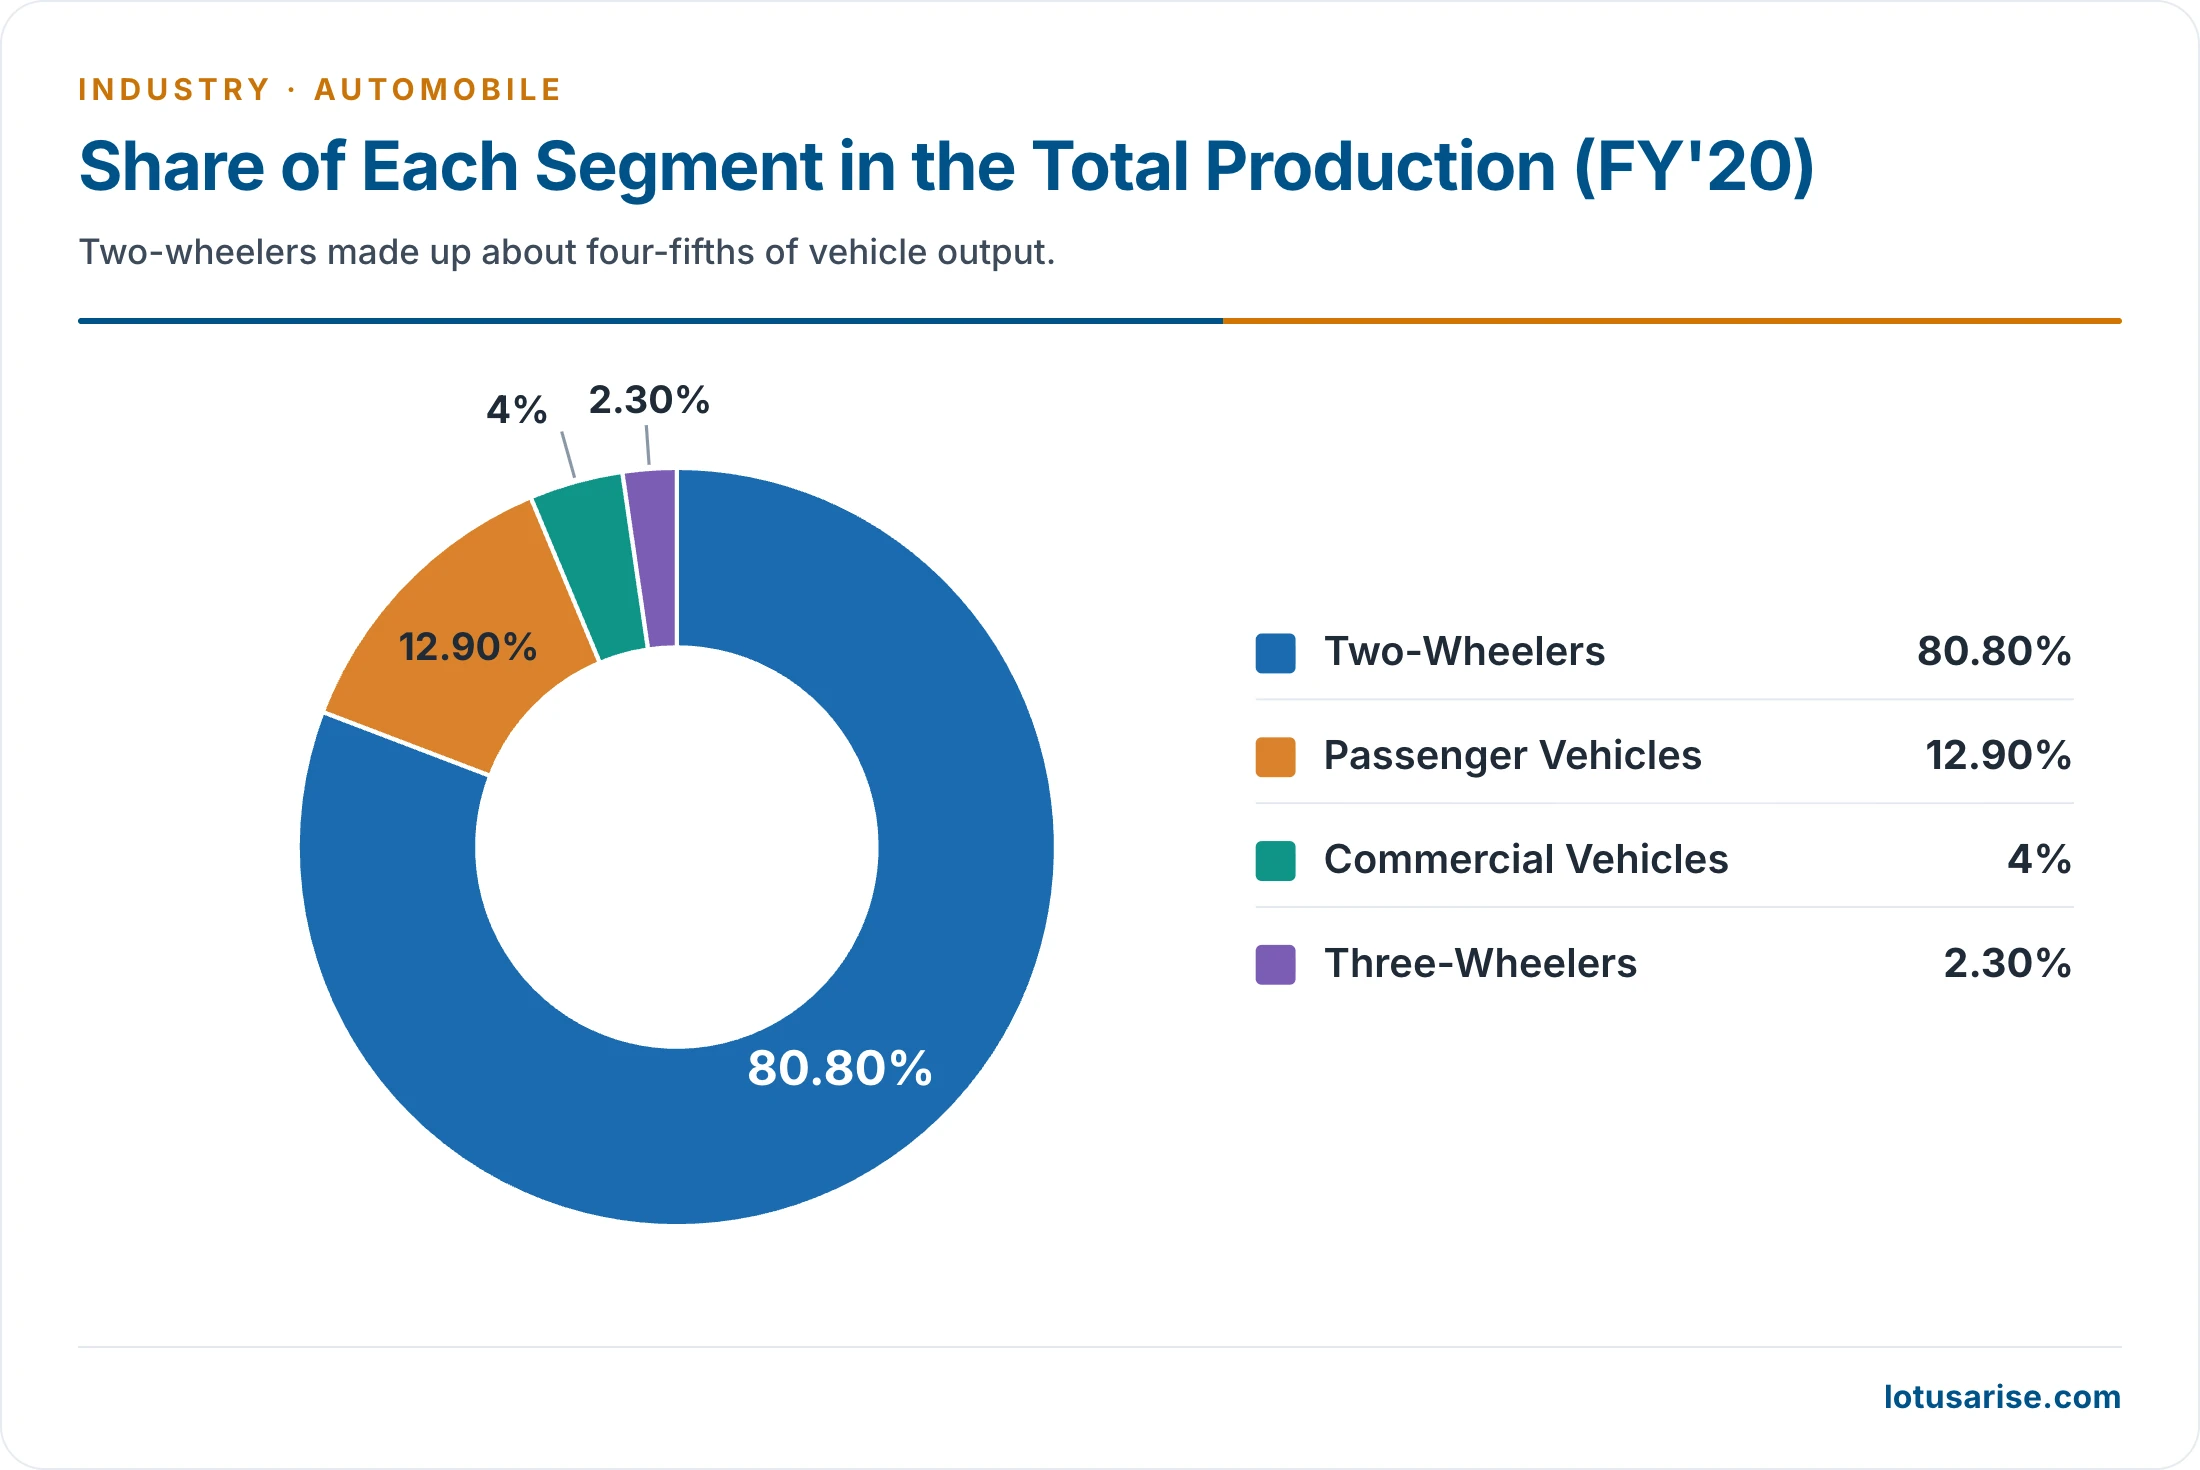
- These segment shares are for 2019-20. Two-wheelers held 76.8% of domestic sales in 2025-26.
Passenger Cars
- Maruti Udyog Ltd (MUL), Gurgaon (Gurugram), Haryana, leads. It started in 1983 with Suzuki Motor Corporation of Japan, and later became Maruti Suzuki India (2007).
- It once made about four-fifths of India’s cars. Its output was 23.4 lakh units in 2025-26.
- Popular older models: Maruti 800, Zen, Wagon R, Esteem and Gypsy.
- Labour unrest at its older sites encouraged a shift of new capacity to Gujarat.
- Other older producers: Sunrise Industries (Bengaluru), Standard Motor Products (Chennai), Premier Automobiles (Mumbai) and Hindustan Motors (Kolkata and Chennai).
- New entrants after 1991:
- Hyundai Motors India at Irungattukottai, Kancheepuram district, Tamil Nadu.
- Daewoo of Korea at Surajpur (Uttar Pradesh) in 1995. It stopped selling cars in India in 2003.
- Telco at Pimpri, near Pune.
- Honda in Uttar Pradesh, for the City.
- General Motors with the Opel Astra, tied to Hindustan Motors. It stopped making Chevrolet cars for India in late 2017.
- Ford with Mahindra, for the Ford Escort.
- Hindustan Motors with Mitsubishi of Japan, for the Lancer.
- Mercedes Benz of Germany with Telco, for the E220 and 250D at the top of the market.
- Premier Automobiles with Fiat-India Auto Limited, for the Fiat Uno. Fiat left in 2018.
- Tata Nano: a major attempt to bring a car within reach of middle-class buyers. It drew interest at first, then faded with technical problems and competition from other small cars.
| Category | 1998-99 | 1999-00 | 2000-01 | 2001-02 | 2002-03 | 2003-04 |
|---|---|---|---|---|---|---|
| Passenger cars | 3,90,709 | 5,77,243 | 5,13,415 | 5,64,052 | 6,08,851 | 8,42,437 |
| Multi-utility vehicles | 1,13,328 | 1,24,307 | 1,27,519 | 1,05,667 | 1,14,479 | 1,46,103 |
| Commercial vehicles | 1,35,891 | 1,73,521 | 1,56,706 | 1,62,508 | 2,03,697 | 2,75,224 |
| Two-wheelers | 33,74,508 | 37,78,011 | 37,58,518 | 42,71,327 | 50,76,221 | 56,24,950 |
| Three-wheelers | 2,09,033 | 2,05,543 | 2,03,234 | 2,12,748 | 2,76,719 | 3,40,729 |
| Total | 42,23,469 | 48,58,625 | 47,59,392 | 53,16,302 | 62,79,967 | 72,29,443 |
- Production of vehicles in India. Car output rose fast once Maruti began in the mid-1980s: from 390.7 thousand in 1998-99 to 842.4 thousand in 2003-04.
- Cars, jeeps and land rovers together:
| Year | 1950-51 | 1980-81 | 1990-91 | 1996-97 | 2003-04 | 2011-12 |
|---|---|---|---|---|---|---|
| Thousand units | 7.9 | 49.4 | 220.8 | 483.0 | 1,008.1 | 2,513.2 |
- A short slack came in 1997-98 and 1998-99, and output picked up again from 1999-2000.
- Why the industry was buoyant:
- Excise duty: cut on passenger cars from 32% to 24% in 2004, which lowered prices and widened demand.
- Auto Policy: it aimed to make India an “Asian hub” for small cars. The A and B segments, the small cars, held over 65% of the market, so the policy pushed an existing trend. Quality and price decide success here.
- Wide choice: A and B cars grew steadily, with many models at affordable prices. C segment mid-size cars held 15–16%.
- Finance: car loans once meant trips to the bank, paperwork and long waits. Flexible schemes then made almost 70% of new cars loan-financed.
- Scope for growth (older figures): penetration was 20 cars per 1,000 people in one count and 6 in another, against 12 vehicles per 1,000 in Pakistan and Sri Lanka. The market was projected to grow about 7% a year.
Jeeps
- Almost all jeeps came from Mahindra, Mumbai, with capacity of about 13,000 a year.
Tractors
- Complete tractor output rose from 71.0 thousand in 1980-81 to 648.7 thousand in 2011-12. India was then described as the largest maker of tractors.
Two-Wheelers
- Types: motorcycles, scooters, mopeds and scooterettes. Technically there are five classes: scooters, motorcycles, mopeds, ungeared scooters and step-thrus.
- Beginnings: Automobile Products of India (API) began with scooters in the early 1950s. Only API and Enfield made two-wheelers up to 1958. Bajaj Auto followed in 1960, partnered with Piaggio of Italy.
- Output: 5,624.9 thousand units in 2003-04, up from just 0.9 thousand in 1960-61, and 12,006.9 thousand in 2011-12.
- Foreign entry from the mid-1980s, after which practically all the global giants came to India:
- Suzuki with TVS (1984).
- Honda with the Hero Group, within a year.
- Kawasaki with Bajaj Auto and Yamaha with Escorts, under licence.
- Piaggio with LML, which planned six lakh vehicles a year.
- Older expansion plans:
- Bajaj Auto: two million vehicles a year.
- Hero Honda: over 2,52,000 vehicles at Dharuhera, and a new plant at Gurgaon for ₹160 crore.
- TVS Suzuki: ₹200 crore, to reach one million a year.
- Yamaha-Escorts: new products and expansion at Surajpur.
- Centres:
- Scooters: Kanpur, New Delhi, Pune and Mumbai.
- Public sector units: Alwar, Lucknow, Satara, Bengaluru and Hyderabad.
- Motorcycles: New Delhi, Chennai, Mysuru, Gurugram and Faridabad.
- Social change: from a semi-luxury of the urban middle class in the 1980s, the two-wheeler became the favourite personal transport, and a prized possession for most consumer groups except the most affluent.
- What drove the boom:
- The fuel-efficient, sturdy four-stroke motorcycle, equally suited to highways and rural roads.
- An active consumer class, a young population and a much lower cost than cars.
- Strong appeal to young men.
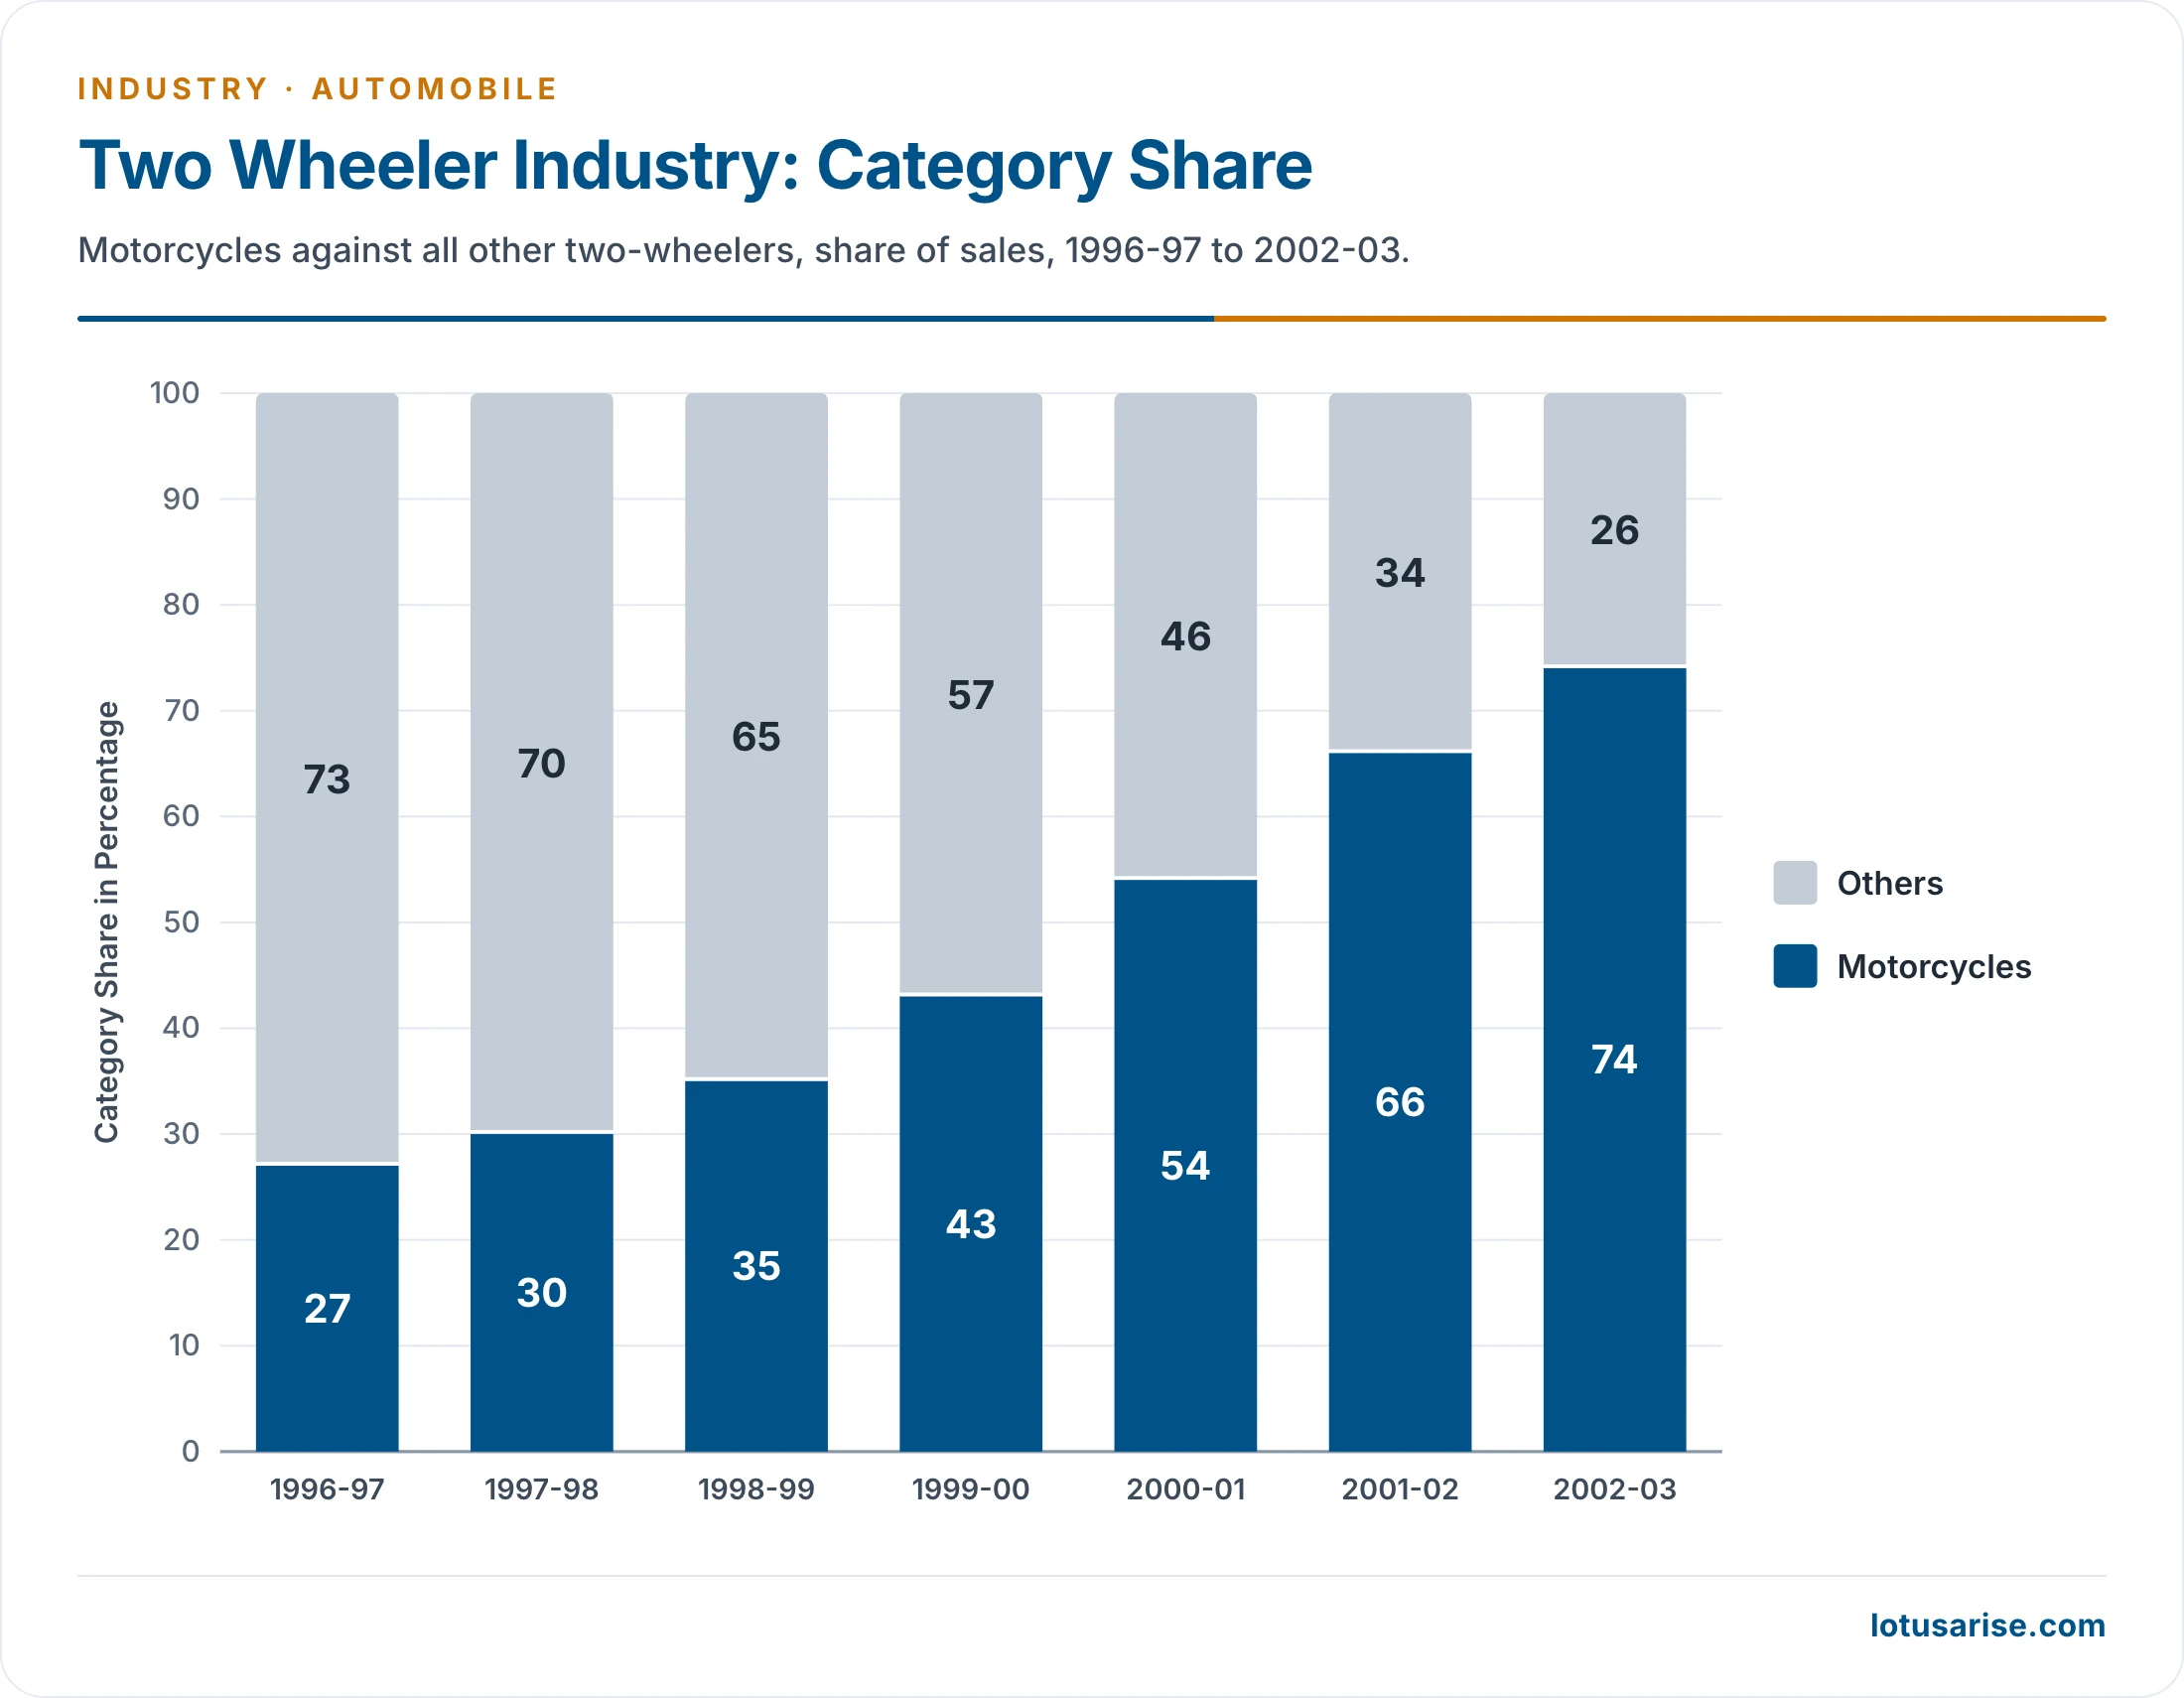
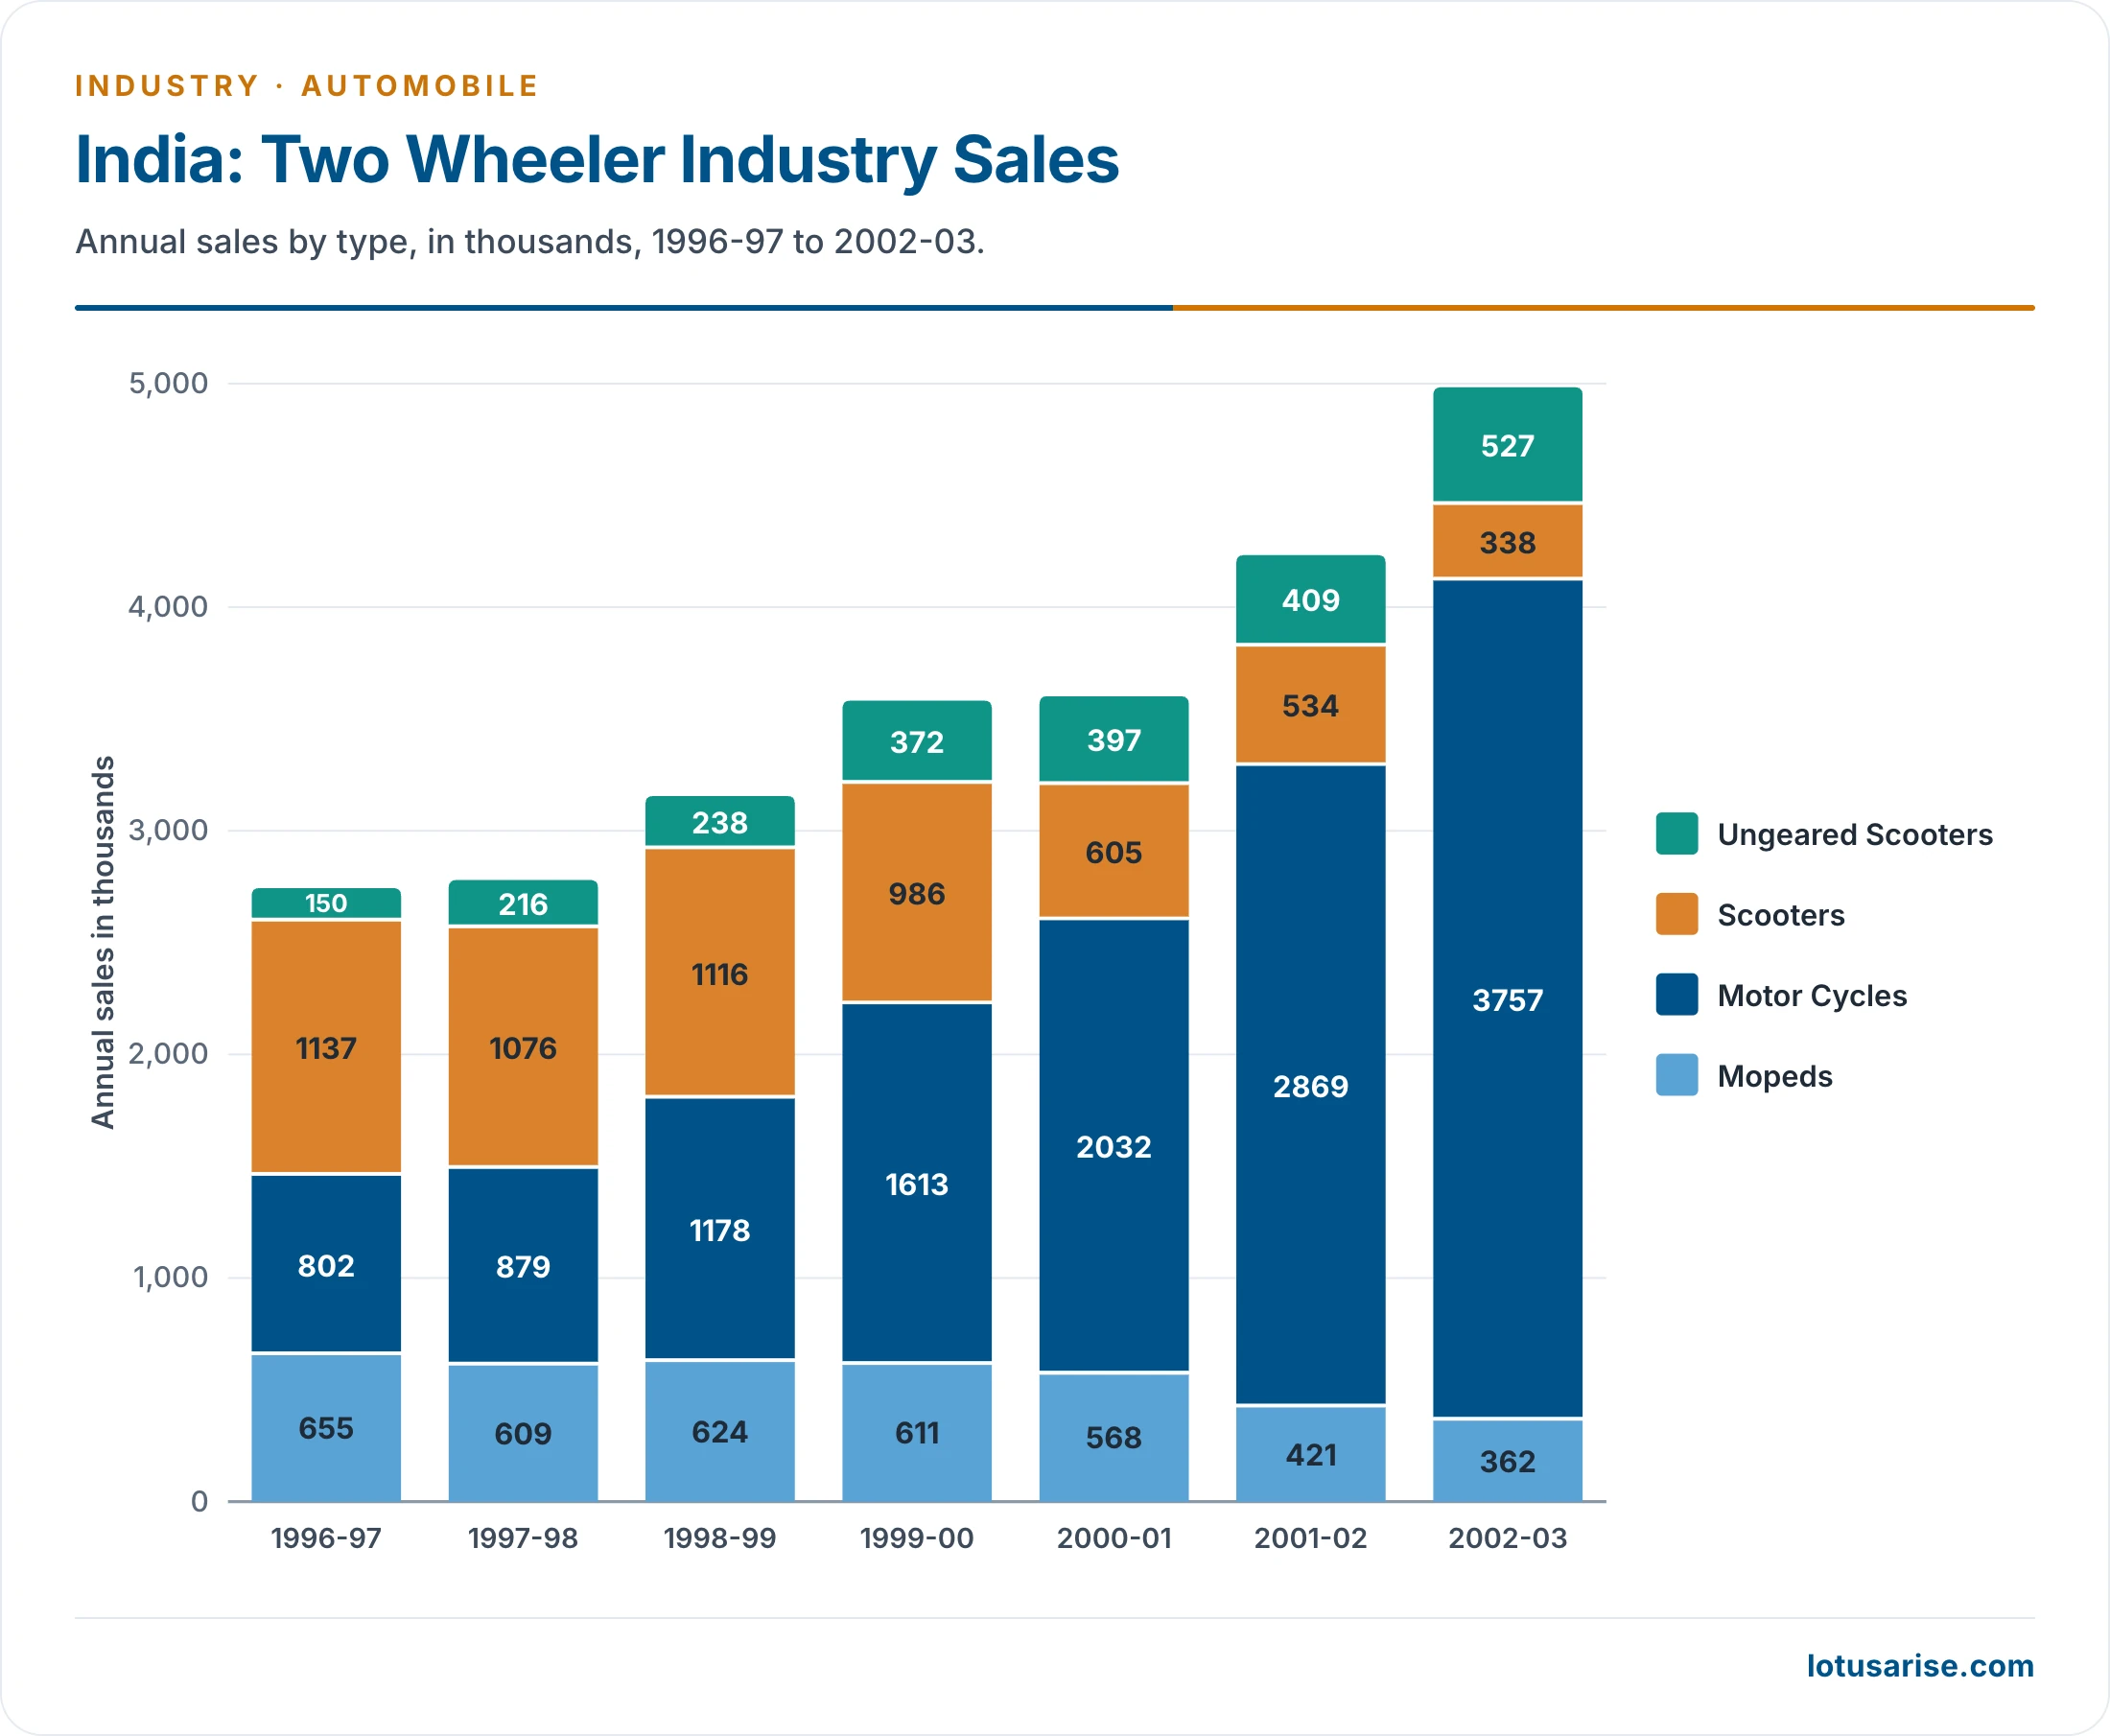
- Market size: annual sales of over 5 million made India the second largest market after China (12.5 million). A later count gave over 12 million against 25 million.
- Motorcycles displaced other types:
| Type | 1996-97 (thousand units) | 2002-03 (thousand units) |
|---|---|---|
| Motorcycles | 802 | 3,757 |
| Scooters | 1,137 | 338 |
| Mopeds | 655 | 362 |
- In 2002-03, motorcycle sales grew 31%, reaching 74% of all two-wheeler sales against 27% in 1996-97. Scooter sales were mainly urban, while motorcycle sales split 50:50 between urban and semi-urban or rural areas.
- Scooters have since recovered. In 2025-26, sales were 1.31 crore motorcycles against 81 lakh scooters, up 18.5%.
- Finance: rare until the early 1990s. It grew fourfold between 1996-97 and 2003-04, and 35–45% of sales were financed then, against 15% in 1999-2000.
- Urban safety valve: two-wheelers relieve pressure on urban transport, where public transport is scarce. More than 65% of them were in urban and semi-urban areas.
- Demography:
- People aged 15–34 made up 35.1% of the population in 2001, and they prefer two-wheelers.
- The office-going middle class aged 25–59 was 23.5%, and favours motorcycles for fuel economy.
- Low penetration: an older count gave 38 per thousand people, against Malaysia 220, Thailand 150 and Indonesia 75.
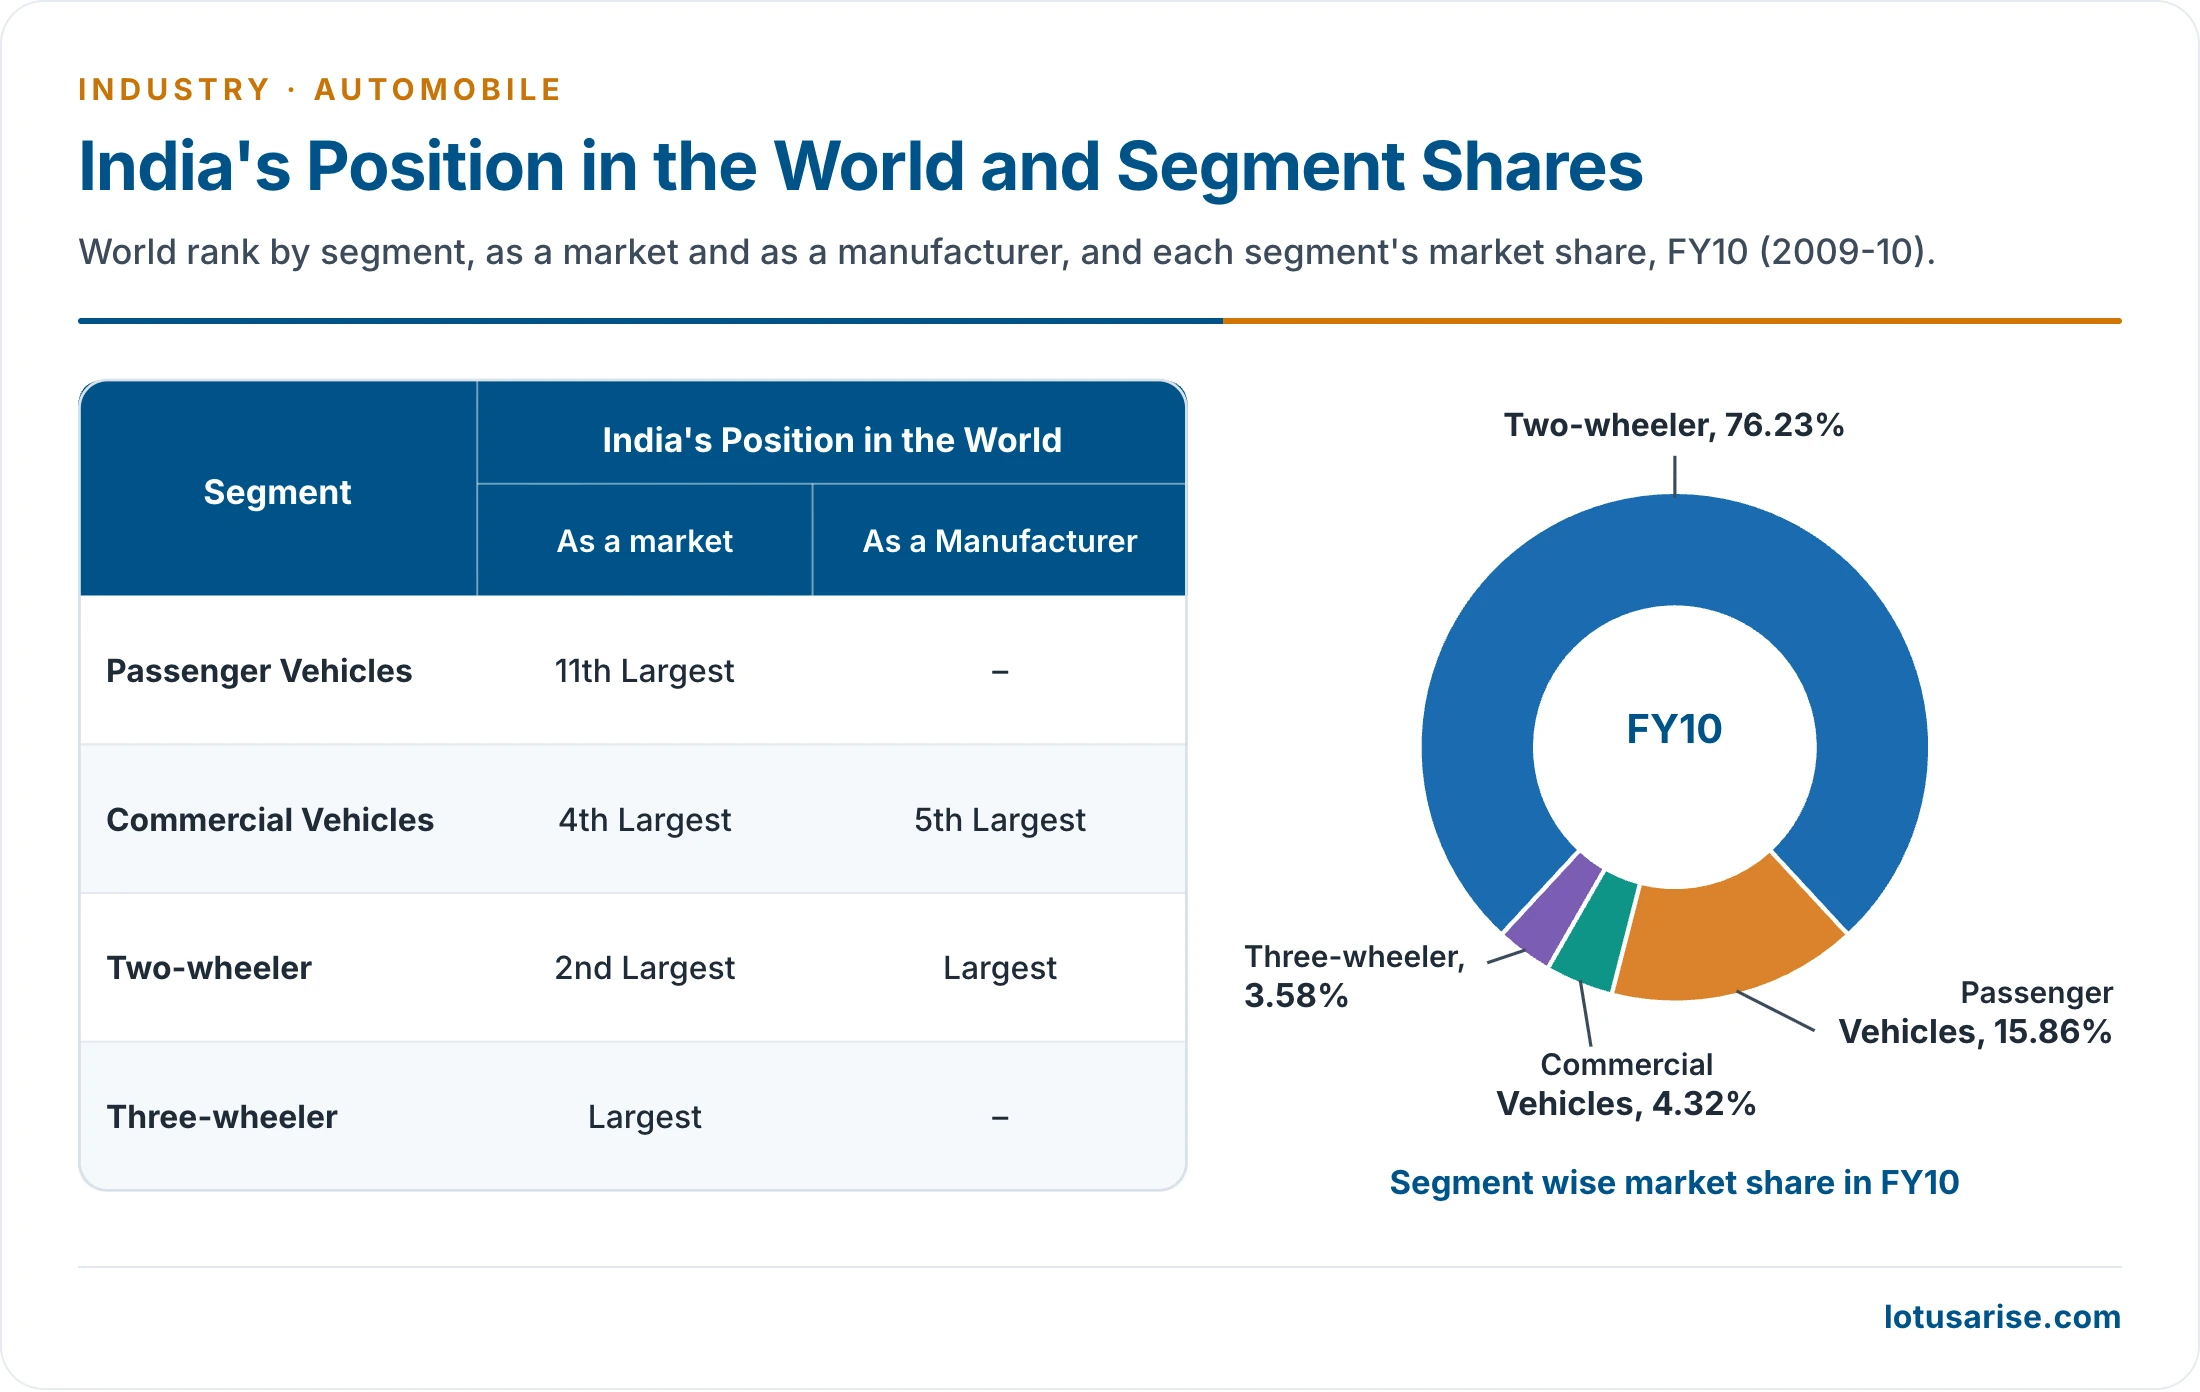
- These ranks and shares are for 2009-10. Two-wheelers held 76.8% of domestic sales in 2025-26, and passenger vehicles 16.4%.
Electric Vehicles and Current Policy
- Electric vehicle registrations reached 2.5 million in 2025-26, up 24.7% from 1.97 million in 2024-25.
- PM E-DRIVE: begun with ₹10,900 crore for electric two and three-wheelers, trucks, buses, ambulances and charging. It has been extended to 31 March 2028.
- Production Linked Incentive for automobiles and components: ₹25,938 crore, notified in September 2021, for advanced automotive technology made in India.
- Scheme to Promote Manufacturing of Electric Passenger Cars in India (SPMEPCI), notified 15 March 2024: in return for a commitment of at least ₹4,150 crore within three years, a firm may import up to 8,000 electric cars a year at 15% duty.
- Supply chain: batteries depend on critical minerals such as lithium, nickel and cobalt, for which India relies heavily on imports.
- Scrappage: authorised vehicle scrapping centres feed scrap back to the steel industry.
- Many large firms here are multinational companies or their partners, among them Hyundai, Suzuki and Honda.





Thank you for your efforts, it’s helping in multiple ways.