

Techniques of Administrative Improvement: Organisation and methods, Work study and work management; e-governance and information technology; Management aid tools like network analysis, MIS, PERT, CPM.
This article: Meaning and need of administrative improvement and its link with scientific management and administrative reform (Caiden); Organisation and Methods (origin in the UK Treasury, objectives, functions, techniques, O&M in India from 1954, CSMOP 2022, e-Office, the Special Campaigns, decline and revival); work study and work management (method study, work measurement, time study, PMTS, work sampling, standard time, work simplification, the Staff Inspection Unit); Management by Objectives and Drucker on principles; network analysis (activity, event, dummy, float, critical path; network analysis as relations); PERT and CPM with worked examples, crashing and their use in Indian project monitoring (PRAGATI, PM Gati Shakti, PAIMANA); MIS (definition, components, levels, MIS vs DSS vs EIS, Indian dashboards); Gantt charts, TQM, Six Sigma, Kaizen, benchmarking, BPR and Sevottam; limits of management techniques in public administration.
Official Syllabus: Paper I · Unit 1-11 Techniques of Administrative Improvement
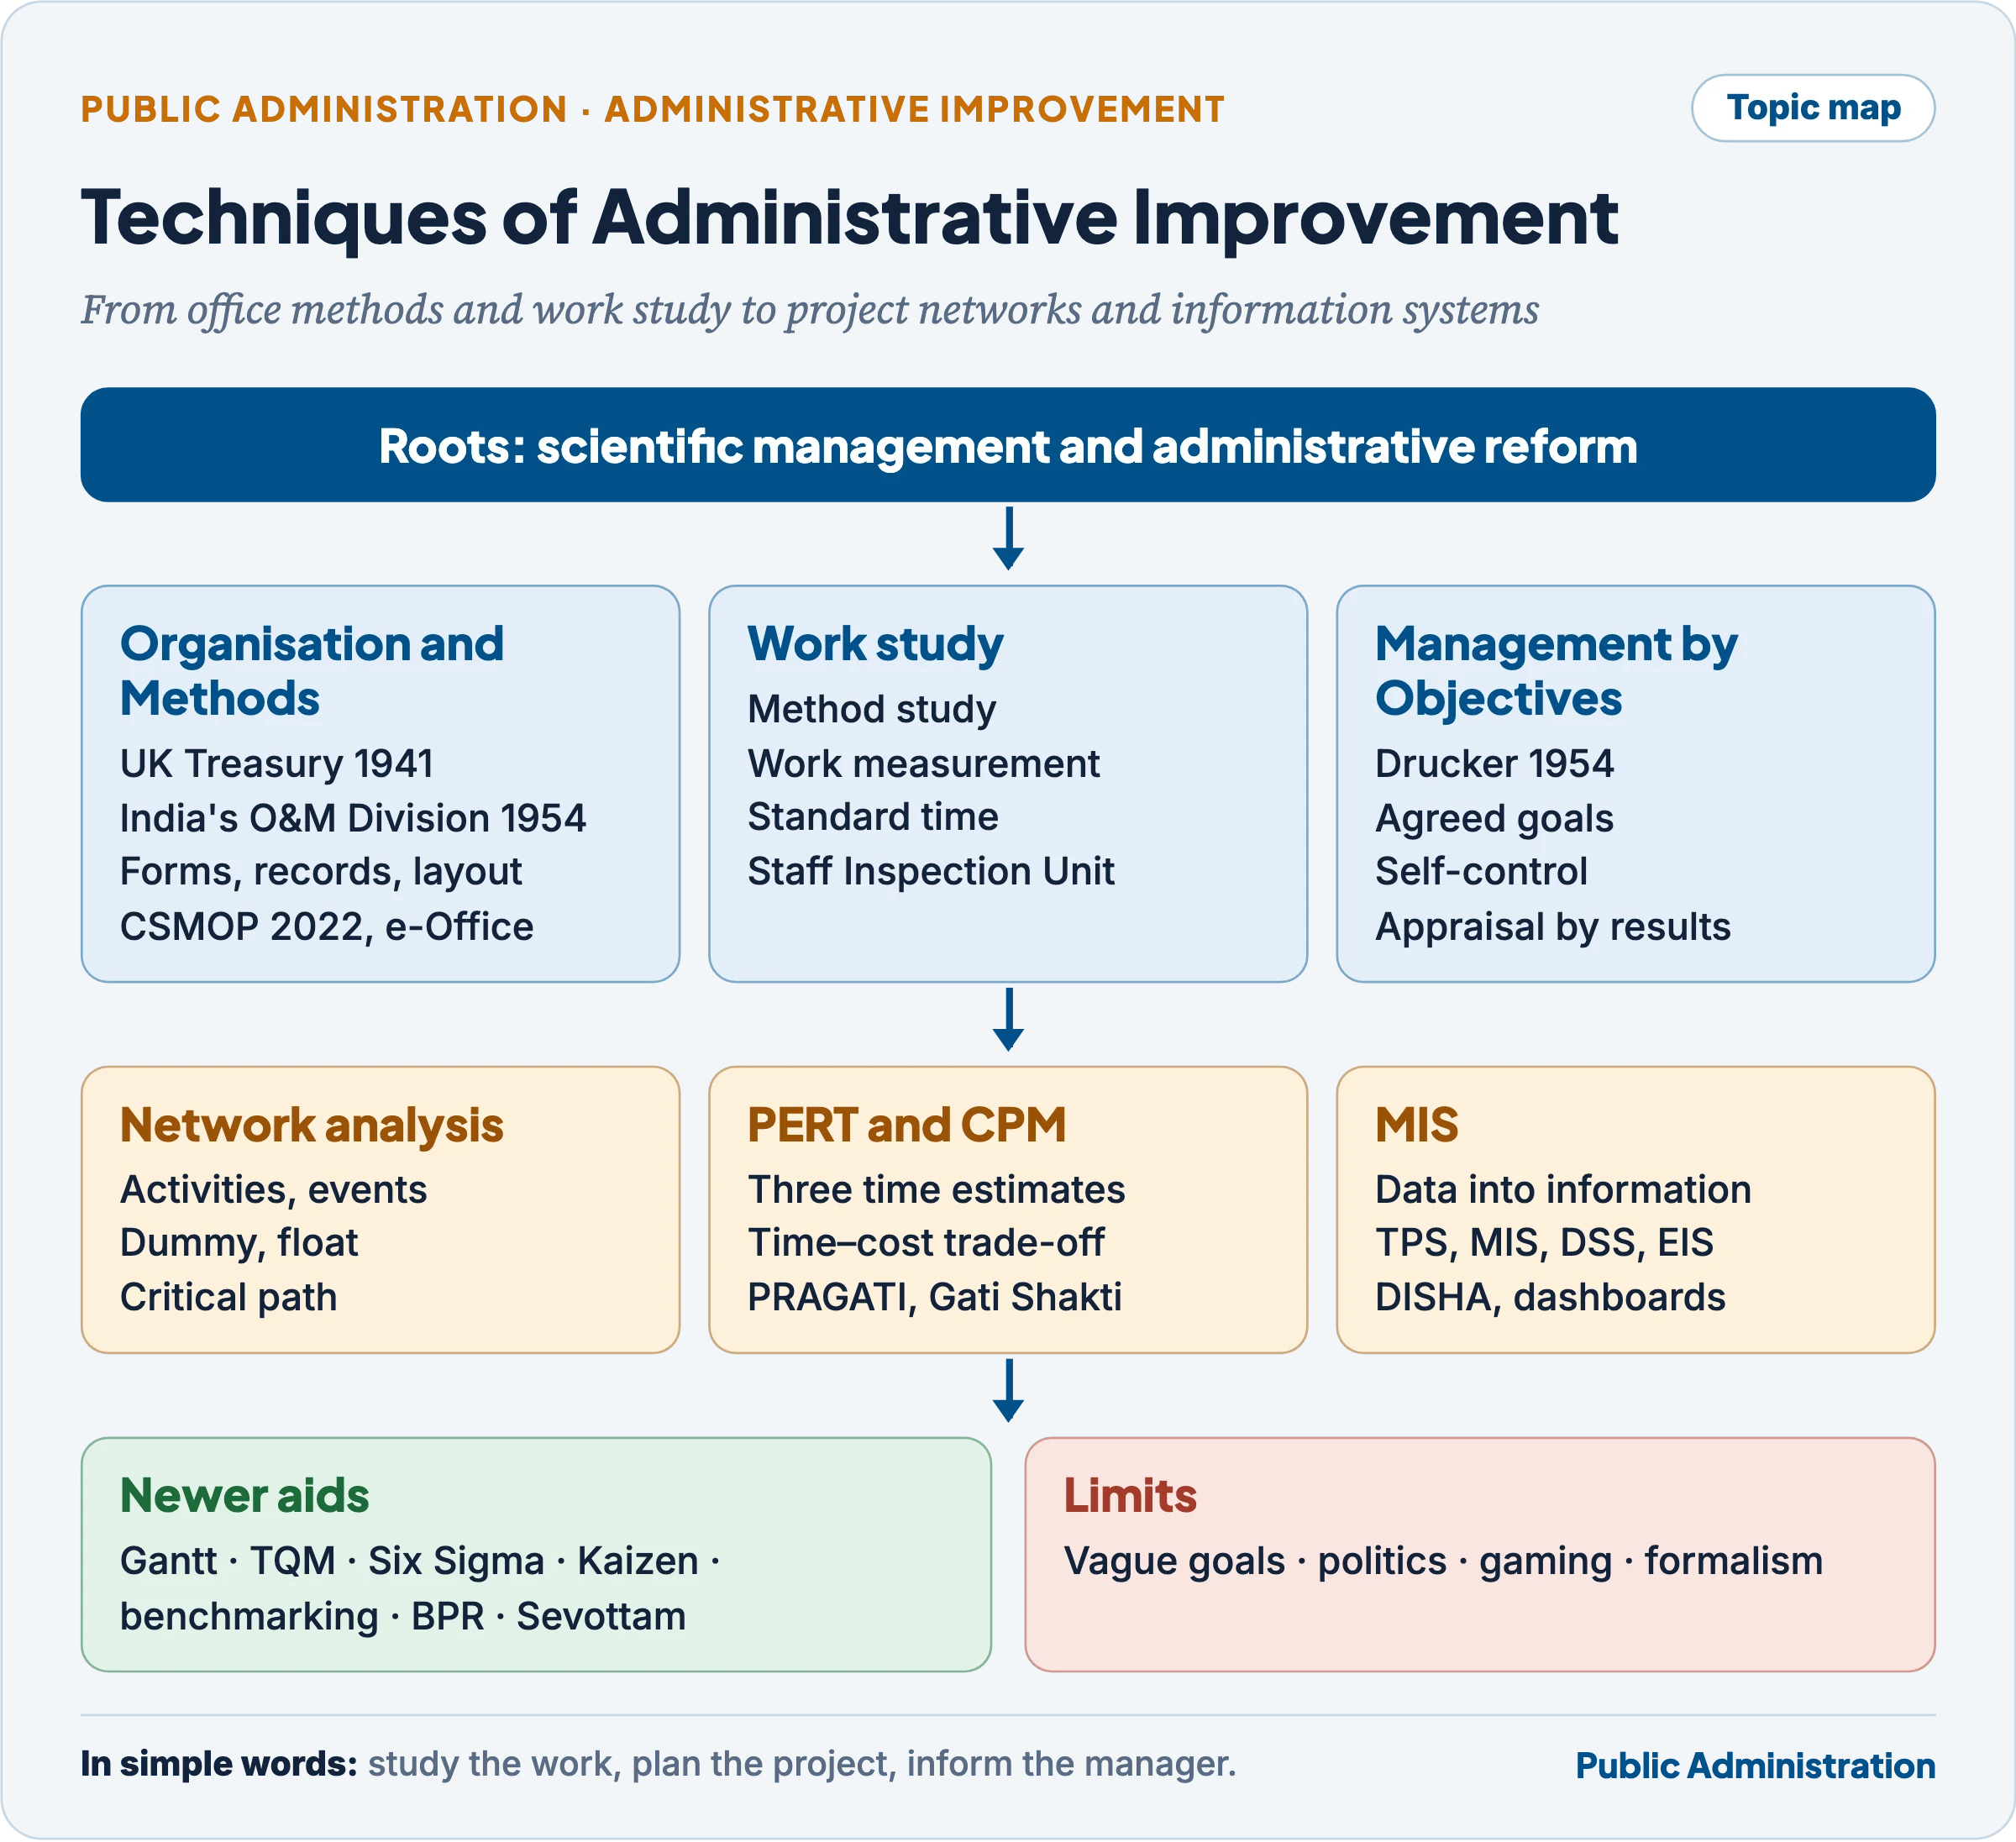
Techniques of administrative improvement are the tools an organisation uses to look at its own working with fresh eyes: how its structure is arranged, how papers and decisions move, how long each task should take, how a large project should be sequenced and how managers get the information they need. They are the practical, workshop end of Public Administration, where the search for efficiency that began with Woodrow Wilson and Frederick Taylor turns into charts, standards, schedules and dashboards.
- The tools fall into three families. Organisation and Methods (O&M) and work study examine the routine work of an office: structure, procedure, forms, layout and time. Network analysis (PERT and CPM) plans and controls one-time projects made up of many interdependent activities. Management Information Systems (MIS) supply the information on which decisions and control depend.
- Around these sit newer management aids borrowed from industry: Management by Objectives, Gantt charts, Total Quality Management, Six Sigma, Kaizen, benchmarking and Business Process Re-engineering. Information technology now runs through all of them; its wider use for service delivery is the subject of the companion article on e-governance and information technology.
In simple words
Think of a district hospital where patients wait four hours. One expert studies the counters, forms and queue and redesigns the flow (O&M). Another times how long each registration actually takes and fixes how many clerks are needed (work study). A third plans the new wing so that the foundation, wiring and equipment arrive in the right order without delay (PERT and CPM). A fourth builds a screen that shows the superintendent waiting times, bed occupancy and drug stocks every morning (MIS). All four are techniques of administrative improvement.
1. Administrative Improvement: Meaning, Need and Roots
In simple words
Every office slowly collects bad habits: extra forms, needless signatures, files that travel up and down. Administrative improvement means finding those habits on purpose and removing them, instead of waiting for a crisis to expose them.
1.1 Meaning
- Administrative improvement is the deliberate, continuous effort to raise the efficiency, economy and effectiveness of an administrative system by changing its structures, procedures, methods, staffing and information flows.
- Efficiency means more output for the same input (more applications processed per clerk).
- Economy means the same output at lower cost (fewer forms, less paper, smaller establishment).
- Effectiveness means achieving the intended result (the citizen actually gets the pension on time).
- It is narrower and more technical than administrative reform. Improvement usually works within the existing framework (simplify a form, redesign a file route, measure a job); reform may change the framework itself (create new institutions, change recruitment, decentralise power).
- It is continuous, not a one-time exercise. Organisations drift: new activities are added, old ones linger, and procedures designed for one purpose survive long after the purpose has gone.
1.2 Why public administration needs improvement techniques
- Bureaucracy tends to rigidity. A secretariat built on “proper channel”, precedent, numerous checks and many levels of submission is cautious and fair, but the same safeguards slow work, multiply paper and sap initiative lower down.
- Routine leaves no time for self-examination. Officials immersed in daily disposal rarely ask why a procedure exists, and higher levels may prefer the status quo; a specialist eye is needed to point out defects.
- Growth without design: new functions are added faster than structures are reorganised, so duplication and orphaned activities accumulate.
- Scarcity, accountability and citizens: waste, delay and cost overruns are political as well as managerial failures, and red tape is the daily face of government for most citizens.
1.3 The bridge from scientific management
The techniques in this article are the descendants of Frederick Winslow Taylor’s scientific management (The Principles of Scientific Management, 1911): the idea that work can be studied systematically, that there is a “one best way” of doing it, and that standards should replace rule of thumb.
| Generation | Focus | Typical tools |
|---|---|---|
| Scientific management (1900s–1920s) | The individual task on the shop floor | Time study (Taylor), motion study (Frank and Lillian Gilbreth), Gantt charts |
| Classical administrative management (1920s–1940s) | Structure of the whole organisation | Span of control, line–staff relations, departmentation, O&M |
| Decision-making and management science (1940s–1960s) | Decisions and complex projects | Operations research, PERT, CPM, early computer-based MIS |
| Results and quality management (1950s–1990s) | Objectives, quality, customers | MBO, TQM, benchmarking, Six Sigma, BPR |
| Digital-era management (1990s onwards) | Organisation-wide information and process | ERP, dashboards, e-Office, analytics, AI |
- The movement has been from micro concerns (one worker’s motions, one clerk’s file) to macro concerns (organisation-wide decisions, performance monitoring, process re-engineering and output–outcome evaluation). ICT has made far more ambitious internal re-engineering possible.
- Yet Taylor’s core questions, what work is done, by what method, and in how much time, still underlie every technique, from O&M to an e-Office analytics dashboard.
1.4 Administrative improvement and administrative reform
Administrative improvement techniques are the instruments; administrative reform is the wider process of induced change in which they are used.
- Gerald Caiden, the British-born scholar of comparative administrative reform, in Administrative Reform (1969), defined it as “the artificial inducement of administrative transformation, against resistance.” Three ideas follow:
- Artificial inducement: reform is deliberate and planned, unlike the slow, natural evolution of administrative practice.
- Transformation: it seeks a change in structure, behaviour or values, not cosmetic adjustment.
- Against resistance: reform threatens established interests and habits, so opposition is normal, not exceptional.
- Reform is often described as an effort to bridge the gap between what administration is and what it ought to be, and to expand the administrative and managerial capacity of the state so that it can achieve national goals. In developing countries the whole process of development depends on this capacity, which is why reform has been treated as a precondition of nation-building.
- Because reform applies new ideas to administration, it inevitably carries new values: efficiency and economy (O&M, work study), results (MBO), citizen orientation (Citizen’s Charters, Sevottam), transparency (RTI, e-governance).
Sources of resistance and the inducements needed to overcome them:
| Source of resistance | How it shows | Inducement that helps |
|---|---|---|
| Vested interests | Loss of power, discretion or rent | Political backing at the top; transparency that removes discretion |
| Fear and insecurity | Staff fear job loss, transfer or deskilling | Consultation, guarantees, retraining, phased change |
| Bureaucratic inertia | Habit, precedent, “this is how it has always been done” | Demonstration projects, champions, peer comparison |
| Professional and cadre jealousies | Generalist–specialist rivalry, service turf | Shared ownership, cross-functional teams |
| Political indifference | Reform has diffuse, long-term gains and visible short-term costs | Linking reform to visible citizen benefits and political credit |
| Resource and capacity gaps | Money, skills, technology lacking | Dedicated budgets, training, external expertise |
| Cultural factors | Status consciousness, distrust of measurement | Leadership by example, gradual normalisation |
- Obstacles in India have repeatedly included weak political will, reports left unimplemented, reforms imposed from above, piecemeal tinkering instead of holistic change, and the absence of a single agency with authority to follow up. The detailed history of Indian reform commissions belongs to Paper II; here the point is that techniques succeed only inside a reform process that has backing, consultation and follow-up.
Indian Connect — Improvement techniques in India’s reform story
- The Paul H. Appleby report, Public Administration in India: Report of a Survey (1953), led directly to the O&M Division (March 1954) and to the Indian Institute of Public Administration (1954), India’s first institutional investment in administrative improvement.
- The First Administrative Reforms Commission (1966–70) and the Second ARC (2005–09) both treated procedure, delegation and information as central: the Second ARC’s eleventh report (Promoting e-Governance: The Smart Way Forward, 2008) insisted that processes be re-engineered before they are computerised, and its twelfth report (Citizen Centric Administration, 2009) recommended the Sevottam model of service-delivery improvement.
- Since 2021 the Department of Administrative Reforms and Public Grievances (DARPG) has driven delayering, delegation, e-Office and the annual Special Campaigns for disposal of pending matters, a modern revival of the O&M function.
2. Organisation and Methods (O&M)
In simple words
O&M is a check-up for an office. A small team of specialists studies how the office is organised and how work moves through it, then suggests simpler forms, fewer steps, better layout and clearer responsibilities. It advises; it does not command.
2.1 Meaning and definitions
- Organisation and Methods is the systematic study of the organisation and procedures of an office or agency in order to improve efficiency, reduce delay and cost, and make the work easier for both staff and public. It is often described as the application of scientific management to office work, and also as an efficiency audit system: a continuous review of departmental structure and procedure.
- A widely quoted classical definition calls O&M work “the improvement of all aspects of transacting business with special emphasis upon procedures and relationships.”
- Its objective is usually summarised as getting the best organisation and the best methods at the minimum outlay and effort.
- Two senses of the term.
- Narrow (British and Indian) sense: O&M stands for Organisation and Methods: the study of structure, office procedure, forms, records, layout and equipment.
- Wide (American) sense: the same letters are often read as Organisation and Management, covering the whole management process: planning, organisation, coordination, direction, staffing and control.
- O&M asks four questions about any piece of work: what is done and why, how it is done, at what cost in time, labour and money, and who should do it. It looks at the design of the administrative machine and its working process, not merely its end product.
2.2 Origin: the British Treasury and its spread
O&M grew out of two pressures: the techniques of industrial efficiency developed after Taylor, and the explosion of government work in the two World Wars.
- 1919: the British Treasury created an Investigating Section to study office machinery and methods across departments.
- 1941: it became the Treasury Organisation and Methods (O&M) Division, at the height of wartime expansion of the civil service, to investigate departments, train staff for departmental O&M sections, develop standard procedures for common services and approve office machinery. In 1942 an advisory panel of businessmen was appointed to guide it, and the Select Committee on National Expenditure pressed for an efficiency officer in every department.
- 1947: a Machinery of Government section was merged into it, widening O&M from office methods to the allocation of functions between departments. After the Fulton Committee (1968) O&M passed to the new Civil Service Department and evolved into “management services”.
- In the United States the same impulse appeared as administrative management: the Brownlow Committee (1937), the management division of the Bureau of the Budget, and the two Hoover Commissions (1949, 1955).
- Wartime industry used time and motion studies to speed up production; from there the ideas moved into public offices, whose work is less mechanical but whose procedures can still be analysed scientifically.
2.3 Objectives of O&M
- Restructure organisation so that effort is well coordinated, and raise efficiency, economy and administrative capability at all levels.
- Simplify procedures, eliminate unnecessary work, delay and paper, and replace outdated rules based on obsolete ideas.
- Give the public a standardised, easy access point and better means of grievance redress.
- Install methods, systems, accommodation and layout that raise efficiency without raising cost.
2.4 Functions of an O&M office
| Function | What it involves |
|---|---|
| Investigation and survey | Studies of a ministry, a section or a procedure, on its own initiative or at a department’s request |
| Organisational and management analysis | Reviewing structure, defining responsibilities and inter-relationships, levels of disposal, delegation |
| Inspection | Periodic management inspections of sections to check whether prescribed procedures are followed; spot advice |
| Research | Studies on current and emerging administrative problems; work and time studies |
| Training | Practical training of officials in office procedure, records management and O&M techniques; training of departmental O&M staff |
| Publications and manuals | Office manuals, procedure codes, checklists and reports for reference and in-service training |
| Records management | Classification, retention and periodic weeding of files |
| Coordination | Guiding and coordinating departmental O&M units; maintaining a common pool of information |
- O&M is a staff function, not a line function. It advises; the line ministry decides and implements. Its legitimacy therefore depends on persuasion and on being seen as a service to departments and a work-improvement study, not a fault-finding mission.
- The O&M officer needs knowledge of government organisation and office work, patience, method, accuracy in collecting facts and the ability to listen; consultation with the employees whose work is being studied is essential.
2.5 Techniques of O&M
O&M uses a small kit of techniques, most of them adapted from industrial engineering.
| Technique | Purpose | Example in a government office |
|---|---|---|
| Efficiency survey (reconnaissance, overall, organisation, functional, procedure surveys; performance audit) | Identify problems, find their causes, propose solutions | Survey of why pension cases take six months |
| Management inspection | Check compliance with prescribed procedure; constructive advice | Annual inspection of a Section under the office manual |
| Process charts and flow charts | Record each step of a procedure using standard symbols so that unnecessary steps stand out | Charting a file’s journey from dak receipt to final order |
| Forms design and forms control | Remove unnecessary forms, merge overlapping ones, design clear forms that collect only needed data | One-page application instead of three overlapping forms |
| Filing and records management | Classify, index, retain and weed records so that papers are found quickly and space is freed | Retention schedules; record rooms; digitisation |
| Office layout | Arrange seats, counters and equipment along the flow of work to cut movement | Single-window counters; open-plan sections |
| Work simplification and work distribution | Eliminate, combine, rearrange and simplify steps; balance workloads | Removing a redundant level of noting |
| Delegation and delayering review | Push decisions to the lowest competent level; reduce levels of submission | Desk Officer system; fewer channels of submission |
| Office mechanisation | Choose machines and later computers suited to the work | Typewriters, punched cards, then e-Office |
- Process charts use five standard symbols, popularised by the American Society of Mechanical Engineers: operation (something is done), inspection (something is checked), transport (something moves), delay (something waits) and storage (something is kept). A chart of a government file usually shows that the file spends most of its life in delay and transport, not in operations, which is exactly what O&M seeks to cut.
2.6 O&M in India
Indian O&M has a clear institutional trail from the first reorganisation committees after Independence to DARPG today.
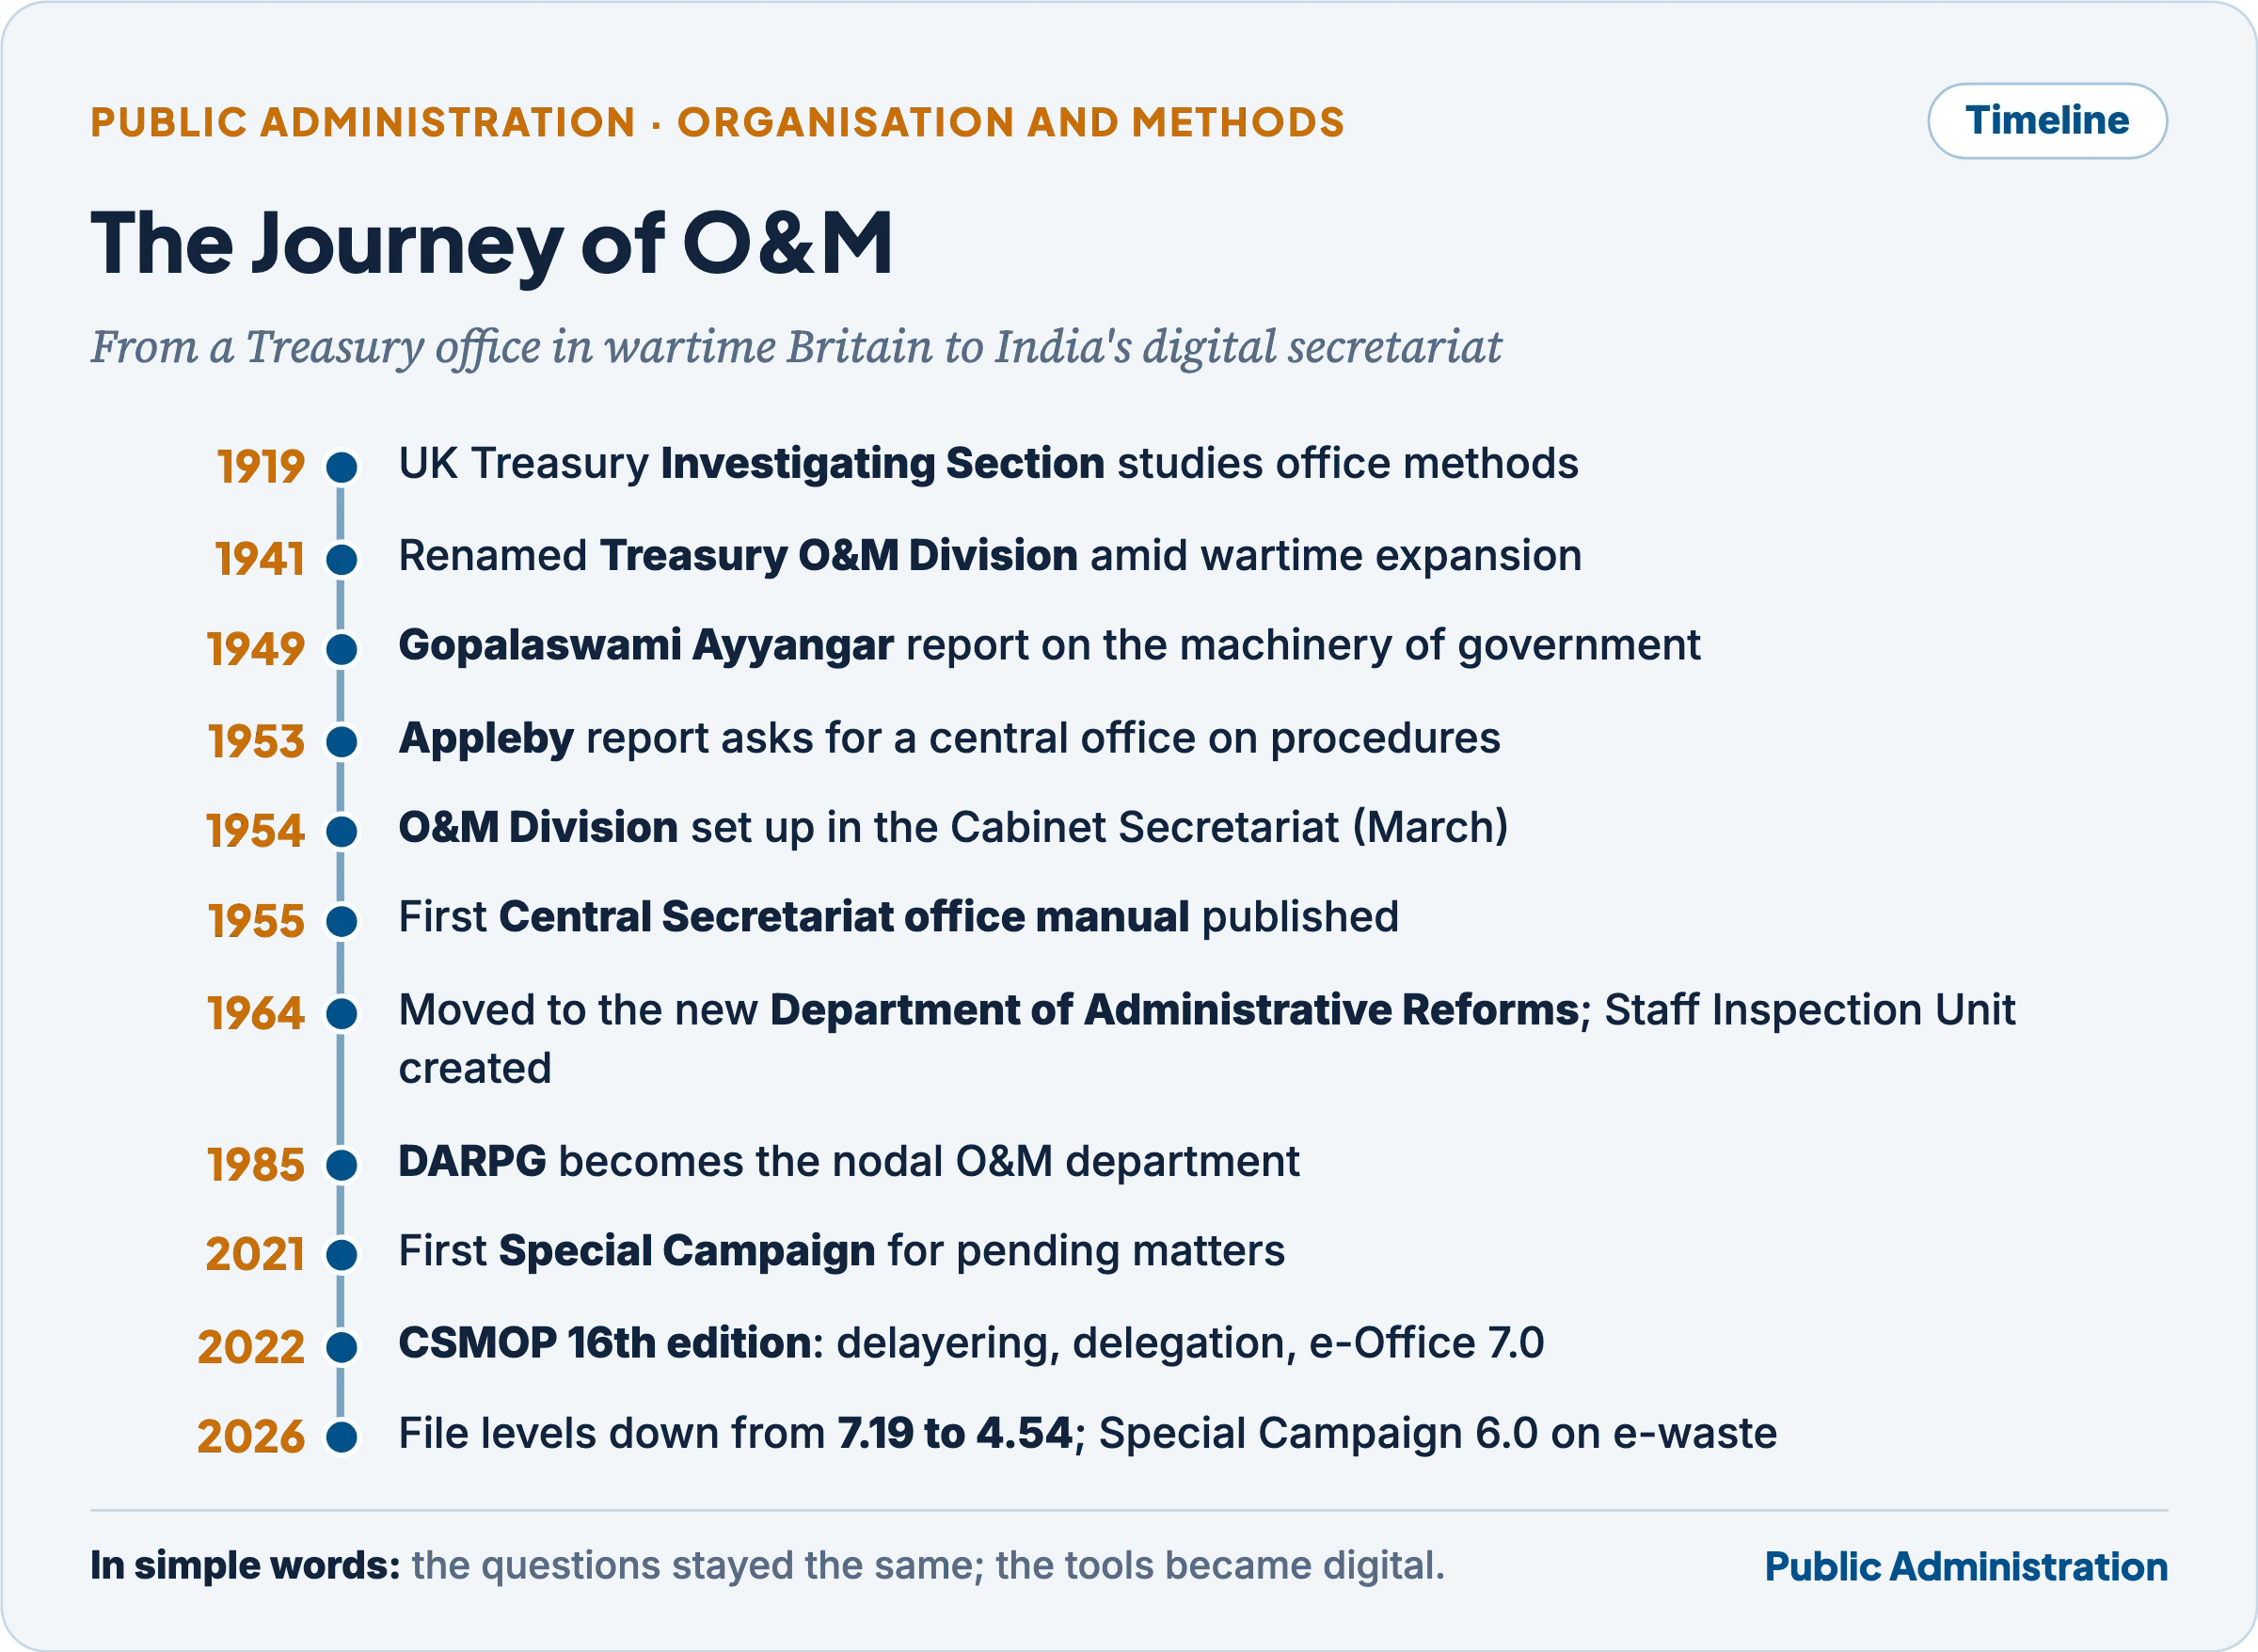
- Early committees. The Secretariat Reorganisation Committee (1947) and N. Gopalaswami Ayyangar’s Report on the Reorganisation of the Machinery of Government (1949) examined the Central Secretariat; Ayyangar recommended a dedicated O&M unit. A.D. Gorwala’s Report on Public Administration (1951) stressed efficiency and probity, and the First Five Year Plan emphasised methods as an instrument of economy and efficiency.
- Appleby and the O&M Division (1954). Paul H. Appleby, the American administrator invited by the Government of India, recommended a central office charged with leadership in organisation, management and procedures. As a result an O&M Division was set up in the Cabinet Secretariat in March 1954. O&M units (later converted into O&M-cum-work-study cells) were set up in ministries, and a Manual of Office Procedure was prepared; the Central Secretariat manual was first published in March 1955.
- Institutional moves. In March 1964 a Department of Administrative Reforms was created in the Ministry of Home Affairs and the O&M Division was transferred to it. Its work passed in 1973 to the Department of Personnel and Administrative Reforms (the Department of Personnel had been created in the Cabinet Secretariat in 1970), which moved to the Home Ministry in 1977. In 1985 a full Ministry of Personnel, Public Grievances and Pensions was formed, with the Department of Administrative Reforms and Public Grievances (DARPG) as the nodal agency for O&M.
- What Indian O&M did.
- Prescribed and revised the Central Secretariat Manual of Office Procedure (CSMOP): dak receipt, noting and drafting, file numbering, levels of disposal, time limits, inspection and records management.
- Conducted inspections of sections, reviews of reports and returns, rules and forms, and consolidation of orders.
- Records management, backed by the Public Records Act, 1993 and the Public Records Rules, 1997: record retention schedules and periodic weeding of files.
- A scheme for modernisation of government offices (from 1987–88) for better layout, equipment and work environment.
- Studies on simplification of codes and procedures and on staffing of housekeeping sections, and training of departmental O&M staff in work study.
Common confusion
Did Paul Appleby recommend O&M in its narrow British sense? Not quite. Appleby asked for a central office giving leadership in organisation, management and procedures, and he imagined O&M work at two levels: a technical level (work measurement, work flow, office management, filing) and a higher management level (studies of structure and policy, and ways of making administration more responsive). In practice the Indian O&M Division settled mostly at the technical level, which is one reason its influence later declined.
2.7 Problems and decline of O&M
By the 1970s O&M in India, as in Britain, had lost much of its early energy.
- Narrowed into routine control: supervisory checks, statistics and disposal returns replaced long-term organisational leadership.
- Advisory without authority: as a staff unit O&M could recommend but not enforce; recommendations were often filed.
- Seen as fault-finding: line officials treated O&M staff as auditors, so cooperation was thin; O&M posts had low status and specialist skills were scarce.
- Ritualism: inspections and returns became paper exercises; the manual itself became a source of red tape.
- Narrow focus and displacement: O&M dealt with paper flow while policy, delegation, technology and the citizen interface went to reform commissions, computerisation projects and later BPR; “O&M” sounded like a relic of the typewriter age.
2.8 O&M reinvented: CSMOP 2022, e-Office and the Special Campaigns
Since about 2020 the old O&M agenda of delayering, delegation, records management and pendency has returned under new names and with digital tools.
- CSMOP 2022 (16th edition). Launched by DARPG on 5 August 2022, it built in the reforms of 2020–21 through a four-pronged approach: delayering (fewer levels of submission), delegation (financial and administrative powers pushed down), operationalisation of the Desk Officer system, and digitisation of Central Registration Units with implementation of e-Office version 7.0. It also incorporated weekly Swachhata work, nodal appellate authorities for public grievances and an e-Office digitisation framework.
- e-Office replaced paper files with electronic files, digital noting and time-stamped movement. DARPG’s monthly Secretariat Reforms report for March 2026 shows:
- the average number of distinct levels a file passes through fell from 7.19 in 2021 to 4.54 in March 2026;
- 95.53% of receipts in the Central Secretariat were e-receipts; e-files formed about 90% of active files.
This is classic O&M measurement (levels of submission, channels, delay) done continuously by software instead of by periodic inspection.
- Special Campaigns for Swachhata and Disposal of Pending Matters, run every October since 2021 with DARPG as nodal department, are O&M campaigns in a modern form: record review and weeding, scrap disposal, freeing office space, clearing references from MPs, the PMO and State Governments, public grievance appeals, and simplification of rules and processes.
- Special Campaign 5.0 (2–31 October 2025): as reported on 31 October 2025, about 7.31 lakh cleanliness campaigns, 202.97 lakh sq ft of office space freed, ₹551.93 crore earned from scrap and e-waste disposal, 13.44 lakh physical files weeded out and 470 rules and processes simplified.
- Cumulatively from 2021 to October 2025 the campaigns had freed about 844 lakh sq ft and earned about ₹3,684 crore.
- Special Campaign 6.0 (preparatory phase from mid-September; implementation 2–31 October 2026) focuses on collection, segregation and disposal of e-waste, with a third-party evaluation phase after the campaign. Between campaigns, ministries report pendency monthly on the SCDPM portal.
Indian Connect — O&M then and now
- Then (1954–1980s): a central O&M Division, O&M units in ministries, a printed office manual, periodic inspections, forms and records reviews.
- Now: DARPG’s O&M wing issues the CSMOP, runs e-Office analytics, the Secretariat Reforms monthly report and the Special Campaigns; the official memoranda for Special Campaign 6.0 were issued under DARPG’s O&M file series.
- The continuity: the questions are the same (how many levels, how long a file waits, how many forms and records are needed), but measurement is now continuous, digital and published.
2.9 Should there be a separate O&M organisation? O&M and related techniques
- For a separate agency: officials immersed in daily work lack the time and detachment to study their own procedures; a specialist body brings a fresh mind and cross-departmental experience, sets uniform standards for common services (dak, records, forms, manuals) and trains departmental staff.
- Against, or for a different model: a separate agency can become a bureaucracy of its own, producing inspections rather than improvement, and change imposed from outside meets resistance.
- Modern practice combines a small central nodal unit (standards, tools, data, campaigns) with improvement embedded in line management (process owners, dashboards, peer benchmarking).
O&M sits in a family of overlapping techniques; the differences lie in scope and philosophy.
| Technique | Main question | Scope | Philosophy |
|---|---|---|---|
| O&M | Is the office organised and are its procedures efficient? | Structure and office procedure | Incremental improvement within existing rules |
| Work study | What is the best method and the standard time for this job? | Individual tasks and jobs | Measurement and standardisation |
| Management audit / efficiency audit | Is the organisation’s management system sound? | Whole organisation | Evaluation and review |
| Performance audit (by CAG) | Were economy, efficiency and effectiveness achieved? | Programmes and expenditure | External accountability |
| Business Process Re-engineering | Should this process exist at all, and what would we design from scratch? | End-to-end processes across units | Radical redesign, often enabled by IT |
- O&M and work study are close cousins: O&M looks at organisation and procedure, work study at method and time. Together they make up “management services”.
- BPR is sometimes presented as the opposite of O&M: O&M accepts the structure and tidies it; BPR questions whether the structure and the process should exist at all. In practice the two are stages on one continuum, and digital re-engineering still depends on O&M’s careful mapping of existing procedure.
3. Work Study and Work Management
In simple words
Work study asks two plain questions about any job: is there a better way to do it, and how long should it take when done that way? Once you know both, you can plan staff, set fair targets and stop arguing from guesswork.
3.1 Meaning
- Work study is a generic term for those techniques, chiefly method study and work measurement, that are used to examine human work in all its contexts and that lead systematically to the investigation of every factor affecting the efficiency and economy of the situation being reviewed, in order to bring about improvement. This is the standard formulation of the International Labour Organization (ILO), whose manual Introduction to Work Study (first published 1957) carried the technique worldwide.
- In brief, work study is the systematic study of an operation or process to ensure the best possible use of the human and material resources available.
- It comprises all systematic activities concerned with the investigation, recording, measurement and improvement of work. It succeeds because it is systematic twice over: in investigating a problem (nothing is overlooked) and in developing a solution (alternatives are compared on evidence).
Narrower and wider senses of work study:
| Sense | Coverage |
|---|---|
| Narrower | Only its two classical components: method study (how) and work measurement (how long), applied to specific jobs |
| Wider | A whole “management services” approach: O&M, work simplification, job design, ergonomics, layout, materials handling, incentive design, manpower planning and, today, process analysis and BPR |
3.2 Roots: Taylor and the Gilbreths
- Frederick Taylor introduced time study with a stopwatch to replace arbitrary piece-rate quotas by scientifically determined standards. Fixing a fair quota through measurement was a step forward for both management and workers, at a time when rule-of-thumb quotas were normal.
- Frank and Lillian Gilbreth developed motion study, breaking work into basic elements (their therbligs, “Gilbreth” spelt backwards) to remove wasted movements.
- From these two strands came the two components of modern work study: method study (from motion study) and work measurement (from time study).
3.3 Method study
Method study is the systematic recording and critical examination of existing and proposed ways of doing work, as a means of developing and applying easier and more effective methods and reducing costs.
Objectives:
- Analyse and document methods of work and gain insight into how work is actually done.
- Improve processes, procedures, layout and the design of equipment and workplace.
- Reduce unnecessary effort, fatigue and hazards; improve safety.
- Explore opportunities for mechanisation; provide the basis for time study, wage calculation and incentive schemes.
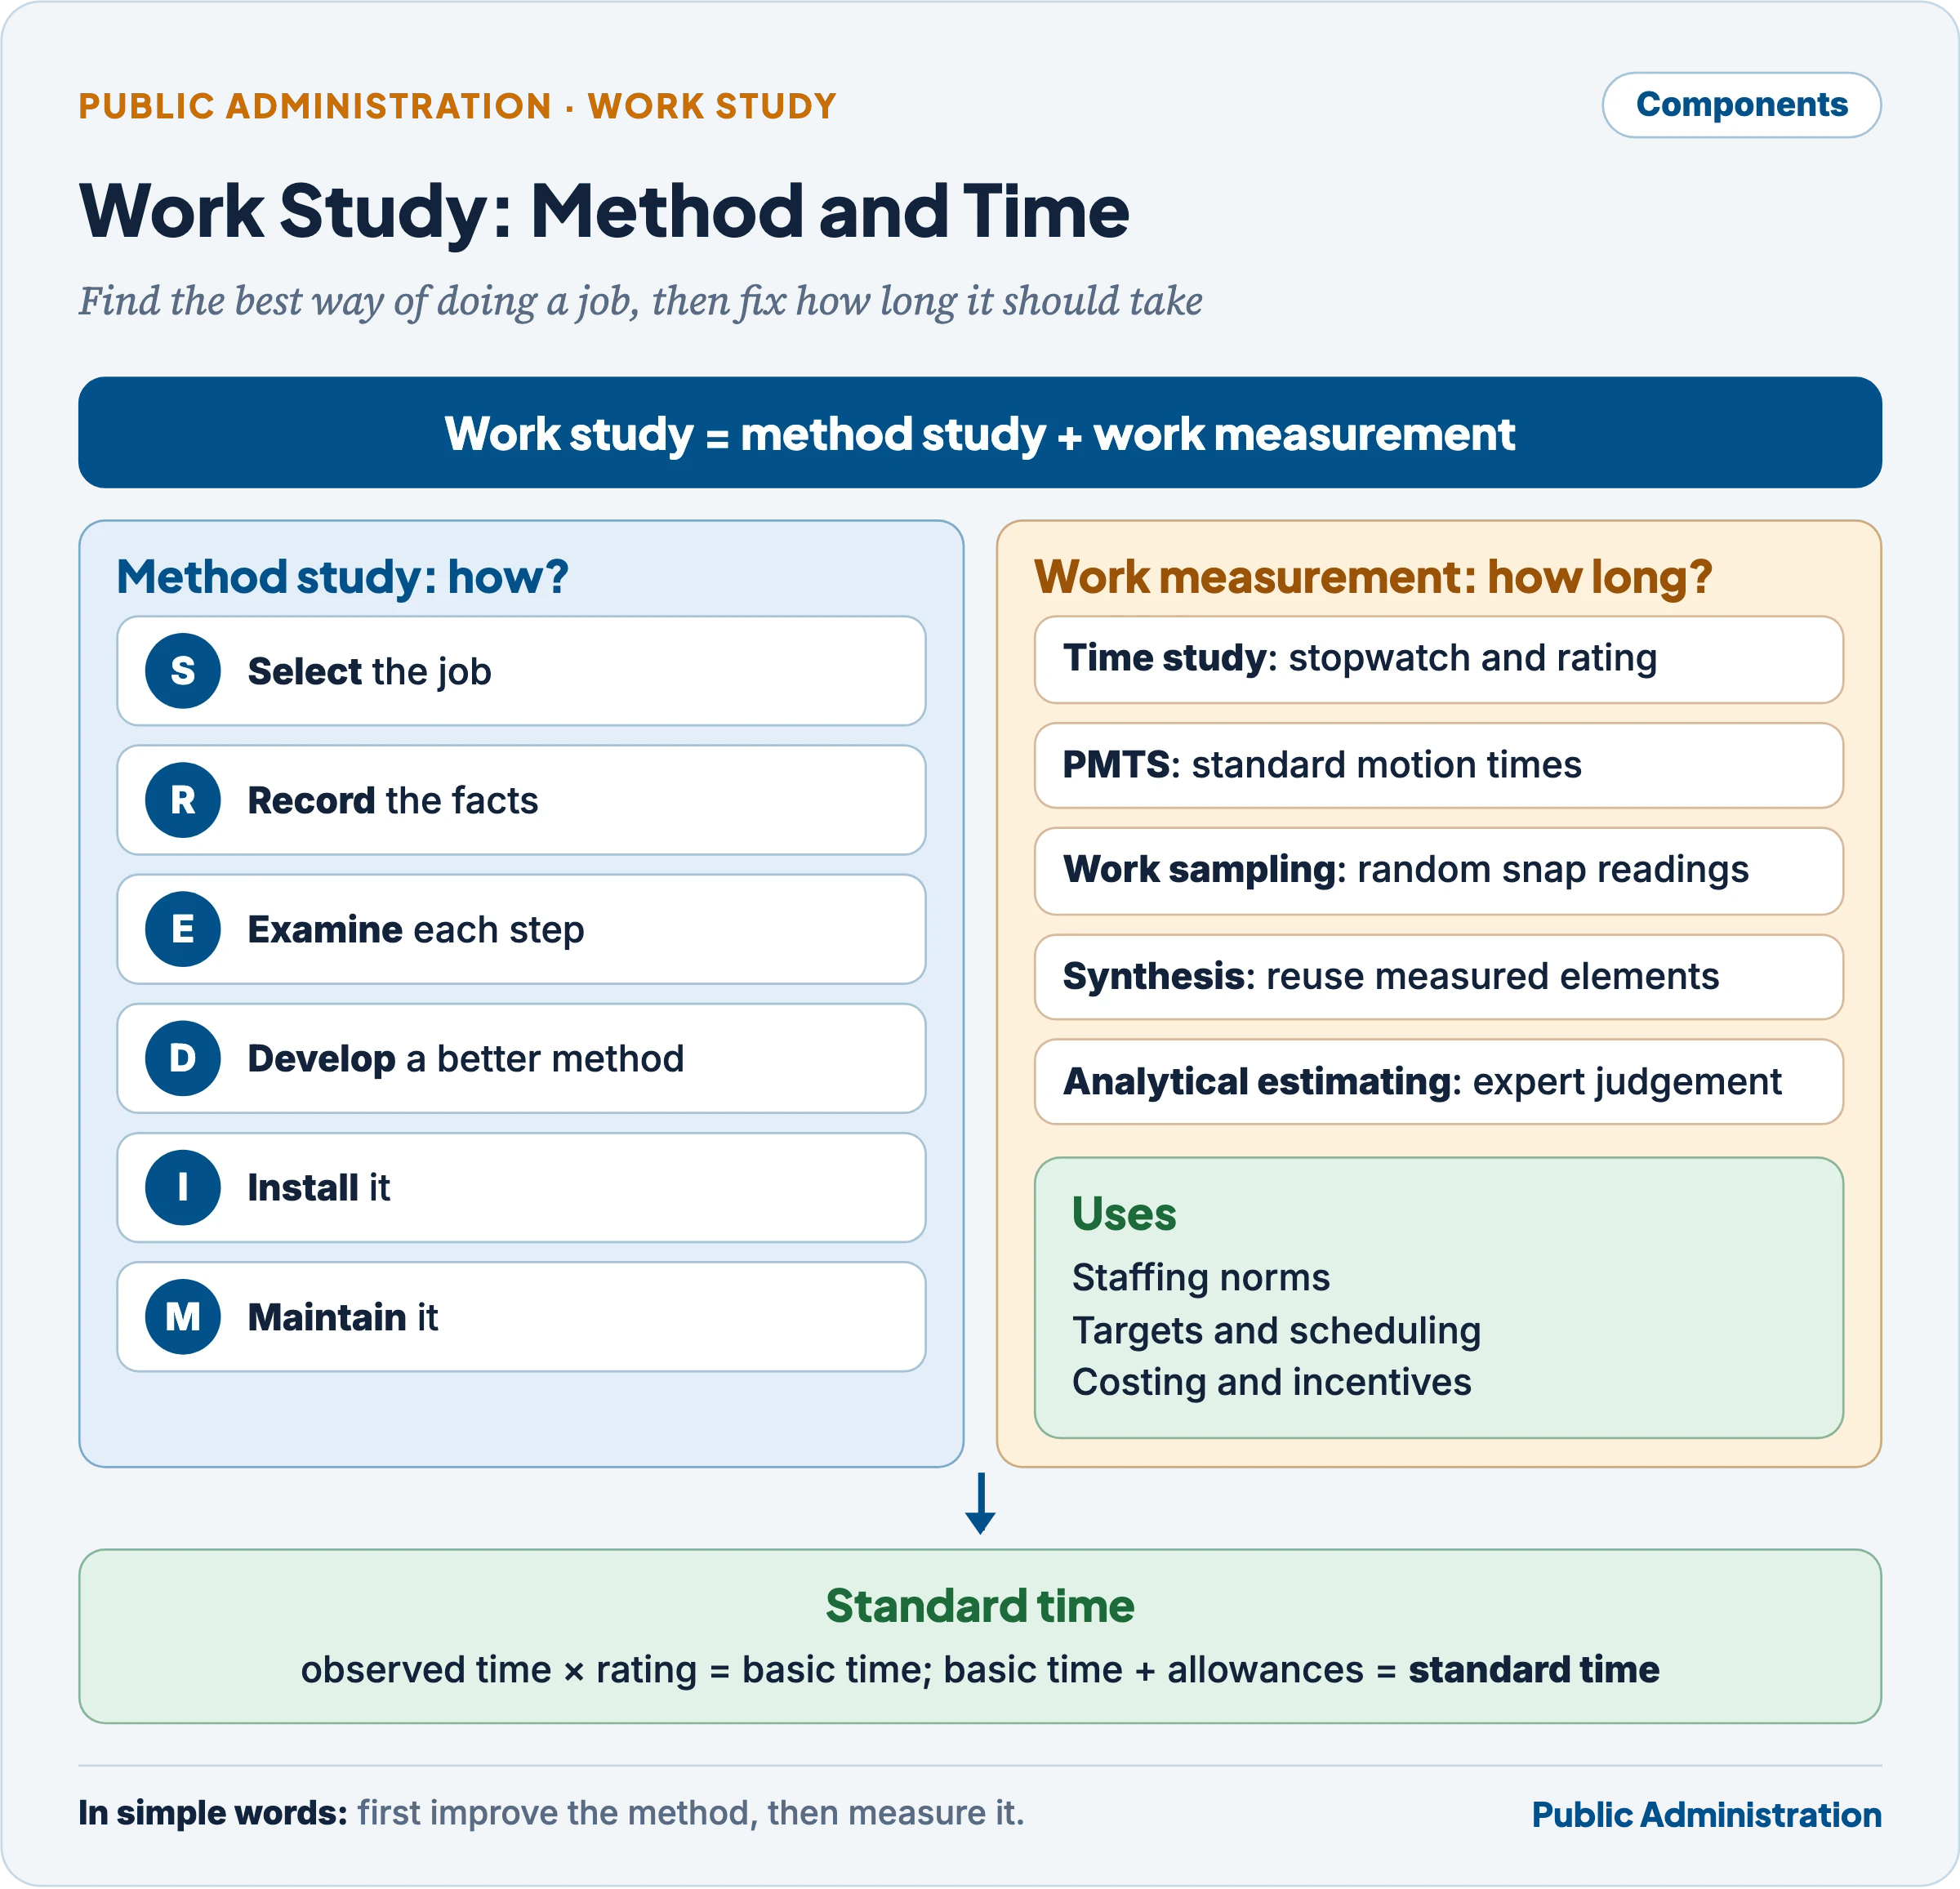
The six steps, remembered as SREDIM:
- Select the job or process to be studied (one with delay, cost, complaints or bottlenecks).
- Record all relevant facts of the present method by direct observation, using process charts, flow diagrams, string diagrams and multiple-activity charts.
- Examine the facts critically by asking what is done, where, when, by whom and how, and why each step is necessary.
- Develop the most practical, economical and effective method, considering alternatives (eliminate, combine, rearrange, simplify).
- Install the new method: issue instructions, train staff, and make the new way standard practice.
- Maintain it: check regularly that old methods do not creep back and that the new method is followed; measure performance under the new regime.
A government example (illustrative). A method study of a mid-day meal kitchen would record each activity (receiving grain, cleaning, cooking, transporting, serving, washing), the persons involved, the equipment used and the materials moved; question each step; test alternatives (central kitchen versus school kitchen, re-sequenced tasks, better utensils); and then issue new instructions, train cooks and monitor results.
3.4 Work measurement
Work measurement is the application of techniques designed to establish the time for a qualified worker to carry out a specified job at a defined level of performance. Time study is its best-known form.
Objectives of work measurement:
- Establish standard times for jobs.
- Rate the performance of workers fairly.
- Calculate capacity and staff requirements (how many clerks a section needs for its workload).
- Work out the total work content of a product or service; plan and schedule; cost activities; design incentives.
Main techniques:
| Technique | How it works | Best suited to |
|---|---|---|
| Time study | Observe a qualified worker with a stopwatch over several cycles; rate the observed pace against a standard; add allowances | Short, repetitive, observable tasks |
| Predetermined Motion Time Systems (PMTS) | Break the job into basic motions (reach, grasp, move, position) and add standard times from tables, such as Methods-Time Measurement (MTM, 1948) | Designing a job before it exists; very short cycles |
| Work sampling (activity sampling) | Take many random “snap” observations to estimate what proportion of time is spent on each activity or idle; developed by the British statistician L.H.C. Tippett in the 1930s | Long, varied, non-repetitive work such as clerical and supervisory jobs |
| Synthesis from standard data | Build the time for a new job from elemental times already measured | Families of similar jobs |
| Analytical estimating | Experienced estimators judge times for parts of a job where measurement is impractical | Maintenance, one-off and professional work |
Inputs and outputs of a time study:
- Inputs: the documented method from a method study, observations of the job, and time readings.
- Outputs: standard times for the job, a completed time-study sheet with ratings, and knowledge of the work content of the service or product.
Standard time, worked example (illustrative numbers):
- A clerk is observed processing a scholarship application in an average observed time of 10 minutes.
- The observer rates the clerk’s pace at 90% of standard performance, so basic time = 10 × 0.90 = 9.0 minutes.
- Allowances for rest, personal needs and unavoidable contingencies are fixed at 15%, so standard time = 9.0 × 1.15 ≈ 10.35 minutes.
- If the office receives 2,000 applications a month and a clerk has about 6,000 productive minutes a month, the section needs about 2,000 × 10.35 ÷ 6,000 ≈ 3.5, that is four clerks. This is how work measurement turns into staffing norms.
3.5 Positive attributes of work study
- Higher productivity without large capital outlay: reorganising work costs little compared with new equipment.
- Lower costs of labour, material and overheads, with better cost control and costing.
- Objective standards for staffing, scheduling, targets and incentives, replacing bargaining from guesswork; measured standards protect workers from arbitrary quotas as much as they protect management from slack.
- Procedural streamlining, better quality, safety and working conditions, and more even distribution of work.
- Data for planning capacity, workload and manpower.
3.6 Work simplification and work management
- Work simplification is the organised use of common sense to find easier and better ways of doing work, usually by involving the workers themselves. Its tools are the same questioning techniques, applied by supervisors and staff rather than specialists.
- Work management is the wider task of planning, allocating, scheduling, monitoring and controlling work: setting norms, distributing work evenly, prescribing time limits for disposal, reviewing arrears and pending cases, and matching staff to workload.
- In government, work management appears in the office manual’s time limits, pendency statements, arrear lists, levels of disposal, the Desk Officer system and now the e-Office analytics that show how long each file waits at each desk.
3.7 Work study in Indian administration
- O&M-cum-work-study units: the Central O&M Division helped ministries convert their O&M units into O&M-cum-work-study cells and trained their staff in work study, so that procedures and staffing could be studied together.
- Staff Inspection Unit (SIU). Set up in 1964 in the Ministry of Finance (now under the Department of Expenditure), the SIU aims at economy in staffing consistent with administrative efficiency and at evolving performance standards and work norms for government offices and bodies wholly or substantially dependent on government grants.
- Its teams conduct on-the-spot work measurement studies, discuss findings with senior officials and issue assessment reports on the staff an organisation actually needs.
- Requests are routed through each ministry’s Financial Adviser; the final report must be implemented within three months.
- Scientific and technical organisations are studied by committees with an SIU member rather than by the SIU alone.
- Uses in India: fixing staffing norms for secretariat sections and subordinate offices, manpower assessment before creation of posts, rationalisation of surplus staff, and yardsticks for workload in large departments such as the Railways and Posts.
Indian Connect — Work study and work measurement in Indian administration
- Norms: the SIU’s work-measured staffing norms are the main barrier between a ministry’s demand for posts and the Finance Ministry’s approval.
- Pendency as a measure: CSMOP time limits, weekly arrear statements and the e-Office “distinct levels” metric are work-management measures; DARPG’s monthly reports now publish them ministry by ministry.
- Limits seen in practice: norms age quickly when work is digitised, and much secretariat work (policy, coordination, parliamentary work) resists stopwatch measurement; activity sampling and analytical estimating are therefore more useful than time study for such work.
3.8 Limits of work study in public service
- Measurability: policy analysis, negotiation, adjudication and counselling are non-repetitive and judgement-based; standard times for them are rough at best.
- Output, not outcome: work study counts files disposed, not correct decisions or satisfied citizens.
- Human relations critique: the Hawthorne studies showed that productivity depends on morale and group norms; time study can feel like surveillance and provoke resistance from staff associations.
- Subjective rating of pace, and static norms that age with each change in technology.
- Causes outside the worker: delay often comes from cumbersome systems, slow computers, lack of investment or poor management, not from staff inefficiency.
4. Management by Objectives (MBO)
In simple words
MBO means agreeing in advance what each officer is supposed to achieve, letting them plan how to get there, and then judging them by the results. It replaces “do what you are told” with “achieve what we agreed”.
4.1 Drucker’s idea
- Peter Drucker, the Austrian-born American management thinker, gave the concept its name and modern form in The Practice of Management (1954). He built on practices such as Harold Smiddy’s monthly manager’s letters at General Electric, in which managers set goals and reported results against them; precursors included Fayol, Follett and Barnard, who stressed objectives without using the term.
- Drucker’s argument:
- Management “by drive” or by crisis produces misdirection; effective management must direct the vision and effort of all managers towards common goals.
- Each manager, from senior executive to foreman, must have clearly spelt-out objectives derived from the organisation’s goals, and must participate in setting them.
- Performance is measured against these objectives, and each manager receives the information needed to measure his own performance.
- The greatest benefit is that MBO replaces management by domination with management by self-control: managers control their own work against agreed goals, which gives stronger motivation, higher standards and broader vision.
- George Odiorne‘s Management by Objectives (1965) turned the idea into a system; George Doran (1981) later popularised SMART objectives (specific, measurable, assignable, realistic, time-bound).
4.2 The MBO cycle
- Define organisational goals at the top.
- Set unit and individual objectives jointly between superior and subordinate, with measurable indicators and deadlines.
- Action planning: the subordinate decides how to reach the objectives.
- Periodic review of progress; correct course or revise objectives.
- Appraisal of performance against objectives at the end of the period, linked to development and rewards.
- Feedback into the next cycle’s goal-setting.
4.3 MBO in government
- MBO suits government in principle because it forces agencies to state objectives and link activity to results. It shaped performance budgeting, outcome budgeting and performance management systems worldwide; the United States adopted a presidential MBO initiative in the early 1970s.
- Indian echoes:
- Performance budgeting, recommended by the First ARC and introduced in the late 1960s and 1970s.
- Outcome Budget (2005) linking outlays to outputs and outcomes, and the Output–Outcome Monitoring Framework (from 2017–18) run with NITI Aayog’s monitoring and evaluation office.
- Results-Framework Documents (RFD) under the Performance Monitoring and Evaluation System (2009): each department signed an annual document of objectives, success indicators and targets, a direct application of MBO, later discontinued.
4.4 Critique of MBO
- Goals in government are many, vague and conflicting (equity, efficiency, legality, political responsiveness); reducing them to measurable targets distorts priorities.
- Short-termism and gaming: what is measured gets done; what is not measured is neglected; targets invite manipulation of data.
- Participation can be a façade: Halpern and Osofsky argued that Drucker gave the subordinate no protection against a superior’s manipulation or arbitrariness and no appeal; Harry Levinson‘s well-known article “Management by Whose Objectives?” (1970) made the same point.
- Weak link to rewards: studies found MBO often failed to link performance with evaluation and reward.
- No theory, only technique, and difficult to implement; organisations often end up over-emphasising control rather than creativity.
- W. Edwards Deming, the quality pioneer, went further: one of his fourteen points for management was to eliminate management by objective and numerical goals, which he thought substituted targets for leadership and process improvement.
4.5 Drucker on the “principles” of management
- In Management Challenges for the 21st Century (1999), Drucker accepted a few principles of organisation (transparency, a final authority, authority commensurate with responsibility, one master, as few layers as possible) but said that “these principles do not tell us what to do. They only tell us what not to do.” They do not say what will work, only what is unlikely to work.
- His analogy is an architect: building principles do not tell the architect what building to design; they state the constraints within which any design must stay.
- Is he justified?
- Yes: Herbert Simon had already shown that classical “principles” contradict each other like proverbs (span of control versus fewer levels); contingency theory shows that the right structure depends on task, technology and environment; Drucker himself insisted there is no single right organisation, only tools suited to particular tasks.
- Partly: principles do give positive guidance in recurring situations (unity of command in a crisis, clear accountability), and MBO itself is Drucker’s positive prescription.
- For administrative improvement, the lesson is modest: techniques and principles identify pitfalls (too many layers, divided command, unmeasured workloads), but the design of a solution needs judgement about the specific context.
5. Network Analysis: The Common Grammar of PERT and CPM
In simple words
Organising a seminar involves many jobs: fixing the theme, inviting speakers, booking a hall, printing the programme. Some jobs must wait for others; some can run side by side. Network analysis draws these jobs as a map of arrows and circles, so you can see which chain of jobs decides the final date and where you have spare time.
5.1 Projects and the limits of the Gantt chart
- A project is a temporary, unique undertaking with a definite start and finish: building a bridge, holding an election, conducting a census, launching a scheme. Unlike routine work, it is not repeated in the same form, so it needs special methods of planning and control.
- Every project can be broken into separate activities, each with a duration, and precedence relationships that decide their order (walls before roof).
- The Gantt chart, developed by the American engineer Henry L. Gantt in the 1910s, is a horizontal bar chart: tasks on the vertical axis, time on the horizontal axis, a bar for each task’s timing. It gives a clear picture of schedule and status.
- Its weakness: it does not show dependencies. One cannot tell from a Gantt chart how a delay in one task affects the others or the final date. Network analysis, PERT and CPM were developed in the late 1950s as extensions of the Gantt chart to overcome exactly this.
5.2 Basic concepts
| Concept | Meaning | Notation |
|---|---|---|
| Activity | A task that consumes time and resources (inviting speakers) | Arrow (in activity-on-arrow networks) |
| Event (node) | A point in time marking the start or completion of activities; consumes no time or resources | Circle, numbered |
| Predecessor / successor | An activity that must finish before another can start / the one that follows | Arrow order |
| Dummy activity | An imaginary activity of zero time and resources, used only to show a logical dependency or to keep two activities distinct | Dotted arrow |
| Earliest event time (TE) | Earliest time an event can occur; found by a forward pass adding the longest chain of activity times before it | Above node |
| Latest event time (TL) | Latest time an event can occur without delaying the project; found by a backward pass from the final event | Above node |
| Slack (event) | TL − TE for an event: how long it can slip without delaying the project | |
| Float (activity) | Total float = latest start − earliest start of an activity; free float is the delay that does not affect the next activity | |
| Critical path | The longest path through the network; its length is the shortest possible project duration; its activities have zero float | Bold or double line |
| Near-critical path | A path with very little float; can become critical if delays occur | |
| Work Breakdown Structure (WBS) | A tree that breaks the project into subsystems and sub-subsystems from which activities are derived |
- Two drawing conventions: activity-on-arrow (AOA), used in classic PERT, where arrows are activities and circles are events; and activity-on-node (AON), used in most modern software, where boxes are activities and arrows only show dependency (no dummies needed).
- Sequential and parallel work: activities in a predecessor–successor relationship occur in series; activities that are independent of one another can run in parallel.
- Negative slack appears when a project is already behind schedule: the latest allowable time is earlier than the earliest expected time.
5.3 The four stages of network analysis
- Network generation: define the goal and final event; build a work breakdown structure; let each subsystem head draw a mini-network; combine them into a system-level network with time (and sometimes cost) estimates; review it jointly to catch missing events, wrong sequences and over-optimistic estimates.
- Network evaluation: run the forward pass (earliest times) and backward pass (latest times); identify the critical path; test whether the completion date is acceptable, which interfaces are risky and whether the critical path can be shortened.
- Network monitoring: track progress on a time-scaled chart, highlight the critical path and compare planned and actual expenditure.
- Network modification: update the plan when goals, resources or time change, without letting updating cost more effort than it saves.
Advantages of network planning:
- Forces disciplined, logical thinking about what must be done, by whom, in what order and at what cost.
- Shows interdependencies among parts of a project and the effect of a delay in one part on the whole.
- Provides a basis for systematic evaluation of alternatives (combine, eliminate or accelerate activities).
- Improves communication and teamwork; a visual tool for orienting new members and reporting progress.
- Fixes responsibility for each event in advance, so that less “falls through the cracks”.
- Gives early warning of trouble and directs managerial attention to the critical few activities (management by exception).
5.4 Network analysis in a second sense: relations
The phrase “network analysis” also names a different body of work: social network analysis, the study of relations among actors (people, agencies, organisations) rather than their attributes. This sense matters for network governance, inter-agency coordination and policy networks.
- Relations are the building blocks: a network is a set of actors (nodes) and the ties among them; the structure of ties explains behaviour better than the characteristics of actors in isolation.
- David Knoke and James Kuklinski, Network Analysis (1982), following the sociologist Georg Simmel, distinguish the form and the content of relations.
- Form is independent of substance: the intensity or strength of a tie and its direction (none, one-way, mutual).
- Content is what the tie is about. Their typology: transaction relations (exchange of goods or symbols), communication relations (channels for messages), boundary-penetration relations (overlapping membership, such as interlocking boards), instrumental relations (contacts made to obtain goods, services or information), sentiment relations (liking, respect, hostility), authority/power relations (rights to command and duties to obey, typical of formal hierarchy) and kinship and descent relations.
- Use in administration: mapping which departments actually consult each other on a project, identifying brokers and bottlenecks, analysing policy communities and implementation networks.
Common confusion
Is “network analysis” in the syllabus only PERT and CPM? In the management-tools sense, yes: network analysis is the family of project-planning techniques (PERT, CPM and their variants) that represent a project as a network of activities and events. But the same words are used for social network analysis, which studies relations among actors. The two share the idea of nodes and links, yet one schedules tasks in time and the other maps ties among actors. A question that speaks of “relations as building blocks” refers to the second sense.
6. Programme Evaluation and Review Technique (PERT)
In simple words
When you have never done a job before, you cannot say exactly how long it will take. PERT asks for three guesses (best case, likely case, worst case), combines them into one expected time, and tells you how likely you are to finish by a given date.
6.1 Background and development
- PERT was developed in 1958 by the Special Projects Office of the US Navy’s Bureau of Ordnance, with the management consultants Booz, Allen and Hamilton and Lockheed, to plan and control the Polaris submarine-launched ballistic missile programme, which involved thousands of contractors and many research activities never attempted before.
- Its distinctive problem was uncertainty: research and development tasks had no history from which reliable durations could be taken. PERT therefore treats activity times as probabilistic.
- Originally PERT concentrated on time and ignored cost; PERT/COST (from 1962) added cost, but translating time into cost made the system complex and limited its use.
- After its success PERT became fashionable: many US federal agencies required it of contractors, and elaborate computer versions multiplied. A retreat followed when managers found that heavy computer-based planning was costly, rigid and changed influence patterns in organisations; simpler, low-cost uses survived.
6.2 Three time estimates and the expected time
For each activity PERT asks the people responsible for three estimates:
- Optimistic time (a): the shortest time if everything goes well (it should be beaten no more than about once in a hundred tries).
- Most likely time (m): the time the activity would normally take.
- Pessimistic time (b): the longest time if things go badly (excluding catastrophes).
Assuming the activity time follows a beta distribution, PERT computes:
- Expected time: te = (a + 4m + b) ÷ 6, a weighted average that gives the most likely estimate four times the weight of each extreme.
- Standard deviation: σ = (b − a) ÷ 6; variance = σ². The wider the gap between optimistic and pessimistic estimates, the greater the uncertainty.
- Project uncertainty: the variance of the project duration is the sum of the variances of activities on the critical path; its square root is the standard deviation of the project.
- Probability of meeting a deadline (Ts): Z = (Ts − TE) ÷ σ(critical path), read from a normal-distribution table. If the deadline equals the expected completion time, Z = 0 and the probability is 50%; if the deadline is one standard deviation later, the probability is about 84%.
6.3 Steps in applying PERT
- Define the project and its final objective; prepare the work breakdown structure.
- List all activities and events and their precedence relationships.
- Draw the network (circles for events, arrows for activities, dummies where needed); number events so that each arrow runs from a lower to a higher number.
- Obtain three time estimates for each activity; compute te and variance.
- Forward pass: compute the earliest expected time (TE) of every event.
- Backward pass: compute the latest allowable time (TL) of every event.
- Compute slack for each event and identify the critical path (zero slack).
- Compute the probability of completing by the scheduled date.
- Monitor and update the network as work proceeds; reallocate resources from slack paths to critical ones.
6.4 Worked example: a PERT chart for a seminar
All figures below are illustrative, chosen to show the method. A ministry plans a one-day national seminar. Six activities and one dummy are identified.
| Activity | Events | Description | a | m | b | te = (a+4m+b)/6 | Variance |
|---|---|---|---|---|---|---|---|
| A | 1 → 2 | Fix theme, date and budget | 1 | 2 | 3 | 2 | 0.11 |
| B | 2 → 3 | Invite and confirm speakers | 2 | 4 | 6 | 4 | 0.44 |
| C | 2 → 4 | Book venue and logistics | 1 | 2 | 9 | 3 | 1.78 |
| Dummy | 4 → 3 | Programme cannot be printed until venue is fixed | – | – | – | 0 | – |
| D | 3 → 5 | Print programme and publicity | 1 | 3 | 5 | 3 | 0.44 |
| E | 4 → 5 | Arrange catering and audio-visual | 1 | 1 | 7 | 2 | 1.00 |
| F | 5 → 6 | Registration and rehearsal | 1 | 2 | 3 | 2 | 0.11 |
(Times in weeks.)
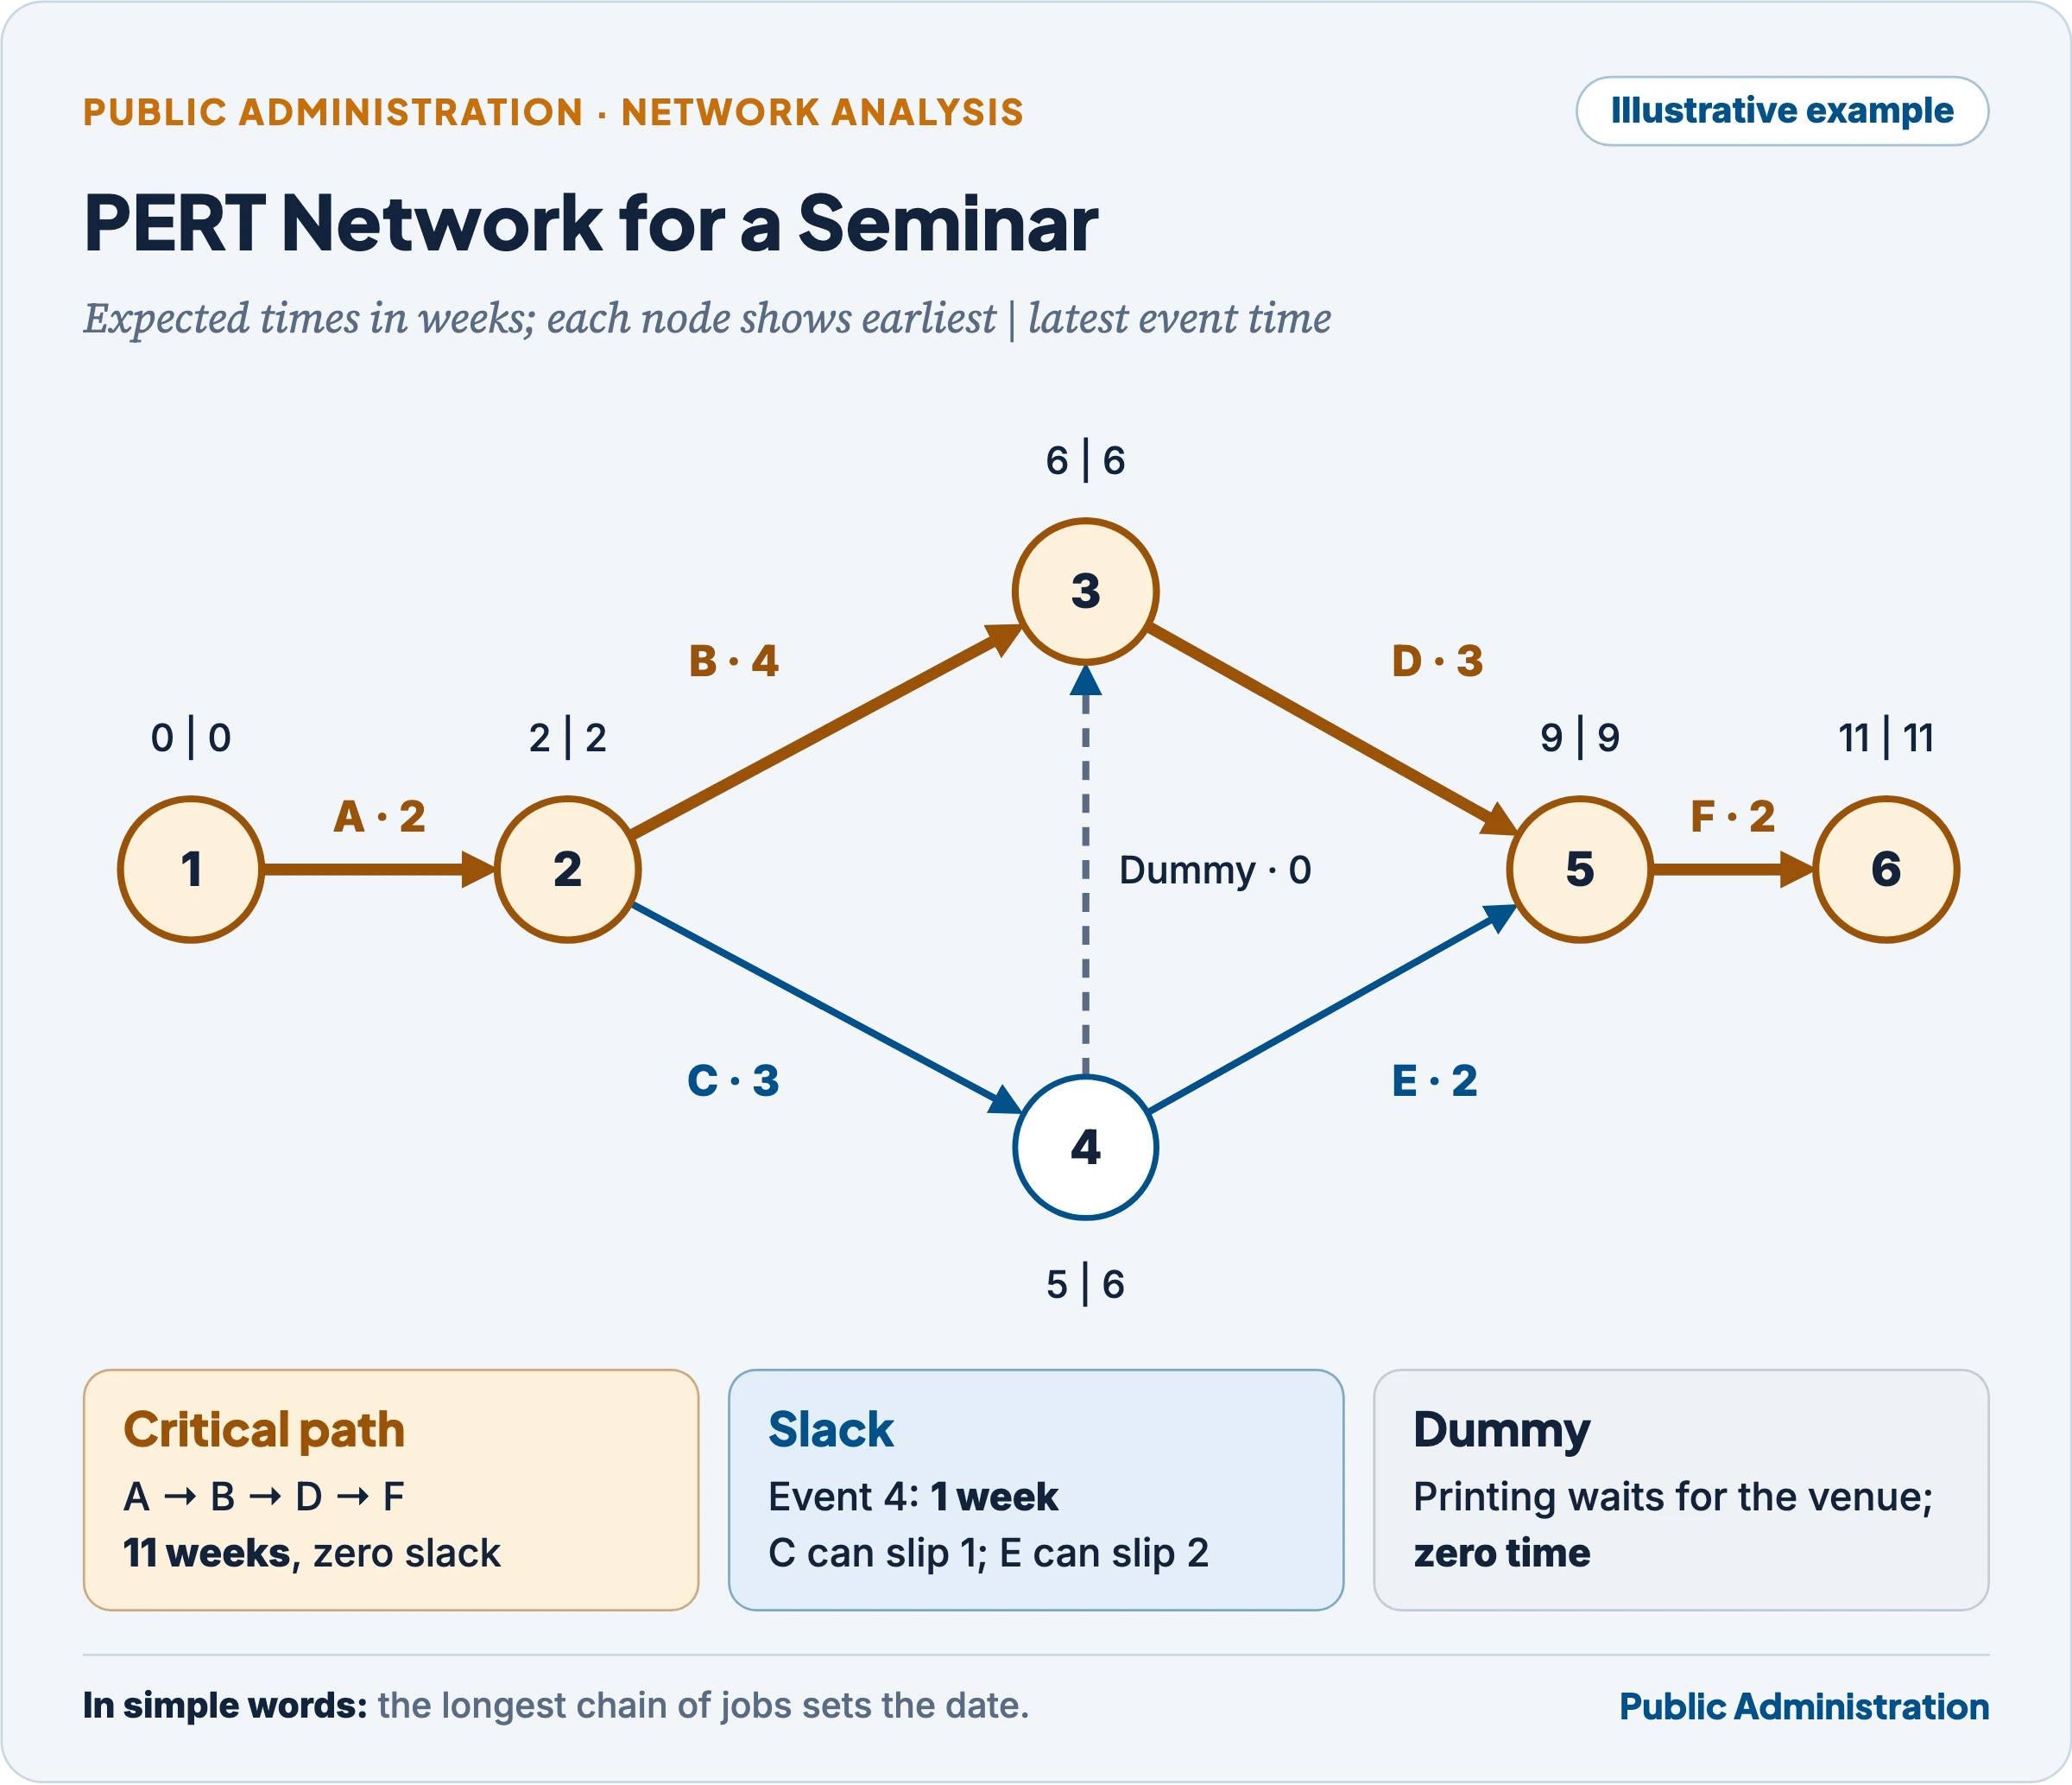
- Forward pass (earliest times): TE1 = 0; TE2 = 2; TE4 = 2 + 3 = 5; TE3 = the later of 2 + 4 = 6 (via B) and 5 + 0 = 5 (via the dummy) = 6; TE5 = the later of 6 + 3 = 9 and 5 + 2 = 7 = 9; TE6 = 9 + 2 = 11 weeks.
- Backward pass (latest times): TL6 = 11; TL5 = 9; TL3 = 6; TL4 = the earlier of 6 − 0 = 6 and 9 − 2 = 7 = 6; TL2 = the earlier of 6 − 4 = 2 and 6 − 3 = 3 = 2; TL1 = 0.
- Slack: events 1, 2, 3, 5 and 6 have zero slack; event 4 has one week of slack. Activity C can slip by one week and activity E by two weeks without delaying the seminar.
- Critical path: A → B → D → F = 2 + 4 + 3 + 2 = 11 weeks. The paths through C (A–C–dummy–D–F = 10 weeks; A–C–E–F = 9 weeks) are non-critical. The dummy matters: without it, the venue path would wrongly look less constrained.
- Probability: variance of the critical path = 0.11 + 0.44 + 0.44 + 0.11 = 1.10; σ ≈ 1.05 weeks. If the seminar must be held within 12 weeks, Z = (12 − 11) ÷ 1.05 ≈ 0.95, a probability of about 83%.
- Managerial lesson: the organisers should watch speaker confirmation (B) and printing (D) most closely; the venue team has a little room, but because C has the highest variance, its float could vanish and a new critical path could emerge.
6.5 Advantages of PERT
- Compels advance planning and fits all parts of a programme into an integrated whole, with systematic planning at all levels.
- Concentrates attention on critical and strategic elements and provides forward-looking control.
- Fosters coordination in the time, quantity and direction of work.
- Manages temporal uncertainty by expressing risk as probabilities, which suits research, defence, space and first-of-a-kind public projects.
6.6 Inherent limitations of PERT
- Estimates are guesses. For nebulous programmes, three time estimates cannot be determined with certainty; people pad or gamble their estimates, and the arithmetic gives a false air of precision.
- Statistical assumptions: the beta distribution and independence of activities are assumptions, not facts. Kelley and Walker, the creators of CPM, pointed out that using expected times biases computed event times towards the start of the project, that is, towards optimism. Later critics added the merge-event bias: where several paths meet, PERT considers only the critical path and ignores the chance that a near-critical path slips and delays the project.
- Time, not cost: classic PERT ignores cost; PERT/COST proved complicated.
- Unsuited to routine work: for repetitive, mass or process production its effort is not worthwhile.
- Complexity and cost: large networks need computers, trained staff and frequent updating; over-elaborate PERT can become a ritual.
- Political and institutional uncertainty: in government, the biggest delays (land acquisition, clearances, litigation, inter-agency disputes, budget releases) are not technical activities with stable distributions; PERT can show their effect but cannot estimate or remove them.
7. Critical Path Method (CPM)
In simple words
If you are building your fifth school, you know roughly how long each step takes. CPM uses those known times to find the chain of jobs that fixes the finish date, and then asks: if we spend a little more money on some of these jobs, how much earlier can we finish?
7.1 Origin and nature
- CPM was developed in 1956–57 by Morgan R. Walker of the chemical company E.I. du Pont de Nemours and James E. Kelley Jr. of Remington Rand (whose UNIVAC computer ran the calculations), to plan the construction, maintenance and shutdown of chemical plants. Its developers maintained that PERT and CPM arose independently, though historians still debate how separate the two efforts were.
- CPM is used for projects where activity times are known from experience: construction, plant maintenance, repetitive engineering. Its time estimates are deterministic (a single time for each activity).
- It is activity-oriented: attention is on the activities and their durations and costs, whereas classic PERT is event-oriented.
7.2 Basic technique
- List all activities (from the work breakdown structure).
- Fix the duration of each activity.
- Fix the dependencies among activities.
- Compute the longest path (critical path), the earliest and latest start and finish of each activity, and the float of non-critical activities.
- Manage by exception: concentrate attention and resources on critical activities; use float to smooth resource demands (resource levelling).
- Re-compute as the project proceeds: when tasks finish early or late, the critical path can shift.
7.3 Time–cost trade-off and crashing
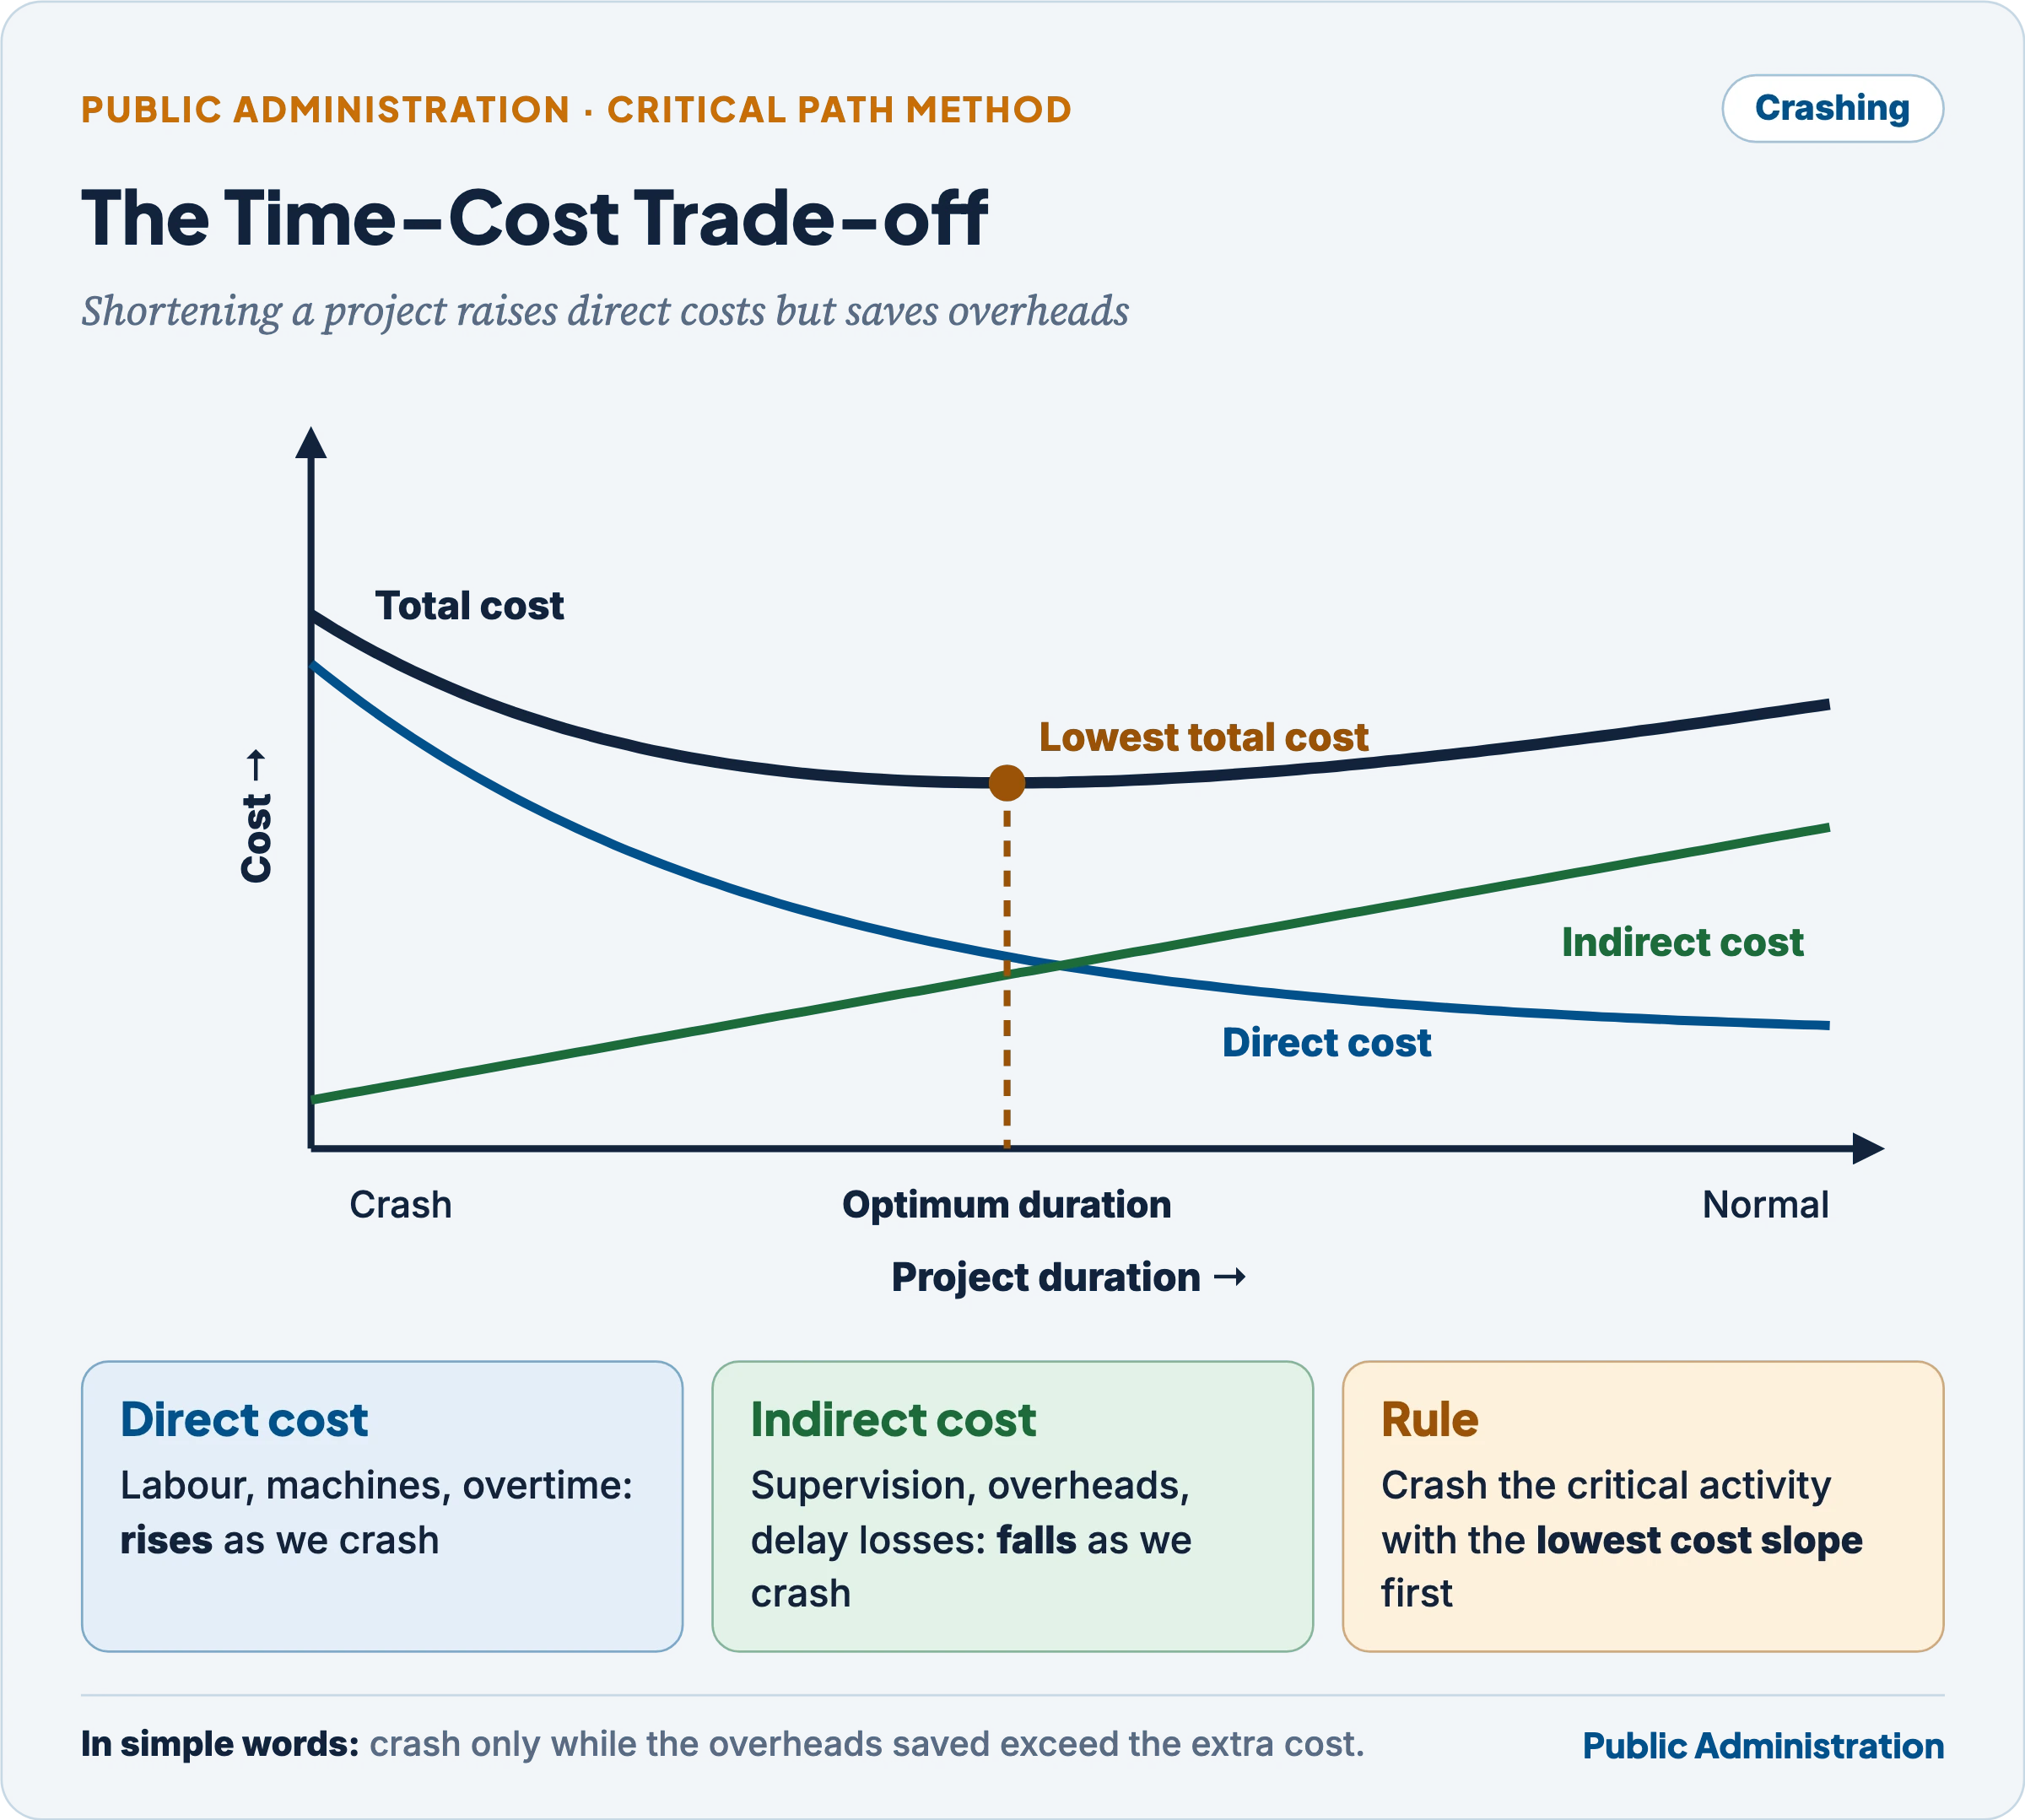
CPM’s special contribution is the time–cost trade-off: the recognition that many activities can be shortened by spending more (overtime, extra machines, more crews).
- Normal time and normal cost: the duration and cost under normal resources.
- Crash time and crash cost: the shortest possible duration and its higher cost.
- Cost slope = (crash cost − normal cost) ÷ (normal time − crash time): the extra cost of shortening an activity by one unit of time.
- Crashing means shortening critical activities, starting with the one that has the lowest cost slope, one step at a time, recomputing the critical path after each step.
- Total project cost = direct costs (labour, materials, which rise as the project is crashed) + indirect costs (supervision, overheads, penalties and lost benefits, which fall as the project is shortened). The optimum duration is where total cost is lowest.
- Fast-tracking is the complementary method: running activities in parallel that were planned in sequence, at some extra risk.
Worked example (illustrative numbers, continuing the seminar network):
| Critical activity | Normal time | Crash time | Normal cost (₹) | Crash cost (₹) | Cost slope (₹ per week) |
|---|---|---|---|---|---|
| B Invite speakers | 4 | 3 | 40,000 | 55,000 | 15,000 |
| D Printing and publicity | 3 | 2 | 30,000 | 40,000 | 10,000 |
- To finish in 10 weeks instead of 11, crash the cheapest critical activity, D, at ₹10,000. The critical path A–B–D–F becomes 10 weeks; the venue paths (A–C–dummy–D–F and A–C–E–F) now take 9 weeks each.
- To reach 9 weeks, crash B at ₹15,000. Now all three paths take 9 weeks and all are critical, so any further saving would need several activities to be shortened at once, at a much higher combined cost. This shows why crashing proceeds step by step, recomputing the critical path each time, and why shortening a project eventually becomes disproportionately expensive.
7.4 Advantages and limitations of CPM
Advantages: focus on timely completion and on ways of shortening the project; special emphasis on critical activities through extra resources or changed technology, giving optimum use of resources; advance planning and early detection of bottlenecks without needless pressure on non-critical paths; clearer responsibility; and an explicit basis for time–cost decisions, which matter greatly in public infrastructure.
Limitations:
- Single time estimates ignore uncertainty; durations may prove unrealistic.
- Limited value for routine, recurring operations.
- Assumes unlimited resources; resource constraints can shift the critical path (the critical chain method of Eliyahu Goldratt, 1997, adds buffers to deal with this).
- Large networks need constant updating, and political and legal contingencies cannot be scheduled.
7.5 PERT and CPM compared
| Basis | PERT | CPM |
|---|---|---|
| Origin | 1958, US Navy Special Projects Office with Booz, Allen and Hamilton; Polaris missile programme | 1956–57, du Pont and Remington Rand (Walker and Kelley); chemical plant construction and maintenance |
| Nature of projects | New, non-repetitive, research and development, high uncertainty | Familiar, often repetitive construction and engineering, low uncertainty |
| Time estimates | Probabilistic: three estimates (a, m, b), te = (a + 4m + b)/6 | Deterministic: one estimate per activity |
| Orientation | Event-oriented | Activity-oriented |
| Main concern | Time and the probability of meeting deadlines | Time–cost trade-off; crashing |
| Cost | Ignored in classic PERT (PERT/COST added later) | Built in: normal and crash costs |
| Output | Expected completion time, variance, probability | Critical path, floats, optimum duration and cost |
| Typical public use | Defence, space, research, first-of-a-kind programmes, election or census logistics | Roads, railways, buildings, power plants, maintenance shutdowns |
- Both share the network, the critical path, slack/float and forward and backward passes. Modern project software combines them, so the line between “PERT” and “CPM” has largely disappeared in practice.
- In office management the same logic helps: a recruitment cycle, a budget-preparation calendar, a court-case timeline or the shifting of an office can be drawn as a network, so that the sequence of dependent tasks and the critical deadlines are visible to everyone.
8. Network Techniques and Project Monitoring in India
In simple words
India spends lakhs of crores on highways, railways and power plants. Delays raise costs and postpone benefits. Project-monitoring systems apply the critical-path idea at national scale: track the milestones, spot the blockage and push the right agency to clear it.
8.1 Why project monitoring matters
- Large public projects in India have long suffered time and cost overruns. The main causes reported by ministries are land acquisition, forest and environmental clearances, right of way and utility shifting, contractual disputes, law and order and inter-agency coordination, more than engineering difficulty.
- These are precisely the “activities” that sit on the critical path but are controlled by other agencies. The Indian response has been to combine network-style milestone tracking with high-level coordination that can clear such blockages.
8.2 The main systems
| System | Year | Agency | What it does |
|---|---|---|---|
| Infrastructure and Project Monitoring Division (MoSPI) | Long-standing | Ministry of Statistics and Programme Implementation | Monitors central sector infrastructure projects of ₹150 crore and above; monthly flash reports on time and cost overruns |
| PAIMANA portal | Launched 25 September 2025 | MoSPI | Replaced the old Online Computerised Monitoring System (2006); fed by DPIIT’s Integrated Project Monitoring Portal through APIs (“one data, one entry”); as of December 2025 tracked 1,392 projects of 17 ministries with original cost of about ₹29.68 lakh crore |
| Project Monitoring Group / Integrated Project Monitoring Portal | 2013 onwards | Originally Cabinet Secretariat, now with DPIIT | Online tracking and escalation of stalled large public and private projects |
| e-Samiksha | Launched 20 August 2014 | Cabinet Secretariat (developed by NIC) | Real-time online monitoring of follow-up action on decisions taken in reviews with the Prime Minister |
| PRAGATI (Pro-Active Governance and Timely Implementation) | 2015 | PMO with Cabinet Secretariat | Monthly ICT-based, multi-modal review chaired by the Prime Minister with Union Secretaries and Chief Secretaries by video; projects, schemes and grievances |
| PM Gati Shakti National Master Plan | Launched 13 October 2021 | DPIIT, with BISAG-N as technical partner | GIS-based integrated planning platform: layers of all infrastructure and land data so that projects are planned together; a Network Planning Group appraises major projects |
| DISHA committees and dashboard | Committees 2016; dashboard October 2017 | Ministry of Rural Development | District committees chaired by MPs monitor central schemes using an MIS dashboard |
8.3 PRAGATI as applied network management
- How it works: issues on each project (land, clearance, utility shifting, finance) are uploaded in advance; the Prime Minister reviews selected projects with the Union Secretaries and Chief Secretaries together; decisions and deadlines are recorded and followed up. Only large projects (generally above ₹500 crore) come to the PRAGATI table.
- Scale (as briefed at its 50th meeting, 31 December 2025): 382 major projects reviewed directly by the Prime Minister; 2,958 of 3,187 identified issues resolved (about 94%); the wider PRAGATI ecosystem had helped accelerate projects worth over ₹85 lakh crore. Long-delayed projects cited include the Jammu–Udhampur–Srinagar–Baramulla rail link (commissioned June 2025), the Bogibeel rail-cum-road bridge (2018) and Navi Mumbai International Airport (late 2025).
- Continuing reviews: the 51st (May 2026) and 53rd (August 2026) meetings reviewed road, rail and power projects of around ₹30,000 crore each, and the Prime Minister stressed monitoring projects end to end as integrated wholes, not as separate packages: in network terms, managing the whole path rather than individual activities.
- Network-analysis lesson: most resolved issues relate to land, forest and environmental clearances and right of way. PRAGATI works because it attacks the critical-path activities that no single project manager controls, by creating a single point where all the agencies on the path meet.
8.4 PM Gati Shakti as planning before scheduling
- PERT and CPM schedule a project once it is designed; Gati Shakti tries to improve design and sequencing across projects: a road, a gas pipeline, an optical fibre line and a railway crossing the same corridor are planned together so that one does not dig up another.
- By August 2025 about 1,700 data layers had been integrated and 57 central ministries and departments and all 36 States and UTs onboarded; the Network Planning Group had evaluated 293 projects worth ₹13.59 lakh crore. In October 2025 the platform was opened to the private sector through query-based analytics and District Master Plans were launched for the 112 Aspirational Districts.
- Limits: a master plan does not settle land disputes or financing; data quality depends on line departments updating layers; and states differ in capacity to use the platform.
Indian Connect — From PERT charts to PRAGATI
- 1960s–1980s: PERT/CPM taught in training institutes and used in large engineering projects (river valley, steel, defence), but government monitoring remained largely paper-based and periodic.
- 2000s: MoSPI’s online computerised monitoring of projects above ₹150 crore; quarterly reports on time and cost overruns.
- 2014–2015: e-Samiksha and PRAGATI move monitoring to real time and to the highest political level.
- 2021–2026: Gati Shakti integrates planning; PAIMANA integrates data through APIs; reviews stress whole-project, end-to-end completion. The network logic is the same as in 1958; what has changed is data, visibility and political follow-through.
9. Management Information System (MIS)
In simple words
A Collector cannot visit every village every day. An MIS brings the villages to her desk: how many children were vaccinated, how much ration was lifted, which works are behind schedule. Good MIS gives the right information to the right person at the right time, in a form she can act on.
9.1 Meaning and definition
- A Management Information System is a planned system for collecting, processing, storing and disseminating data in the form of information needed to carry out the functions of management: planning, organising, directing, coordinating and controlling.
- Gordon B. Davis, the American pioneer of MIS as an academic field, defined it as “an integrated user-machine system for providing information to support operations, management, and decision-making functions in an organization.”
- Data and information are different. Data are raw facts (attendance registers, vouchers, enrolment entries); information is data processed into a form that is relevant, timely, accurate and usable for a decision. MIS exists to convert the first into the second.
- MIS is not only computers. It has three primary components: technology, people (individuals, groups, organisations) and data/information for decision-making, plus the procedures that bind them. Computers changed MIS from periodic, manual reports produced as a by-product of accounts into continuous, near-real-time systems.
9.2 Components and characteristics
| Component | Role |
|---|---|
| Inputs | Data from transactions, field reports, surveys, sensors, external sources |
| Processing | Validation, classification, aggregation, analysis, comparison with targets |
| Storage | Databases and records, including historical series |
| Outputs | Scheduled reports, exception reports, on-demand queries, dashboards |
| Feedback and control | Comparing actual with planned performance; triggering corrective action |
| People and procedures | Users, data-entry staff, analysts and the rules for who reports what, when |
Characteristics of a good MIS: management-oriented (designed around decisions, not data available), integrated across units, common database avoiding duplication, future-oriented as well as historical, flexible, timely, selective (avoids overload), with exception reporting that highlights significant deviations.
9.3 Levels of management and types of information systems
Robert Anthony (1965) divided managerial activity into strategic planning, management control and operational control; information systems are layered to serve these levels.
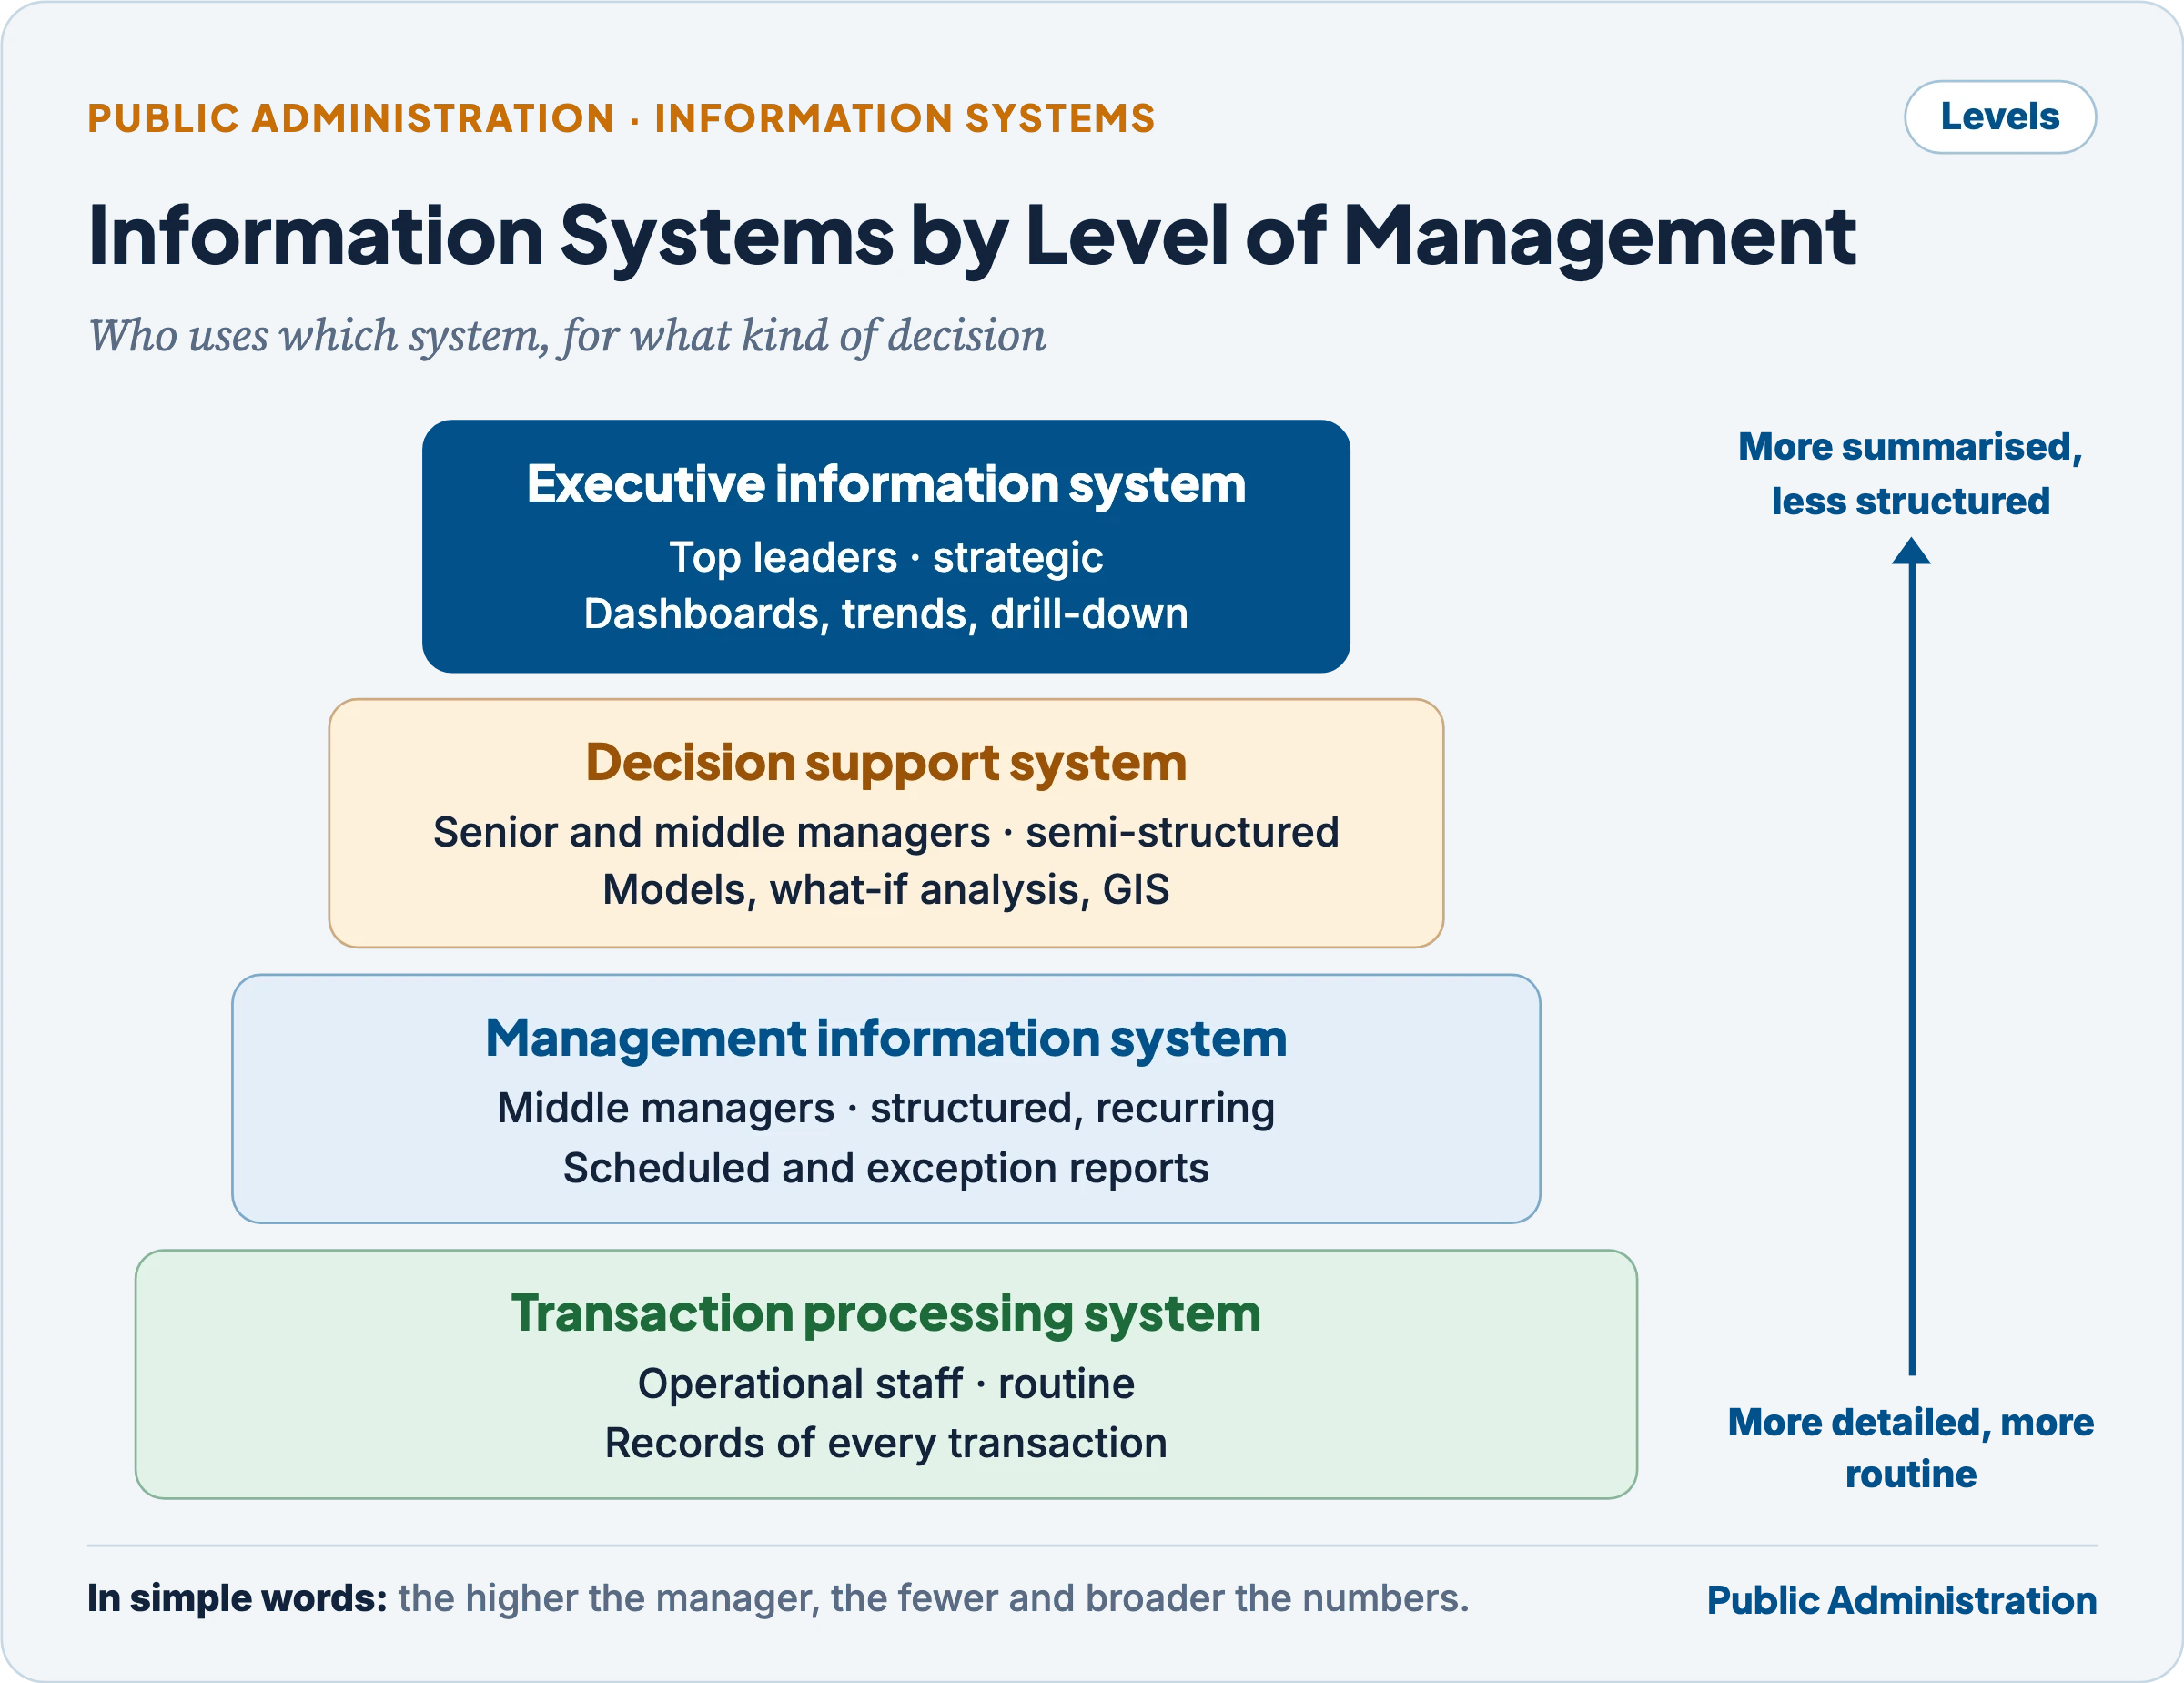
| System | Level served | Type of decision | Typical output | Government example |
|---|---|---|---|---|
| Transaction Processing System (TPS) | Operational staff | Structured, routine | Records of each transaction | Ration-shop sales, land-record mutations, birth registrations |
| Management Information System (MIS) in the narrow sense | Middle managers | Structured, recurring | Scheduled, summarised and exception reports | Monthly scheme progress reports by district |
| Decision Support System (DSS) | Middle and senior managers | Semi-structured, one-off | Models, what-if analysis, interactive queries | Choosing sites for new schools using GIS and population data |
| Executive Information System (EIS) / dashboards | Top executives | Unstructured, strategic | Highly summarised indicators, drill-down, trends | PRAGATI and ministry dashboards for Secretaries and Ministers |
| Office Automation System (OAS) | All levels | Communication and workflow | e-mail, documents, workflow | e-Office |
| Expert systems and AI | Specialised tasks | Rule-based or learned | Recommendations, classification | Grievance categorisation using language processing |
- MIS vs DSS vs EIS. MIS reports on what happened against plan; DSS helps analyse choices that are not routine; EIS summarises the whole organisation for leaders. Information becomes more aggregated, more external and less structured as one moves up.
- Enterprise systems (ERP, supply-chain management, customer relationship management, knowledge management systems) integrate these layers across functions on a common database.
9.4 Evolution of MIS
- Kenneth and Jane Laudon describe five eras that follow computing technology: mainframe and minicomputer, personal computer, client/server networks, enterprise computing and cloud computing.
- Today’s systems have moved far beyond those traditional advantages:
- Real time and mobile: managers access data from anywhere on phones and tablets.
- Integration across departments and levels (ERP; API-linked portals such as PAIMANA).
- Geospatial and analytical capacity (GIS, predictive analytics, AI-based classification).
- Two-way and citizen-facing: dashboards open to legislators and the public; data captured directly from citizens’ transactions.
- From hindsight to foresight: not only “what happened” but “why”, “where” and “what will happen”.
9.5 Developing an MIS
- An MIS passes through the system development life cycle (feasibility, analysis, design, programming, testing, conversion, maintenance) and is introduced by direct cut-over, parallel running, a pilot or in phases.
- Its prerequisites are a clear statement of managers’ information needs, top-management support, user participation, data standards and trained staff.
9.6 MIS as management and organisation theory, not only computer science
The field of MIS grew out of the theory of organisation and decision-making as much as out of computing.
- Herbert Simon made decision-making the heart of administration; information is valuable only so far as it improves decisions. He also warned that a wealth of information creates a poverty of attention: the scarce resource is managerial attention, not data.
- Chester Barnard treated communication as the first function of the executive; MIS is a formal communication system.
- Systems theory and cybernetics supplied the concepts of feedback and control on which MIS is built.
- Russell Ackoff, in “Management Misinformation Systems” (1967), argued that most MIS failed because designers wrongly assumed that managers suffer from lack of relevant information (in fact they suffer from too much irrelevant information), that managers know what information they need, that giving them information improves decisions automatically, that more communication improves performance, and that managers need not understand how the system works.
- Implication: an MIS is designed by asking what decisions are taken, by whom, with what information; the technology comes after. This is why MIS sits in management and organisation theory, not merely in computer science.
9.7 How a narrow view of information defeats MIS
- Information equated with numbers: qualitative, informal and contextual knowledge (a field officer’s judgement, citizens’ complaints, local politics) is ignored.
- Information equated with IT: buying hardware and software is mistaken for building an information system; processes and decision needs are not redesigned.
- Upward-only flow: data flow from field to headquarters for control, but nothing useful flows back down; field staff then treat data entry as a burden and quality falls.
- Volume over relevance: reports multiply; managers drown in data and still lack decision-relevant information (Ackoff’s point).
- Information as power: units hoard information or report selectively; departmental MIS remain silos that do not talk to each other.
- Ignoring behaviour: targets reported through MIS invite gaming and data manipulation; without verification, MIS can mislead more than it informs.
9.8 MIS, value and productivity; MIS and headquarters–field relations
- Value and productivity: MIS raises productivity by cutting search and reporting time, enabling management by exception, matching resources to need, detecting leakage and duplication (de-duplication of beneficiaries), and enabling evidence-based allocation. It raises public value when information also reaches citizens and legislators, improving transparency and accountability.
- Headquarters and field: the central tension in field administration is between control from headquarters and discretion in the field. An effective MIS eases it:
- Headquarters can monitor results instead of approving every action, so it can delegate more.
- The field gets comparative data (how it stands against other districts) and quicker decisions.
- Both share one version of the facts, reducing disputes and repetitive correspondence.
- The danger is the reverse: real-time dashboards can tempt headquarters into micro-management, undermining field autonomy.
- Generalists, specialists and MIS: generalist administrators decide; specialists (statisticians, engineers, IT professionals, domain experts) design and interpret data. MIS is the bridge: without specialists the generalist is data-poor; without the generalist’s grasp of decisions and context, the specialist builds systems that nobody uses. An intimate working relationship among the three is a precondition of a useful MIS.
9.9 MIS in Indian government
- Scheme MIS: almost every major central scheme runs an online MIS for sanction, fund flow, progress and payments (for example the MGNREGA management system and the Public Financial Management System for fund tracking); Ayushman Bharat PM-JAY uses an IT platform for beneficiary identification, pre-authorisation and claims, which also generates data for fraud detection.
- DISHA dashboard: launched in October 2017 for the District Development Coordination and Monitoring Committees (constituted in 2016 and chaired by MPs). By February 2026 committees covered 776 districts and the dashboard integrated 101 schemes of 35 ministries and departments, with data down to block, gram panchayat and village where available. The Ministry of Rural Development told Parliament that it does not generate alerts or exception reports, a revealing gap measured against classic MIS principles.
- e-Samiksha and PRAGATI for follow-up of decisions and projects; e-Office analytics for file movement; the Aspirational Districts Programme (2018) dashboard that ranks districts monthly on change in indicators; MoSPI’s PAIMANA for infrastructure.
- Problems: many separate, non-interoperable portals; heavy data-entry burden on frontline staff; uneven data quality and verification; little analysis beyond counting; privacy obligations under the Digital Personal Data Protection Act, 2023.
- The use of these systems for citizen services, transparency and digital public infrastructure is treated in the article on e-governance and information technology.
10. Other Management Aids: Quality, Comparison and Re-engineering
In simple words
Some tools ask “are we doing things right, every time?” (quality). Some ask “how do we compare with the best?” (benchmarking). Some ask “should we be doing it this way at all?” (re-engineering). Each answers a different problem, so the right tool depends on the problem.
10.1 A toolbox at a glance
| Tool | Origin | Core idea | Public sector use and caution |
|---|---|---|---|
| Gantt chart | Henry L. Gantt, 1910s | Bar chart of tasks against time | Simple scheduling; does not show dependencies |
| Total Quality Management (TQM) | W. Edwards Deming and Joseph Juran; post-war Japan, spread to the West in the 1980s | Quality built into every process; customer focus; continuous improvement; everyone responsible; decisions based on data | Service standards, citizen focus, ISO 9001 certification of offices; risk of certification without culture change |
| Six Sigma | Motorola, 1986 | Reduce process variation until defects fall to about 3.4 per million opportunities; DMAIC cycle (define, measure, analyse, improve, control) | High-volume transactions (passports, tax returns, payments); hard to define “defects” in policy work |
| Kaizen | Japanese practice, popularised by Masaaki Imai‘s Kaizen (1986) | Small, continuous, worker-led improvements | Hospitals and offices (5S workplace organisation); needs empowered staff |
| Benchmarking | Xerox from 1979; Robert Camp‘s Benchmarking (1989) | Compare one’s performance and practices with the best and learn from them | Indices and rankings of states and districts; must compare like with like |
| Business Process Re-engineering (BPR) | Michael Hammer (“Reengineering Work: Don’t Automate, Obliterate”, 1990); Hammer and James Champy, Reengineering the Corporation (1993) | Fundamental rethinking and radical redesign of processes for dramatic gains in cost, quality, service and speed | Government Process Re-engineering before digitisation; risk of job fears and failure if imposed |
10.2 Total Quality Management and Sevottam
- TQM principles: citizen focus, continuous improvement, total participation, process orientation, decisions based on data and prevention rather than inspection; Deming’s Plan–Do–Check–Act cycle is its basic method.
- Sevottam (“excellence in service”) is India’s quality-management model for public services, based on the Bureau of Indian Standards’ IS 15700:2005. Its three components are a Citizen’s Charter with service standards, a public grievance redress mechanism and service delivery capability. The Second ARC (2009) recommended it for all public-facing organisations.
- Why its promise was only partly realised: charters were drafted in compliance mode with vague standards and little consultation; few organisations sought certification; there was no statutory backing or penalty; standards were declared without the staff, budget or process redesign to meet them; and citizen awareness and monitoring were weak. Its ideas survive in grievance-redress reforms and State time-bound service laws (see the article on Citizen’s Charters, RTI and social audit).
10.3 Benchmarking and comparative performance measurement
- Benchmarking compares an organisation’s performance (metrics benchmarking) or practices (best-practice benchmarking) with others or with its own past, in order to learn and improve, not merely to rank.
- Comparative performance measurement in public administration grew in the 1990s, when groups of US cities and counties, with the International City/County Management Association, built common measures for police, fire and other services so that each could compare itself with peers.
- How it bridges everyday work and comparison: an official’s routine numbers (response times, cost per case, complaint rates) take on meaning only when placed beside those of comparable units. Comparison turns daily work data into diagnosis (where we lag), learning (who does better and how) and accountability (published rankings). It brings the broad comparative method of Comparative Public Administration down to the level of the individual office.
- Indian examples: DARPG’s Good Governance Index (first edition 2019), the National e-Governance Service Delivery Assessment, the Aspirational Districts delta rankings (monthly since 2018) and NITI Aayog’s sectoral indices (health, school education, SDGs).
- Cautions: units differ in context (terrain, poverty, staff), so crude rankings can be unfair; indicators can be gamed; comparison without support for improvement breeds defensiveness.
10.4 Business and Government Process Re-engineering
- Hammer and Champy defined re-engineering as “the fundamental rethinking and radical redesign of business processes to achieve dramatic improvements in critical, contemporary measures of performance, such as cost, quality, service, and speed.” Hammer’s warning was against “paving the cow paths”: automating a bad process merely speeds up the bad process.
- Government Process Re-engineering (GPR) applies this to public services, usually alongside digitisation: remove unnecessary steps, approvals and documents; merge counters; redesign around the citizen’s journey rather than departmental boundaries.
- How GPR promotes good governance:
- Efficiency and speed: fewer steps and hand-offs (Passport Seva’s redesigned process; faceless income-tax assessment that removed territorial, face-to-face scrutiny).
- Transparency and less corruption: fewer discretionary touch-points between citizen and official.
- Citizen convenience: self-certification instead of gazetted attestation; single-window systems; online, time-bound services.
- Accountability: digital trails show where a case waits.
- Process re-engineering and grievances: much of the grievance load arises from badly designed processes (unclear eligibility, repeated document demands, delays at a single desk). Grievance redressal treats the symptom case by case; analysing grievance data to find systemic causes and then redesigning the process prevents whole classes of grievances. Commitment is still needed: without officers who own and act on grievances, even a redesigned process fails at the margins.
- Limits of BPR/GPR: radical redesign meets resistance from staff and vested interests; legal rules may fix procedures; failures are common when re-engineering is imposed without consultation; and digital redesign can exclude citizens without access or digital skills.
Common confusion
Is BPR simply a computerised version of O&M? No. O&M improves an existing procedure step by step within the existing structure. BPR begins with a blank sheet and asks whether the process, and sometimes the unit, should exist at all; it seeks dramatic rather than incremental gains, usually with IT as the enabler. Computerising an unreformed procedure is neither: it is what Hammer called “paving the cow paths”. In practice good re-engineering still relies on O&M’s careful mapping of the present process before it is redesigned.
10.5 Matching the tool to the problem
The efficacy of a management aid depends on its purpose and appropriateness: a tool suited to one problem is useless or harmful for another.
| Problem | Appropriate tool | Inappropriate use |
|---|---|---|
| Files take too long; too many levels | O&M, delayering, e-Office analytics | PERT (no project) |
| Unclear how many staff a section needs | Work measurement, activity sampling | Benchmarking alone without studying work content |
| One-time project with uncertain tasks | PERT | Single-estimate CPM that hides risk |
| Repetitive construction with known durations; deadline pressure | CPM with crashing | PERT’s three estimates (unnecessary effort) |
| Managers lack timely decision information | MIS, dashboards, exception reports | More reports without defined decision needs |
| Service quality varies; repeated errors | TQM, Six Sigma, Kaizen | Re-engineering the whole organisation |
| Process fundamentally obsolete | BPR / GPR | Incremental O&M tidying |
| Performance unclear relative to peers | Benchmarking, comparative measurement | Rankings without support for learning |
| Results and accountability of officers | MBO, performance management | Mechanical targets for judgement-based work |
10.6 Have MIS, PERT and CPM reinvented O&M?
- Yes, in scope and speed: O&M once studied a procedure every few years by inspection; MIS and e-Office analytics now measure levels, delays and pendency continuously, network techniques extend O&M’s logic from routine work to projects, and dashboards turn inspection into real-time monitoring.
- Yes, in philosophy: the “reinventing government” movement (David Osborne and Ted Gaebler, Reinventing Government, 1992) shifted attention from rules and inputs to results and customers, and these tools supplied the measurement.
- But not entirely: O&M’s old questions (who does what, in how many steps, at what cost) remain the foundation, as CSMOP 2022 and the Special Campaigns show; without them technology automates confusion.
11. Limits of Management Techniques in Public Administration
In simple words
A thermometer tells you the temperature but does not cure the fever. Management techniques measure, schedule and report, but whether government actually improves depends on politics, law, people and purpose.
- Publicness: government pursues multiple, conflicting and often vague goals; techniques built for single-goal firms struggle with them, and what can be counted crowds out what matters (goal displacement).
- Law and politics: due process and audit deliberately slow some decisions; priorities change with governments; the biggest delays (land, clearances, litigation) lie outside managerial control.
- Human factors: techniques descended from Taylor can treat staff as machines; resistance, low morale and gaming defeat them.
- Technique fetishism and capacity: charts and dashboards can become rituals that replace decisions, and skilled analysts and reliable data are scarce in many field offices.
- Context: tools transplanted from industry or other countries can produce formalism in Riggs’s sense: systems that exist on paper but not in practice.
Criticism — The case against relying on management techniques
- Mechanical and simplistic: PERT, CPM and work study assume tasks can be listed, timed and sequenced; real governance is political, uncertain and value-laden.
- Efficiency is not the only value: the New Public Administration and New Public Service traditions stress equity, participation and citizenship, which techniques do not measure.
- Gaming and goal displacement: MBO targets, MIS indicators and rankings invite manipulation and neglect of unmeasured duties.
- Control over trust: real-time dashboards can centralise power and erode field discretion and professional judgement.
- Fashions come and go: O&M, PERT, MBO, TQM and BPR each rose and fell; Ackoff, Deming and Hammer themselves criticised the way their ideas were misapplied.
Defence — The case for management techniques
- Discipline of thought: techniques force administrators to state objectives, list tasks, find dependencies and measure work, which improves decisions even when numbers are imperfect.
- Evidence over hunch: standard times, critical paths and MIS replace arbitrary judgement and protect both citizens and staff from caprice.
- Visible results in India: delayering from about seven to under five levels, near-universal e-receipts, PRAGATI’s resolution of most identified project bottlenecks and the Special Campaigns’ freed space and cleared pendency show what sustained application can do.
- Accountability: published indicators and dashboards let legislators, auditors and citizens see performance.
- Synthesis: used appropriately and with judgement, matched to the problem, combined with consultation, political backing and attention to equity, techniques are necessary but not sufficient for administrative improvement.
Techniques do not reform administration by themselves; they make visible what needs reforming and measure whether it has been reformed.
The oldest question of O&M, why a file waits, is now answered every day by software, but someone still has to act on the answer.
Key Terms
| Term | Meaning in simple words |
|---|---|
| Administrative reform | Induced change in the machinery of government against resistance (Caiden) |
| O&M | Systematic study of office organisation and procedure to improve efficiency; an advisory staff function |
| Process chart | Record of each step of a procedure using five symbols: operation, inspection, transport, delay, storage |
| Forms control | Eliminating, merging and redesigning forms so that only needed data are collected |
| CSMOP | Central Secretariat Manual of Office Procedure; 16th edition, 2022 |
| Delayering | Reducing the levels through which a file must pass |
| Work study | Method study plus work measurement |
| Method study | Recording and critically examining ways of doing work (SREDIM) |
| Work measurement | Establishing the time a qualified worker needs for a job at a defined pace |
| Standard time | Rated (basic) time plus allowances for rest and contingencies |
| PMTS / work sampling | Times built from standard motions / random snap observations of how time is spent |
| Staff Inspection Unit | Department of Expenditure unit (1964) fixing staffing norms by work measurement |
| MBO | Jointly set objectives, self-control and appraisal by results (Drucker, 1954) |
| Gantt chart | Bar chart of tasks against time, without dependencies |
| Activity / event / dummy | Time-consuming task / instant marking start or finish / zero-time arrow showing only dependency |
| Critical path | Longest path through a network; fixes the minimum project duration; zero float |
| Slack / float | Time an event or activity can slip without delaying the project |
| PERT | Probabilistic network technique; te = (a + 4m + b)/6 |
| CPM | Deterministic network technique with time–cost trade-off |
| Crashing | Shortening critical activities by adding resources, cheapest first |
| MIS | System turning data into timely information for managerial decisions |
| DSS / EIS | Support for semi-structured choices / summarised information for top executives |
| Exception reporting | Reporting only significant deviations so that managers focus attention |
| TQM / Six Sigma / Kaizen | Organisation-wide quality / variation reduction (DMAIC) / small continuous improvement |
| Benchmarking | Comparing performance and practices with the best in order to improve |
| BPR / GPR | Radical redesign of business or government processes, usually with IT |
| Sevottam | India’s service-quality model (IS 15700:2005) |
Commissions, Committees and Reports
| Body / report | Year | Key point |
|---|---|---|
| Treasury O&M Division (UK) | 1941 | Central O&M service; departmental O&M sections |
| N. Gopalaswami Ayyangar Report | 1949 | Reorganisation of the machinery of government; a dedicated O&M unit |
| Paul H. Appleby, Public Administration in India | 1953 | Central office for organisation and procedures; O&M Division (1954) and IIPA |
| Staff Inspection Unit | 1964 | Work-measured staffing norms, Ministry of Finance |
| DARPG | 1985 | Nodal department for O&M, reforms and grievances |
| Second ARC, 11th and 12th Reports | 2008, 2009 | Re-engineer before computerising; Sevottam |
| CSMOP, 16th edition | 2022 | Delayering, delegation, Desk Officer system, e-Office 7.0 |
Contemporary Developments
- 5 August 2022: DARPG released the 16th edition of the CSMOP, codifying delayering, delegation, the Desk Officer system, digitised Central Registration Units and e-Office 7.0.
- 25 September 2025: MoSPI launched the PAIMANA portal for monitoring central infrastructure projects of ₹150 crore and above, linked by APIs to DPIIT’s project portal; by December 2025 it tracked 1,392 projects of 17 ministries.
- 13 October 2025: on the fourth anniversary of PM Gati Shakti, the platform was opened to the private sector through query-based analytics, and District Master Plans were launched for the 112 Aspirational Districts.
- October 2025: Special Campaign 5.0 freed about 203 lakh sq ft of office space, earned about ₹552 crore from scrap and e-waste, and simplified 470 rules and processes.
- 31 December 2025: the 50th PRAGATI meeting; the Cabinet Secretary reported 382 projects reviewed by the Prime Minister and 2,958 of 3,187 issues resolved.
- February 2026: the Ministry of Rural Development told Parliament that the DISHA dashboard integrates 101 schemes of 35 ministries across 776 districts.
- March 2026: DARPG’s Secretariat Reforms report showed average distinct file levels down from 7.19 (2021) to 4.54, with 95.53% e-receipts.
- 2–31 October 2026: Special Campaign 6.0, focused on e-waste collection, segregation and disposal, with a third-party evaluation phase in November.
Revision Grid
| Thinker / body | Work or report (year) | Key idea |
|---|---|---|
| Frederick W. Taylor | The Principles of Scientific Management (1911) | Time study; standards instead of rule of thumb |
| Frank and Lillian Gilbreth | Motion study (1910s) | Therbligs; eliminate wasted motion |
| Henry L. Gantt | Gantt chart (1910s) | Tasks against time |
| ILO | Introduction to Work Study (1957) | Method study plus work measurement |
| Peter Drucker | The Practice of Management (1954); Management Challenges for the 21st Century (1999) | MBO and self-control; principles say what not to do |
| Kelley and Walker | CPM (1956–57) | Critical path; time–cost trade-off |
| US Navy SPO, Booz, Allen and Hamilton | PERT (1958) | Three time estimates; probability |
| Robert Anthony | Planning and Control Systems (1965) | Three levels of managerial activity |
| Russell Ackoff | “Management Misinformation Systems” (1967) | Too much irrelevant information |
| Gerald Caiden | Administrative Reform (1969) | Inducement of transformation against resistance |
| Gordon B. Davis | MIS (1974) | Integrated user-machine system for decisions |
| Knoke and Kuklinski | Network Analysis (1982) | Form and content of relations |
| W. Edwards Deming | Out of the Crisis (1982) | TQM; PDCA; eliminate management by objective |
| Masaaki Imai; Motorola | Kaizen (1986); Six Sigma (1986) | Continuous improvement; variation reduction |
| Hammer and Champy | Reengineering the Corporation (1993) | Radical process redesign |
| Eliyahu Goldratt | Critical Chain (1997) | Resource-constrained scheduling with buffers |
| DARPG | CSMOP 2022; Special Campaigns (2021–26) | Modern O&M |
Previous Year Questions
- 2026Work study and Work measurement are techniques for improving administrative efficiency. Comment.
- 2026PERT provides a sophisticated framework for managing temporal uncertainties in large-scale projects. Evaluate the strategic utility and inherent limitations of this technique in complex environments.
- 2025The efficacy of management aid tools depends on the purpose and appropriateness of tools and techniques. Explain with examples.
- 2024Critical Path Method (CPM) is a project management technique used to plan and manage project effectively. Discuss.
- 2023The ultimate goal of using Management Information System (MIS) is to increase values and Productivity in organizations. Explain.
- 2021MIS has evolved and gone far beyond its traditional advantages due to technological advancements. Comment.
- 2020Administrative reform is “an artificial inducement of administrative transformation against resistance.” (Gerald Caiden). Identify the nature of resistance and inducements required to overcome it.
- 2019A narrow view of information comes in the way of successful implementation of MIS in organizations. Analyse.
- 2019In the era of increasing stress on productivity, work study provides the road ahead for the administrators. Identify the positive attributes of work study in the light of the statement.
- 2018“An effective Management Information System (MIS) is the key to successful headquarter-field relationships.” Comment.
- 2016“The term ‘work study’ may be used in narrower and wider senses.” Elucidate.
- 2015“Comparative Performance Measurement (CPM) bridges everyday work experience with the broader horizons of comparativism.” Explain.
- 2015“MIS, PERT and CPM have accelerated the process of reinventing O & M.” In the context of the above statement, explain the recent developments in managerial techniques.
- 2014Is Peter Drucker justified in saying, “Management principles should not tell us what to do, but only tell us what not to do”? Comment.
- 2014“The field of MIS is not necessarily an extension of computer science, but of management and organisation theory.” Elucidate.
- 2012‘Relations are the building blocks of network analysis’ – In the light of this statement summarize the form and content of relations in ‘network analysis’.
- 2012Trace the background and development of PERT and enumerate the steps involved in the application of PERT.
- 2012Draw a simple PERT chart for a seminar planning project.
- 2009“Techniques like PERT and CPM help in effective office management.” Elaborate.
- 2007Bring out the various techniques of O&M adopt in India to improve efficiency in administration.
- 2003Examine the needs and facets of administrative reforms in the fast changing scenario of the 21 st century. What are the obstacles to administrative reforms? Give suggestions to overcome them.
- 2000Write short note on Work study and work-measurement in Indian Administration.
- 1998“Work study succeeds because it is systematic in investigating a problem and also in developing a solution for it.” Explain. Also discuss the components of Work Study and their usefulness.
- 1997Bring out the importance of Organization and Methods (O&M). Do you think that there should be a separate O & M organization?
- 1997“Administrative reforms are induced changes in the machinery of government undertaken in order to bridge the gap between reality and desirability.” Comment.
- 1996“Whatever is purpose it is true that reform always takes place against ‘resistance’ and that failure to recognise the various sources of opposition, and to plan and to neutralise them, is a major reason for the widespread failure of reform efforts.” Examine.
- 1994“The entire process of development and nation building hinges on the effectiveness of administrative reforms.” Comment.
- 1993“Administrative reforms represent efforts, intended to enhance and/or expand the administrative and managerial capacity of Public administration to achieve national objectives or goals.” Elucidate.
- 1992‘Administrative reform, by its very definition, seeks to apply new ideas to administration and thus entails new values. Comment.
- 1991‘There are widely different views not only about the context of O and M, but also concerning its relationship with other techniques concerned with improving effectiveness and efficiency. Discuss.
- 1990Work study comprises all ‘systematic activities concerned with the investigation, recording, measurement and improvement of work.’ Comment.
- 1988There is a need for intimate relation between Generalists, Specialists and the Management Information System (MIS). Comment.
- 2025Assess the role of Government Process Reengineering (GPR) in promoting good governance.
- 2019‘Sevottam Scheme’ had great potential to reform service delivery, but opportunity is frittered away. Comment.
- 2018“Effective public grievance redressal requires administrative commitment. But process reengineering can help prevent some grievances.” Discuss.
- 2017“Pro-Active Governance and Timely implementation (PRAGATI) is an innovative project of the Union Government.” Discuss its features and modalities.