

Anthropology Optional › Paper II › Unit 02: Demographic Profile of India
2 Demographic profile of India: Ethnic and linguistic elements in the Indian population and their distribution. Indian population – factors influencing its structure and growth
Official Syllabus: Paper II, Unit 2
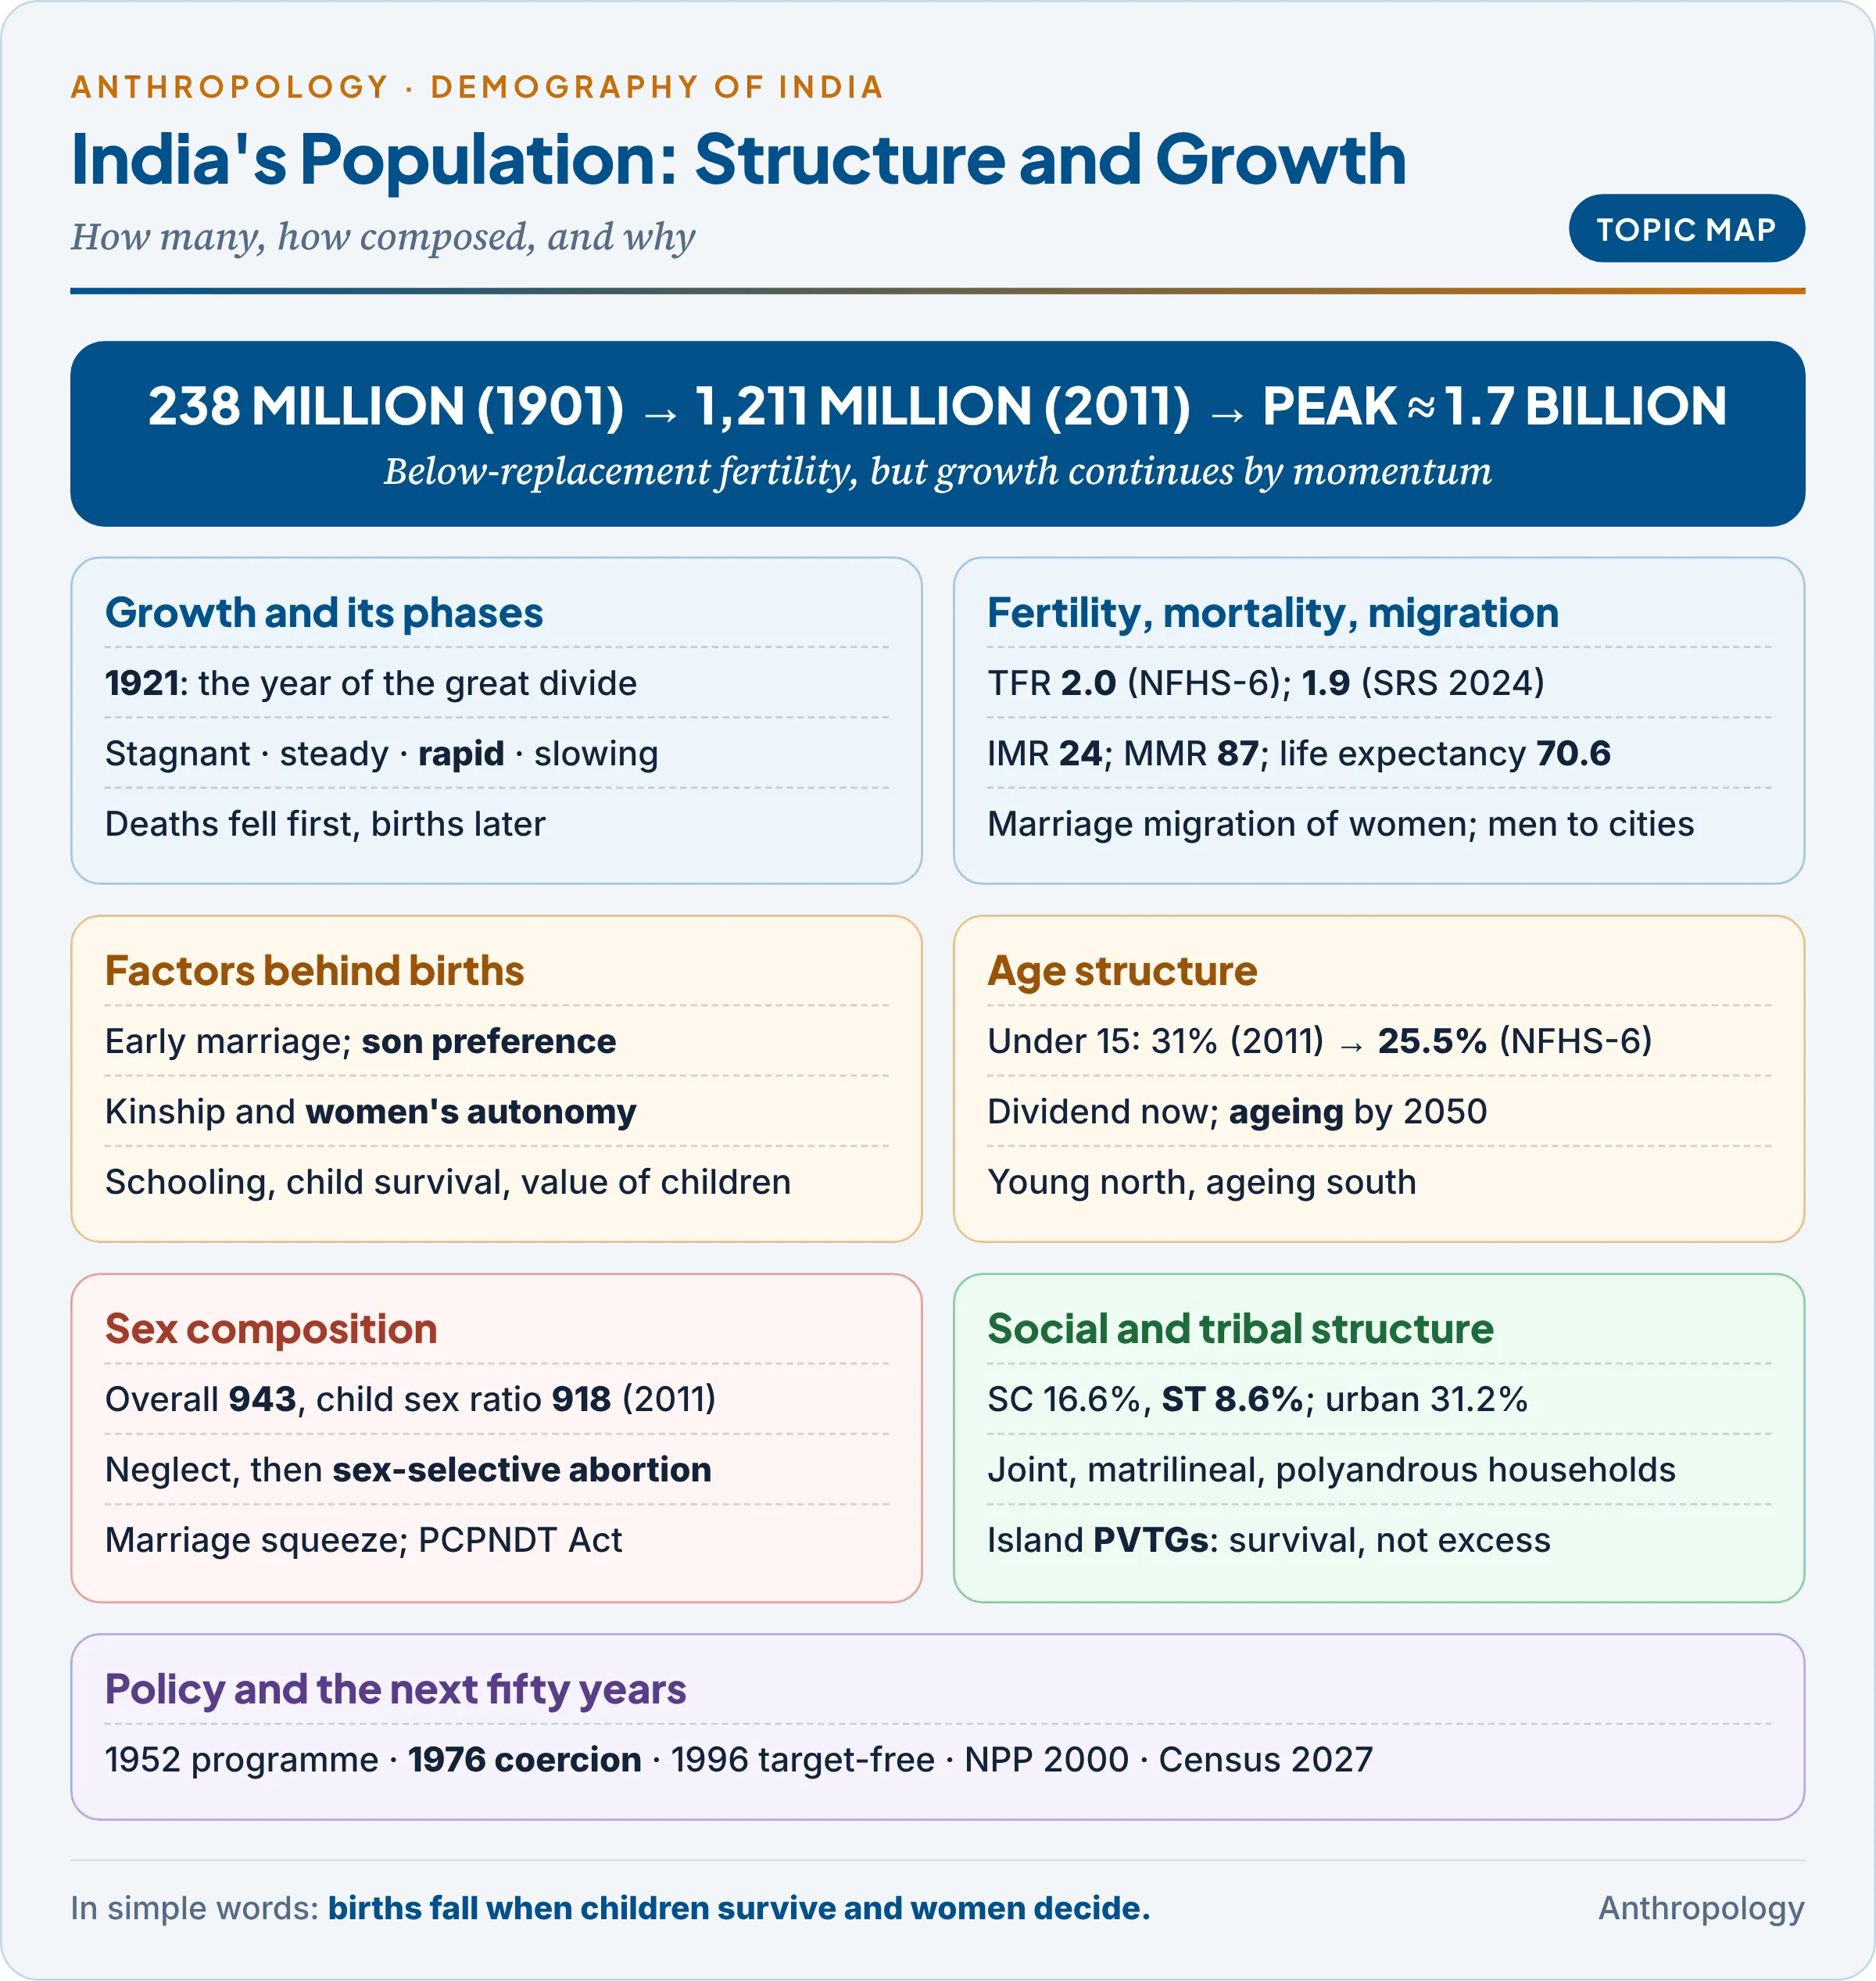
This article covers the second half of the syllabus line: how India’s population grew, how it is composed, and why. The ethnic and linguistic elements are treated in 2a. The general tools of demography are in Paper 1: measures of fertility and mortality with worked examples in Unit 11a, and the demographic theories (Malthus, the demographic transition, Caldwell, Coale) in Unit 11b. Here they are applied to India.
1. Studying India’s Population: Concepts and Sources
In simple words
A population changes in size through births, deaths and people moving in or out. Its structure is the way it is made up: how many children and old people, how many women for every man, how many live in towns, and which social groups they belong to. India counts all this through a census every ten years and through large surveys in between.
1.1 Structure and growth
- Population growth has only three components, summed up in the balancing equation: population at the end = population at the start + births − deaths ± net migration.
- Natural growth (births minus deaths) drives almost all of India’s growth. In 2024 the crude birth rate (births per 1,000 people, CBR) was 18.3 and the crude death rate (CDR) 6.4, so India still added about 12 people per 1,000 (SRS 2024).
- Population structure (composition) is the make-up of the population by age, sex, residence, marital status, literacy, occupation and social group (caste, tribe, religion, language).
- Structure and growth shape each other: a young population keeps growing after couples have fewer children (population momentum), and falling births make a population older.
1.2 Sources of Indian population data
Each source answers a different question, so the right figure comes from the right source.
| Source | Since | What it gives |
|---|---|---|
| Census of India | 1872 (first); 1881 first synchronous; 2011 the 15th; next Census 2027 | Complete count: age, sex, literacy, residence, SC/ST, religion, language, migration, households |
| Sample Registration System (SRS) | Pilot 1964–65; full scale 1969–70 | Annual CBR, CDR, TFR, IMR, MMR, sex ratio at birth, life tables |
| National Family Health Survey (NFHS) | 1992–93; NFHS-6 (2023–24) released May 2026 | Fertility, contraception, marriage, nutrition by caste, tribe, religion, wealth and district |
| Civil Registration System | Registration of Births and Deaths Act, 1969 (amended 2023) | Registered births and deaths |
The census is the only complete count, so it alone gives figures for small groups such as a single tribe; the SRS and NFHS give the newest rates. That is why community figures below come from Census 2011 and current rates from the SRS and NFHS.
1.3 Why anthropologists study population
- Numbers have meanings: a birth rate sums decisions about marriage, sons, land and labour, which fieldwork explains and surveys cannot (§3.1).
- Small populations escape national samples. The genealogical method, devised by the British anthropologist W.H.R. Rivers on the 1898 Torres Strait expedition and used among the Toda of the Nilgiris, reconstructs their births, marriages and deaths.
2. Growth of India’s Population: Phases and the Transition
In simple words
For the first twenty years of the twentieth century India’s population hardly grew, because famine and epidemics killed almost as many people as were born. After 1921 deaths fell while births stayed high, so the population grew faster and faster until about 1981. Since then births have also fallen, and growth is slowing.
2.1 The year of the great divide
Example first. The 1921 Census counted fewer people than 1911. The cause was the 1918–19 influenza pandemic, which reached Bombay in September 1918 and killed somewhere between about 11 and 20 million people in India within months, on top of plague, malaria and famine. The population never fell again, so demographers call 1921 the “year of the great divide”: before it, high deaths cancelled high births; after it, deaths fell steadily while births did not.
2.2 The four phases
The census figures show four phases. Read the last two columns together: growth climbs until 1961–81 and slows after it.
| Census | Population (million) | Decadal growth (%) | Phase |
|---|---|---|---|
| 1901 | 238.4 | — | Stagnant (1901–21) |
| 1921 | 251.3 | −0.31 (1911–21) | |
| 1951 | 361.1 | +13.31 | Steady growth (1921–51) |
| 1971 | 548.2 | +24.80 | Rapid high growth (1951–81) |
| 1981 | 683.3 | +24.66 | |
| 2001 | 1,028.7 | +21.54 | High growth, slowing (1981–2011) |
| 2011 | 1,210.9 | +17.70 |
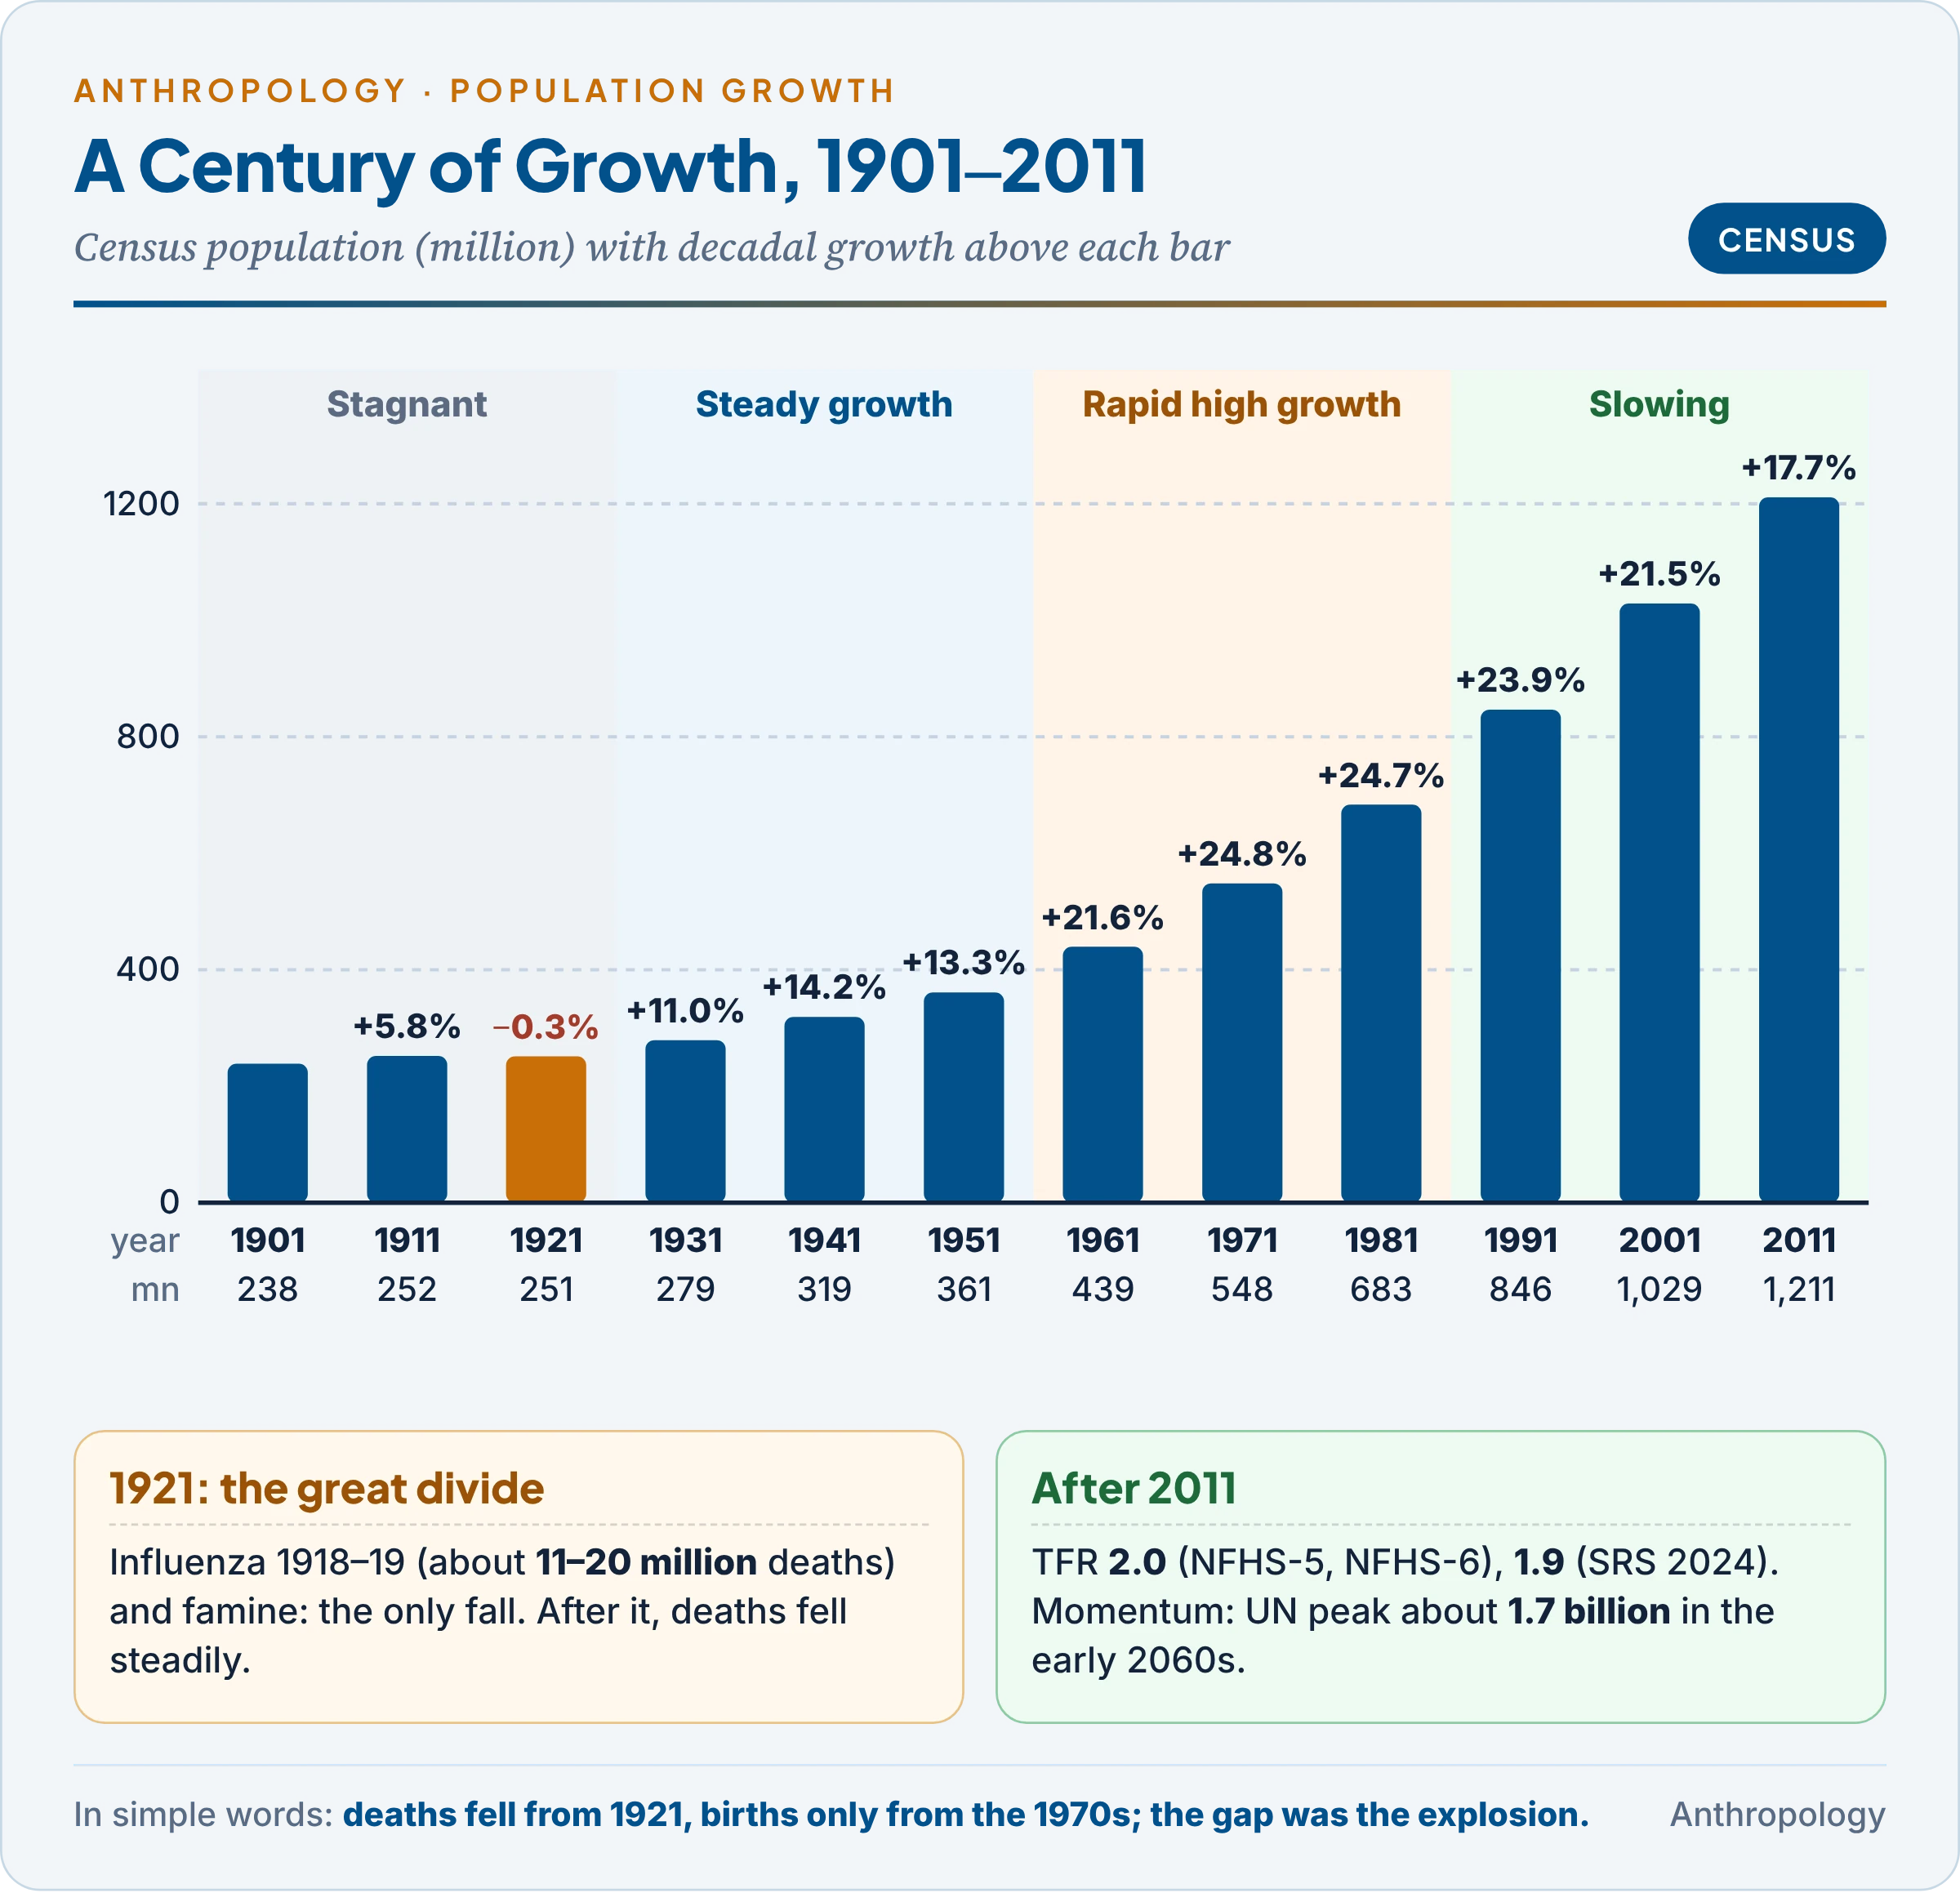
- 1901–21, stagnant: births and deaths both above about 40 per 1,000; famine, plague, cholera, malaria and influenza kept growth near zero.
- 1921–51, steady growth: better famine relief and epidemic control lowered deaths; births stayed high.
- 1951–81, rapid high growth (the “population explosion”): malaria control, vaccines, antibiotics and primary health centres cut deaths sharply while births fell slowly; growth reached about 2.2% a year in the 1960s.
- 1981–2011, high but slowing: births fell, first in the south; 2001–11 added 182 million people at the lowest decadal rate since independence.
- After 2011, sub-replacement fertility: the total fertility rate (TFR, the average number of children a woman would have at current rates) was 2.0 in both NFHS-5 (2019–21) and NFHS-6 (2023–24), and 1.9 in the SRS for 2024, below the replacement level of about 2.1 (at which each generation just replaces itself) for the fifth year running.
2.3 India in the demographic transition
The demographic transition is the move from high births and deaths to low births and deaths (theory and criticism in Unit 11b). India went through it in a lagged way:
- Deaths fell first (from 1921) because the means were exogenous: sanitation, drugs and famine relief came from outside the family and needed no change in values.
- Births fell later (from the 1970s) because they depend on endogenous factors: age at marriage, the desire for sons and the value of children, which change over a generation. The gap between the two falls was the population explosion.
- Unequal pace: Kerala and Tamil Nadu reached low fertility first, the Hindi-speaking north last, so India now holds populations at almost every stage (§4.3).
- The future: the United Nations (World Population Prospects 2024) projects a peak of about 1.7 billion in the early 2060s, then decline. India became the world’s most populous country in 2023.
Common confusion
Is India’s population still growing if fertility is below replacement? Yes. A TFR of 1.9 means fewer than two children per woman, but so many women aged 15–35 (born when fertility was high) are now having children that births still far exceed deaths. Numbers will rise for decades and fall only when these large cohorts age. This is population momentum.
3. Factors Influencing Growth: Fertility, Mortality and Migration
In simple words
Births in India are shaped by when people marry, how much they want sons, how much women can decide for themselves, how useful children are to the family, and how much schooling women have. Deaths fell because of better food, medicine and hospitals, but babies in villages and poor states still die more often. Movement within the country changes the make-up of both villages and cities.
3.1 Fertility: why Indian families were large, and why they shrank
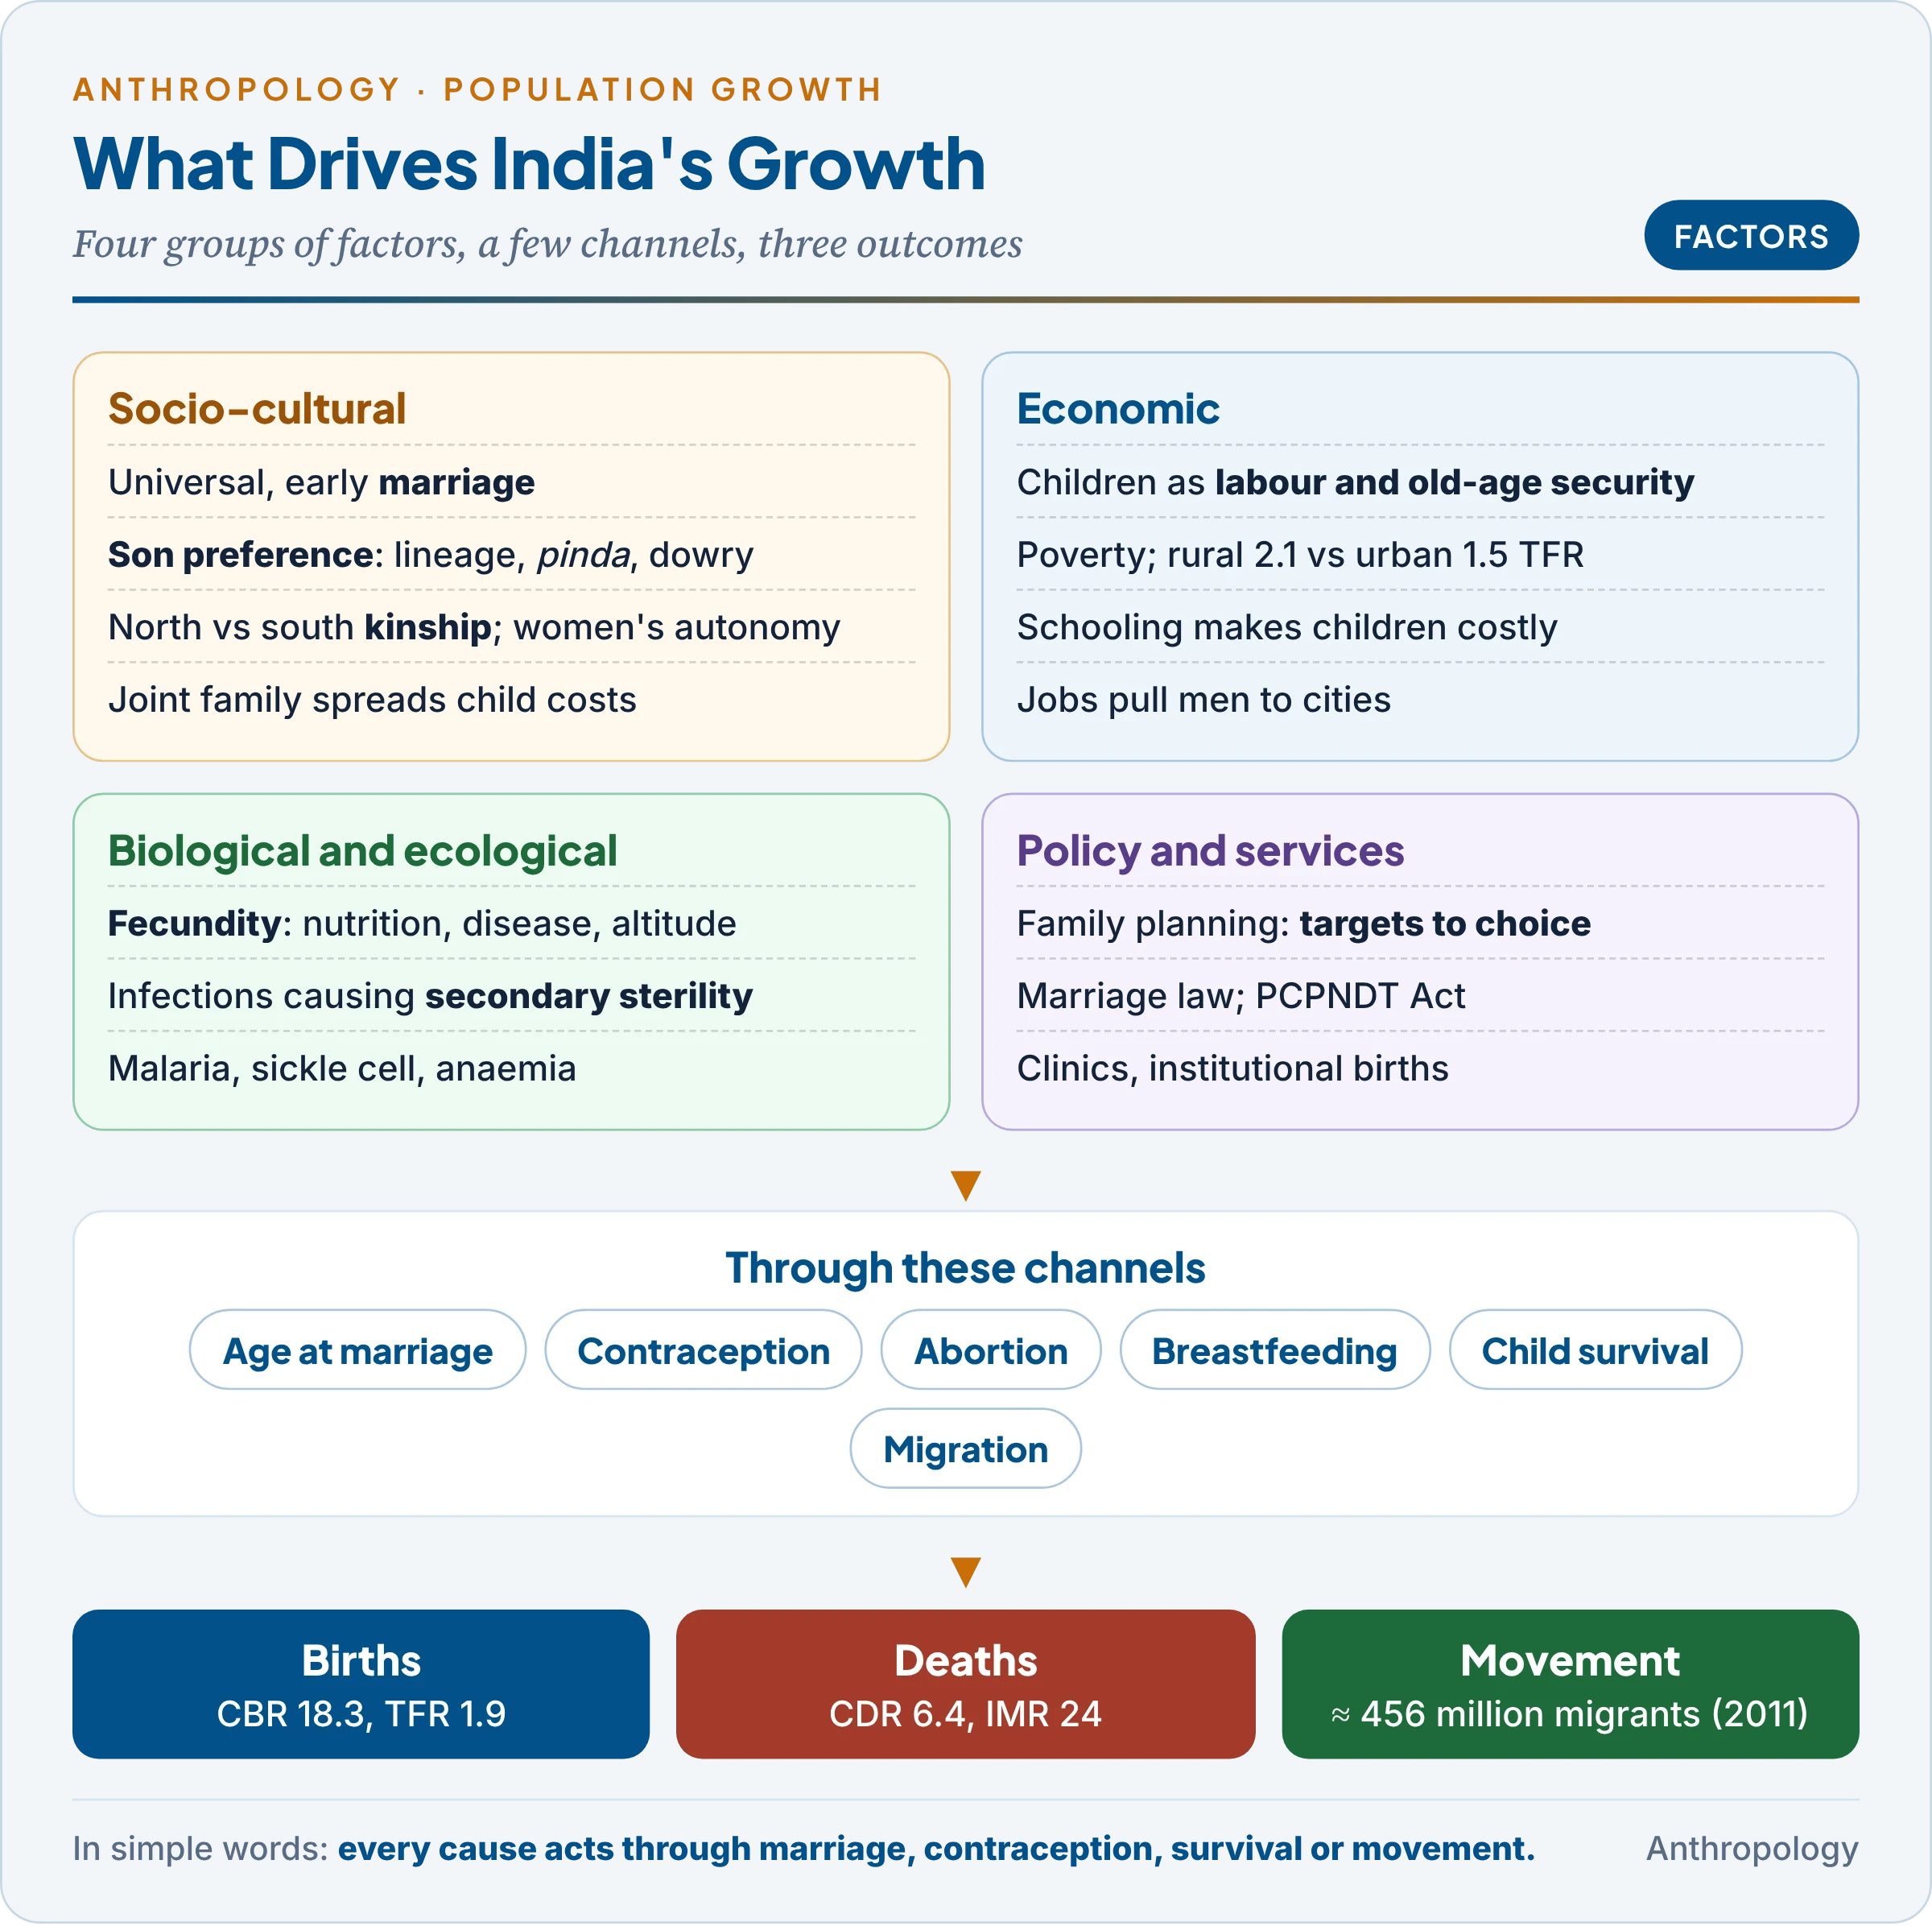
Every social factor acts through a few proximate determinants: age at marriage, contraception, abortion and breastfeeding (which delays the return of ovulation after a birth); these are explained in Unit 11a. The anthropological question is what moves them in India.
Example first: the Khanna Study and Manupur. In 1953–60 a Harvard–Indian team (John Wyon and John Gordon, The Khanna Study, 1971) supplied contraceptives and education in villages of Ludhiana district, Punjab, yet births barely fell. In 1970 the Ugandan political scientist Mahmood Mamdani studied one of these villages, Manupur, and argued in The Myth of Population Control (1972) that for poor farmers and labourers sons were wealth: more hands on the land, wages from city jobs, support in old age. Large families were a rational response to poverty, not ignorance. This is the Indian case behind the Australian demographer John Caldwell‘s wealth-flows theory (Unit 11b): fertility stays high while wealth flows from children to parents.
The main social and cultural factors are these:
- Universal and early marriage. Marriage was a religious duty (vivaha, a samskara or life-cycle sacrament), so almost everyone married, many as children, lengthening the years of exposure to childbirth. The Prohibition of Child Marriage Act (2006) sets 18 for women and 21 for men. Women aged 20–24 married before 18 fell from 47.4% (NFHS-3, 2005–06) to 20.1% (NFHS-6), a major reason births fell.
- Son preference. In patrilineal (descent through the male line) families a son continues the lineage, inherits land, performs the funeral rites and the shraddha offerings of pinda to ancestors, and supports his parents, while a daughter leaves at marriage, often with dowry. Couples therefore continue until they have the sons they want, which keeps families large and, once ultrasound arrived, distorts the sex ratio (§5).
- Kinship and women’s autonomy. Tim Dyson (a British demographer) and Mick Moore (a development scholar) showed in 1983 that south Indian kinship, with marriage among nearby kin, gives women more autonomy (control over their movement, money and decisions) than north Indian village exogamy, which sends brides to distant strangers. Autonomous women adopt contraception earlier, so the south’s fertility fell first (Unit 11b).
- Joint family. The American demographer Kingsley Davis (The Population of India and Pakistan, 1951) argued that the joint family spreads the cost of children over the whole group and allows early marriage, because a young couple need not support themselves.
- Women’s education. In NFHS-5 women with no schooling had a TFR of about 2.8, women with 12 or more years about 1.8: schooling raises marriage age, women’s voice in decisions and child survival.
- Child mortality. Where children die, parents have extra births as insurance; fertility fell first where infant deaths fell first.
- Religion. NFHS-5 gave Muslim women a TFR of 2.36 and Hindu women 1.94; the gap has narrowed in every round and follows education, income and region more than doctrine. Muslim-majority Malappuram in Kerala has lower fertility than Hindu-majority districts of Uttar Pradesh.
- Residence. Rural TFR 2.1, urban 1.5 (SRS 2024): in cities children cost more and earn less.
- Biological and ecological factors. Fecundity (the biological capacity to reproduce) varies with nutrition, disease and altitude. Sexually transmitted infections cause secondary sterility (infertility after earlier births), which depressed fertility in some isolated tribes (§7).
Field studies show how culture works inside these factors:
- Patricia Jeffery, Roger Jeffery and Andrew Lyon, Labour Pains and Labour Power (1989), in villages of Bijnor, Uttar Pradesh: a young wife in her husband’s household had little say over childbearing, which her mother-in-law and husband controlled.
- Alaka Malwade Basu, Culture, the Status of Women and Demographic Behaviour (1992): migrants from Tamil Nadu and Uttar Pradesh in the same Delhi slum, with the same income and clinics, behaved differently; Tamil women had fewer children and used health care more. Culture of origin, not only economics, shapes fertility.
- The American anthropologist David Mandelbaum (Human Fertility in India, 1974) drew such evidence together: fertility follows family roles, caste position and women’s status as they change over a couple’s life, not one fixed attitude.
3.2 Mortality: what fell, and what remains
Life expectancy at birth is about 70.6 years (SRS 2020–24): 72.8 for women, 68.7 for men. Women have outlived men in India only since the 1980s; before that, neglect of girls and maternal deaths cancelled their biological advantage. The table shows the main measures; note how much infant death now comes in the first days of life.
| Indicator | Latest value (source) |
|---|---|
| Infant mortality rate (IMR: deaths under one year per 1,000 live births) | 24; rural 27, urban 17 (SRS 2024) |
| Under-five mortality rate | 28 (SRS 2024) |
| Infant deaths in the first week | 52.7% (SRS 2024) |
| Maternal mortality ratio (MMR: maternal deaths per 100,000 live births) | 87 (SRS 2022–24) |
| IMR, highest and lowest state | Chhattisgarh 36, Kerala 8 (SRS 2024) |
India has largely conquered the infections that killed older children, but not the causes of newborn death (low birth weight, prematurity, infection at birth), which depend on the mother’s health and care at delivery. The gaps between village and city and between states show that mortality now follows poverty and health services.
- Child mortality in rural India stays higher because of maternal anaemia and undernutrition, closely spaced births, births far from hospitals, diarrhoea and pneumonia, and slower access to care. Institutional births have reached 90.6% (NFHS-6), helped by the Janani Suraksha Yojana (2005), a cash incentive for giving birth in a facility.
- Age- and sex-specific mortality. An age-specific death rate (deaths at a given age per 1,000 people of that age) traces a U-shaped curve: high in infancy, lowest at about 10–14, rising in old age. Split by sex, the Indian female curve was historically higher than the male at ages 1–4 (neglect of daughters, §5) and in the child-bearing years (maternal deaths). Both gaps have narrowed but not closed everywhere.
3.3 Migration
- Internal migration is large: Census 2011 counted about 456 million people (about 37%) living away from their previous place of residence.
- Women’s marriage migration is the biggest stream, because most marriages are patrilocal (the bride moves to the husband’s home).
- Men’s labour migration from Bihar, Uttar Pradesh, Odisha and the tribal belt makes cities younger and more male and leaves villages older and more female; male emigration to the Gulf is one reason for Kerala’s high ratio of women to men.
4. Age Structure: From a Young India to an Ageing India
In simple words
When births are high, a population is full of children. As births fall, the share of working-age adults rises, and later the share of old people. India is in the middle stage, with its largest ever working-age population, but the south is already ageing while the north is still young.
4.1 Shares, dependency and the dividend
- Census 2011: about 31% under 15, 60% aged 15–59, 8.6% aged 60 and above (about 104 million). NFHS-6: under-15 share down to 25.5%, 60-plus up to 12.9%. The India Ageing Report 2023 (UNFPA with the International Institute for Population Sciences) projects the elderly share to rise from 10.5% (2022) to 20.8% (2050).
- The dependency ratio is the number of children under 15 and adults 65 or over per 100 people aged 15–64. The demographic dividend is the extra growth possible while it is low: more savings, more women free to work, more spent on each child. It is a window, not a guarantee (Unit 11b).
- Feminisation of old age: women live longer and marry older men, so most of the oldest elderly are widows, often without income or property.
4.2 The demographic divide
The regional gap is now the most important fact about India’s population. The table compares the two ends.
| Indicator | High end | Low end |
|---|---|---|
| TFR (SRS 2024) | Bihar 2.9, Uttar Pradesh 2.6 | Delhi 1.2 |
| Crude birth rate (SRS 2024) | Bihar 26.8 | Kerala 11.1 |
| Life expectancy (SRS 2020–24) | Kerala 75.6 | Chhattisgarh 64.7 |
| MMR (SRS 2022–24) | Uttar Pradesh 154 | Six states below 70, including Kerala and Tamil Nadu |
- Only six states were above replacement in 2024: Bihar, Uttar Pradesh, Madhya Pradesh, Rajasthan, Jharkhand and Chhattisgarh. The south and west are small-family and ageing; the north-central Hindi belt is young and still growing, so the dividend is ending in one and beginning in the other.
- Political stake: Lok Sabha seats have rested on the 1971 Census since the 42nd Amendment (1976), a freeze extended by the 84th Amendment (2001) to the first census after 2026. New figures would shift seats from the south, which controlled its numbers, to the north, which is why Census 2027 is sensitive.
5. Sex Composition: The Missing Girls
In simple words
In most of the world there are slightly more women than men, because women live longer. India has fewer women than men, and fewer girls than boys, because daughters were neglected and, since the 1980s, female foetuses have been aborted after sex tests. The shortage is worst in the north-west and least among tribes and in the south and north-east.
5.1 The pattern
Example first. In Census 2011 Haryana, one of India’s richest states, had only 834 girls per 1,000 boys aged 0–6, the lowest in India, while north-eastern states such as Arunachal Pradesh and Mizoram had over 970. Wealth did not protect girls; social preference decided.
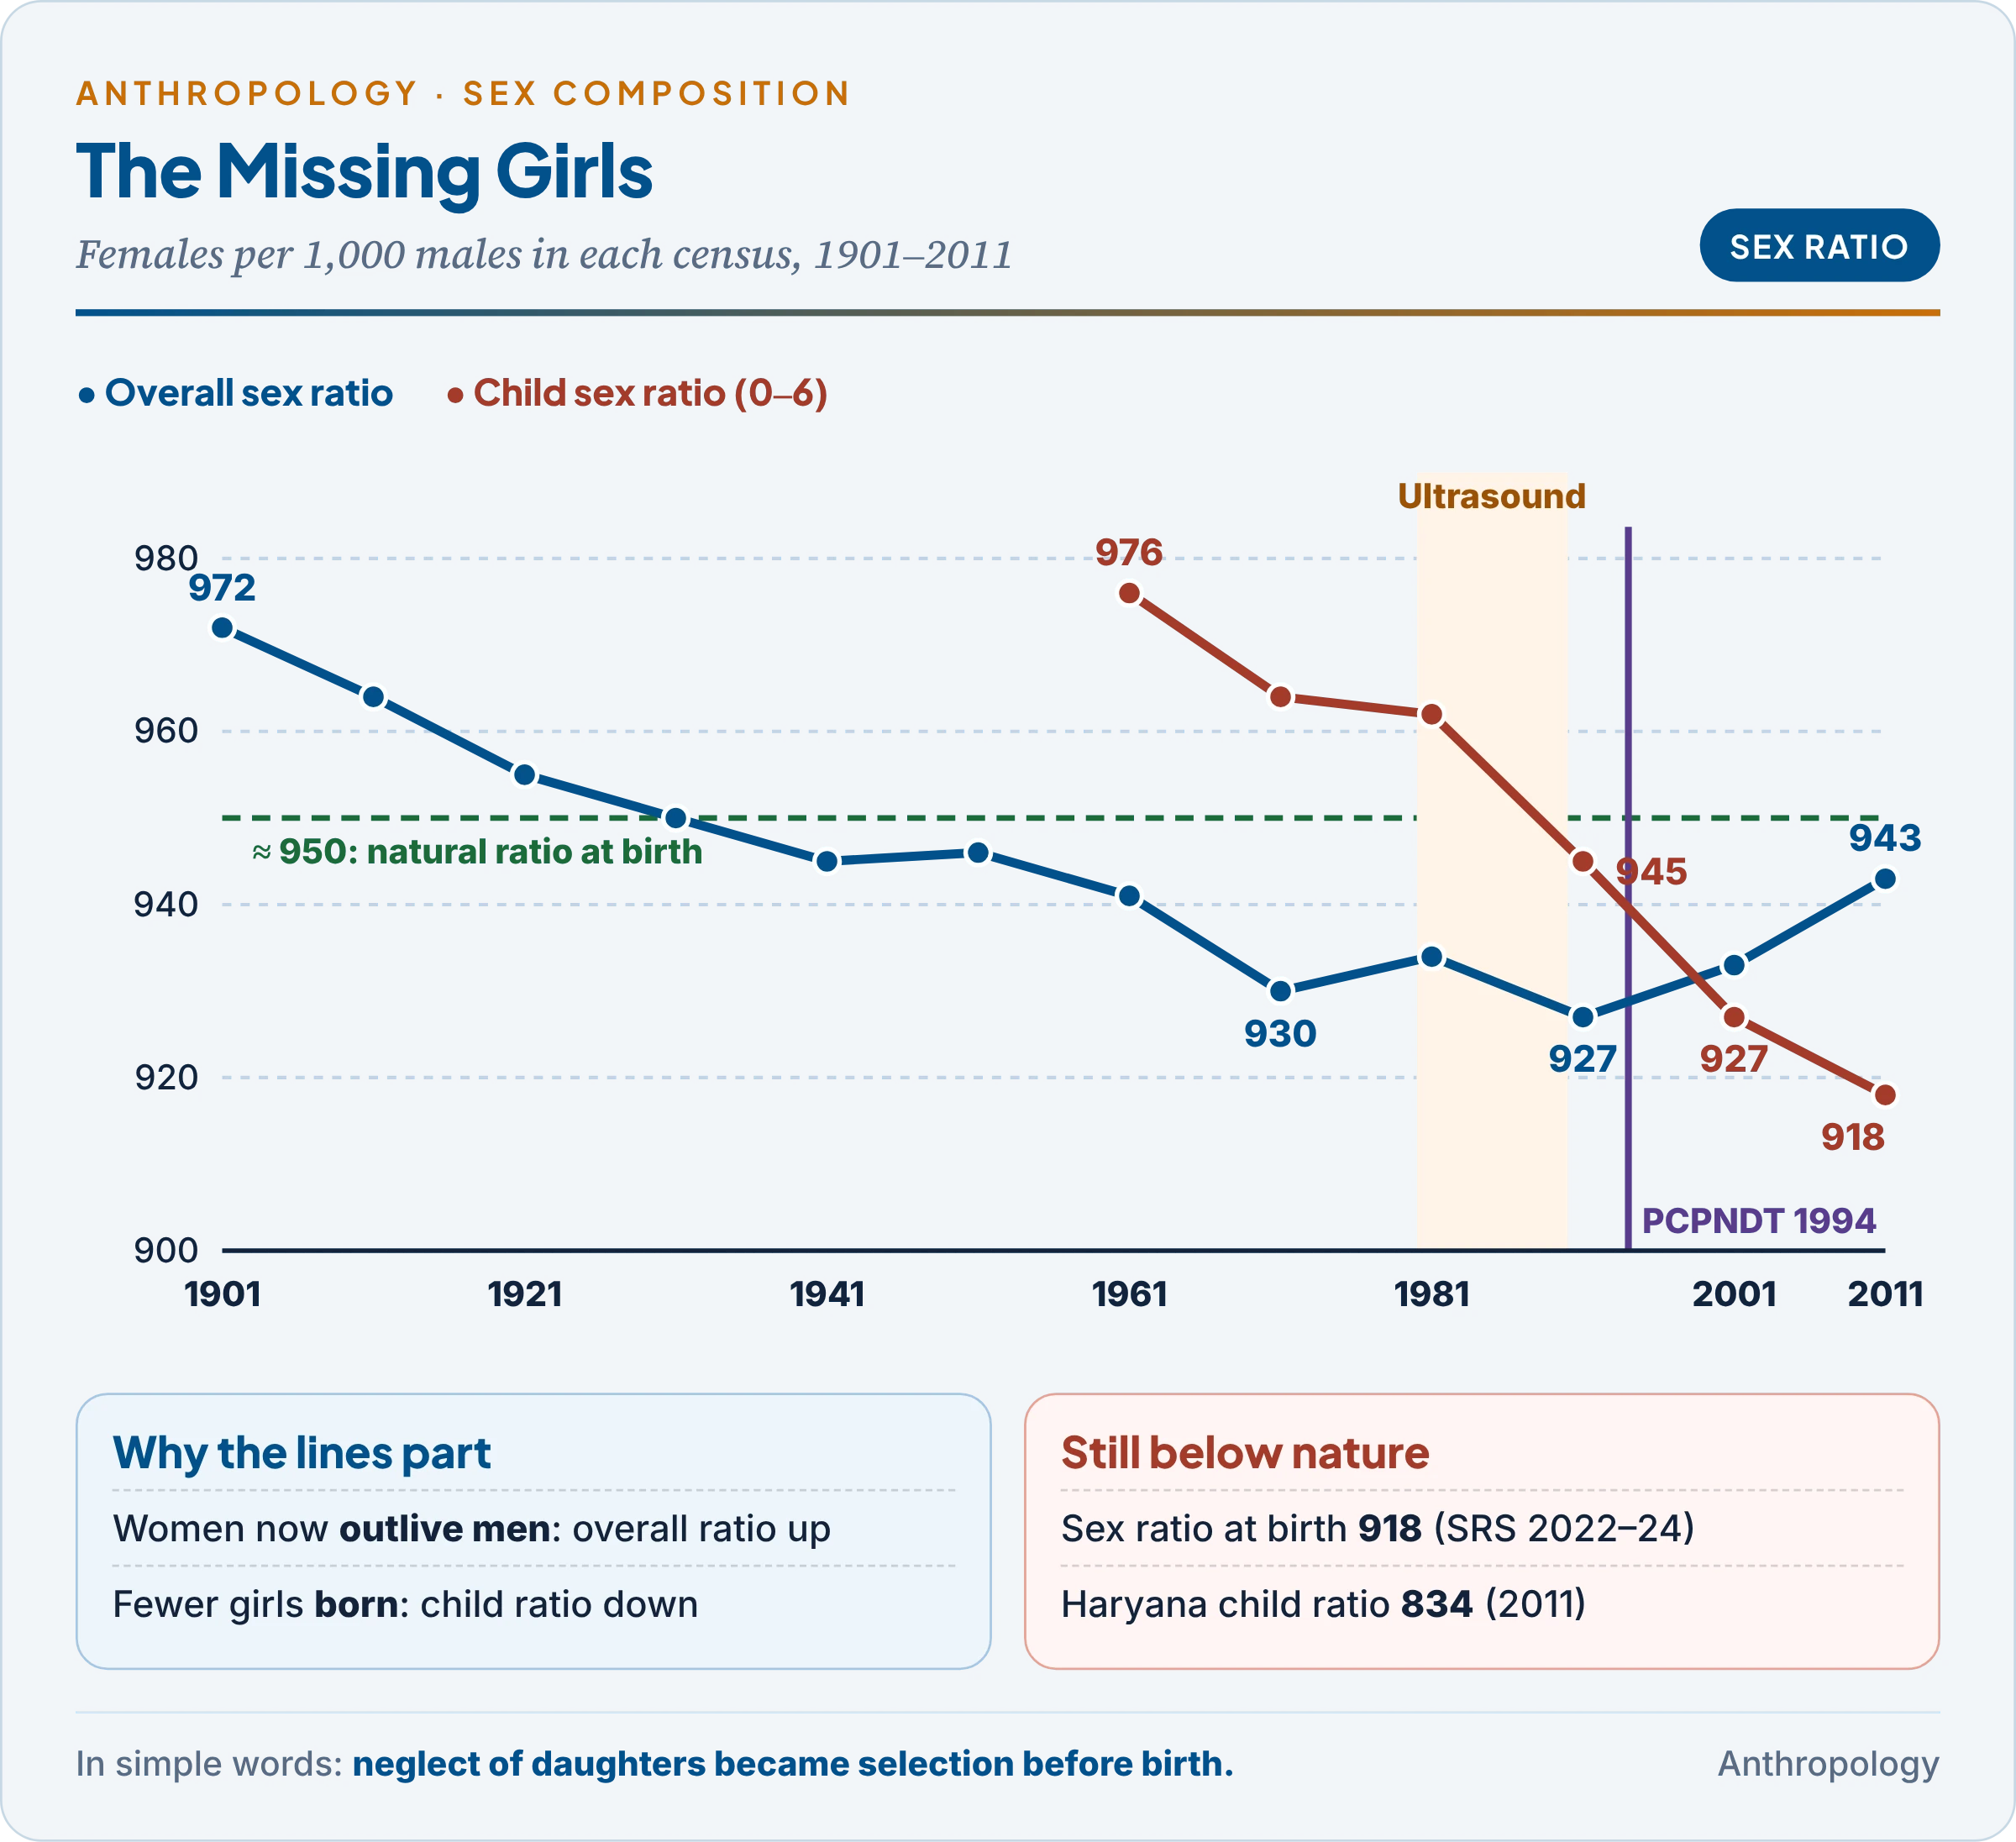
India gives the sex ratio as females per 1,000 males (most countries give males per 100 females). The table traces the overall ratio and the child ratio.
| Year | Overall sex ratio | Child sex ratio (0–6) |
|---|---|---|
| 1901 | 972 | — |
| 1951 | 946 | — |
| 1961 | 941 | 976 |
| 1971 | 930 | 964 |
| 1991 | 927 (lowest) | 945 |
| 2001 | 933 | 927 |
| 2011 | 943 | 918 |
| 2022–24 | Sex ratio at birth 918 (SRS) |
The child ratio fell in every census after 1961, and after 1991 the two move apart: the overall ratio rises because women now outlive men, while the child ratio falls because fewer girls are born. Nature gives about 105 boys per 100 girls at birth, about 950 girls per 1,000 boys; India’s 918 means many expected girls are never born.
Common confusion
Sex ratio, child sex ratio, sex ratio at birth: what is the difference? The overall sex ratio counts all ages and is raised by women’s longer lives. The child sex ratio (CSR) counts children aged 0–6 and reflects both births and early deaths. The sex ratio at birth (SRB) counts newborns only and is the clearest sign of sex-selective abortion. Because India’s overall ratio rose in 2011 while its CSR fell, the CSR and SRB are the measures that track discrimination against girls.
5.2 Explanations
- Colonial explanations rejected. British census commissioners blamed climate, race, polyandry or consanguineous marriage; the data did not support them.
- Female infanticide among some landed Rajput clans, notably the Jadejas of Kutch and Kathiawar, led to the Female Infanticide Prevention Act (1870), showing roots in lineage pride and dowry.
- Neglect of daughters. The American anthropologist Barbara Miller (The Endangered Sex, 1981) showed that girls in rural north India got less food and care and died more often. The demographer Monica Das Gupta (1987) found in rural Punjab that excess deaths fell mainly on girls born after an elder sister: parents rejected too many daughters, not daughters as such.
- “Missing women.” The economist Amartya Sen (1990) estimated that over 100 million women were missing in Asia, women who would be alive with equal care.
- Sex-selective abortion. Amniocentesis and then ultrasound (from the 1980s) let parents learn a foetus’s sex. Das Gupta and P.N. Mari Bhat (1997) showed that falling fertility intensified the bias: when couples want only two children, the pressure that one must be a son grows, and selection replaces neglect.
- The kinship map. The deficit is sharpest where patrilineal, patrilocal kinship, dowry and sons’ inheritance of land are strongest (Punjab, Haryana, western Uttar Pradesh, Rajasthan, Gujarat), and milder in the south, the north-east and among tribes (Scheduled Tribe sex ratio 990, CSR 957 in 2011), where women work, bride-price is common and daughters are valued.
5.3 Social implications
- Marriage squeeze: many men cannot find brides. The sociologist Ravinder Kaur (2004) documented cross-region marriages that bring brides from poorer eastern and southern states to Haryana and Punjab, across caste and language, sometimes through brokers and trafficking.
- Insecurity for women and pressure for early marriage; fewer daughters to care for elderly parents.
- Response: the Pre-Conception and Pre-Natal Diagnostic Techniques (PCPNDT) Act (1994, renamed 2003) bans sex determination; Beti Bachao Beti Padhao (launched at Panipat on 22 January 2015) targeted low-CSR districts. Law works slowly while the value of daughters is unchanged.
6. Social Composition: Caste, Tribe, Religion, Residence and Household
In simple words
India’s population is also structured by social groups: castes and tribes, religious communities, villagers and town-dwellers, and different kinds of family. These groups differ in how fast they grow mainly because they differ in schooling, income and where they live.
6.1 Social elements of the population
The table summarises the main elements in Census 2011.
| Element | Census 2011 | Note |
|---|---|---|
| Scheduled Castes | 16.6% | Largest numbers in Uttar Pradesh; highest share in Punjab (about 32%) |
| Scheduled Tribes | 8.6% (104.3 million) | About 90% rural (§7) |
| Hindus / Muslims | 79.8% / 14.2% | Decadal growth 2001–11: Muslims 24.6%, Hindus 16.8%; both slowing |
| Literacy | 74.0% (women 65.5%) | Women’s literacy best predicts falling fertility |
| Urban | 31.2% | Rising; Census 2027 will show the new level |
| Density | 382 persons per sq km | Bihar 1,106 (highest); Arunachal Pradesh 17 (lowest) |
- Differential growth between communities follows education, income, age at marriage and region, and narrows as these converge (§3.1).
- Caste-bound occupations and the city. Caste ties a group to a hereditary occupation (the jajmani system, Unit 3.2b). Urban life loosens this: factory, office and service jobs are open to all, and anonymity weakens purity rules. Yet caste survives in the city as networks for jobs, housing and marriage, and stigmatised work such as sanitation stays caste-bound. Urbanisation changes caste’s economic role faster than its social one.
6.2 Household and family structure
Family organisation governs marriage, fertility and care of the old. The typology of families is in Unit 2.4; the points that matter here are these.
- The joint family (generations and married brothers sharing residence, kitchen, property and worship) was the norm of landed and upper-caste households. The American anthropologist Pauline Kolenda (1968) showed that its frequency varies by region and caste, being lower among the landless, who had no property to hold together.
- Economic aspects: joint ownership keeps land undivided, pools labour and income, insures members against sickness and old age, and spreads the cost of children; its weaknesses are weak individual incentive, disputes over shares and the low position of young wives.
- A phase, not only a type. The Indian sociologist A.M. Shah (The Household Dimension of the Family in India, 1973) showed that households pass through joint and nuclear phases in a developmental cycle, joining when sons marry and splitting at partition, so a one-time count understates joint living.
- Change: migration, wage work, small families and women’s schooling spread nuclear households, while joint obligations to parents, rituals and property continue.
- Matrilineal pockets (descent through the mother): the Khasi and Garo of Meghalaya, and historically the Nayar of Kerala, whose tharavad (a matrilineal joint household managed by the senior male, the karanavar) was dissolved by twentieth-century laws. Meghalaya’s NFHS-5 TFR of 2.9 shows that matriliny alone does not lower fertility.
- Polyandrous pockets (a woman married to several brothers): the Jaunsari of Jaunsar-Bawar (Uttarakhand), Kinnaur (Himachal Pradesh) and the Hatti of Sirmaur, where a public wedding of two brothers to one woman in July 2025 revived debate; historically also the Toda. Polyandry keeps land undivided and limits households and births.
7. Tribal Demography
In simple words
India’s tribes as a whole grew faster than the rest of the population and have a better balance of girls and boys. But some very small tribes, especially in the Andaman Islands, shrank to a few dozen people after contact brought disease and loss of land. Their problem is survival, not too many births.
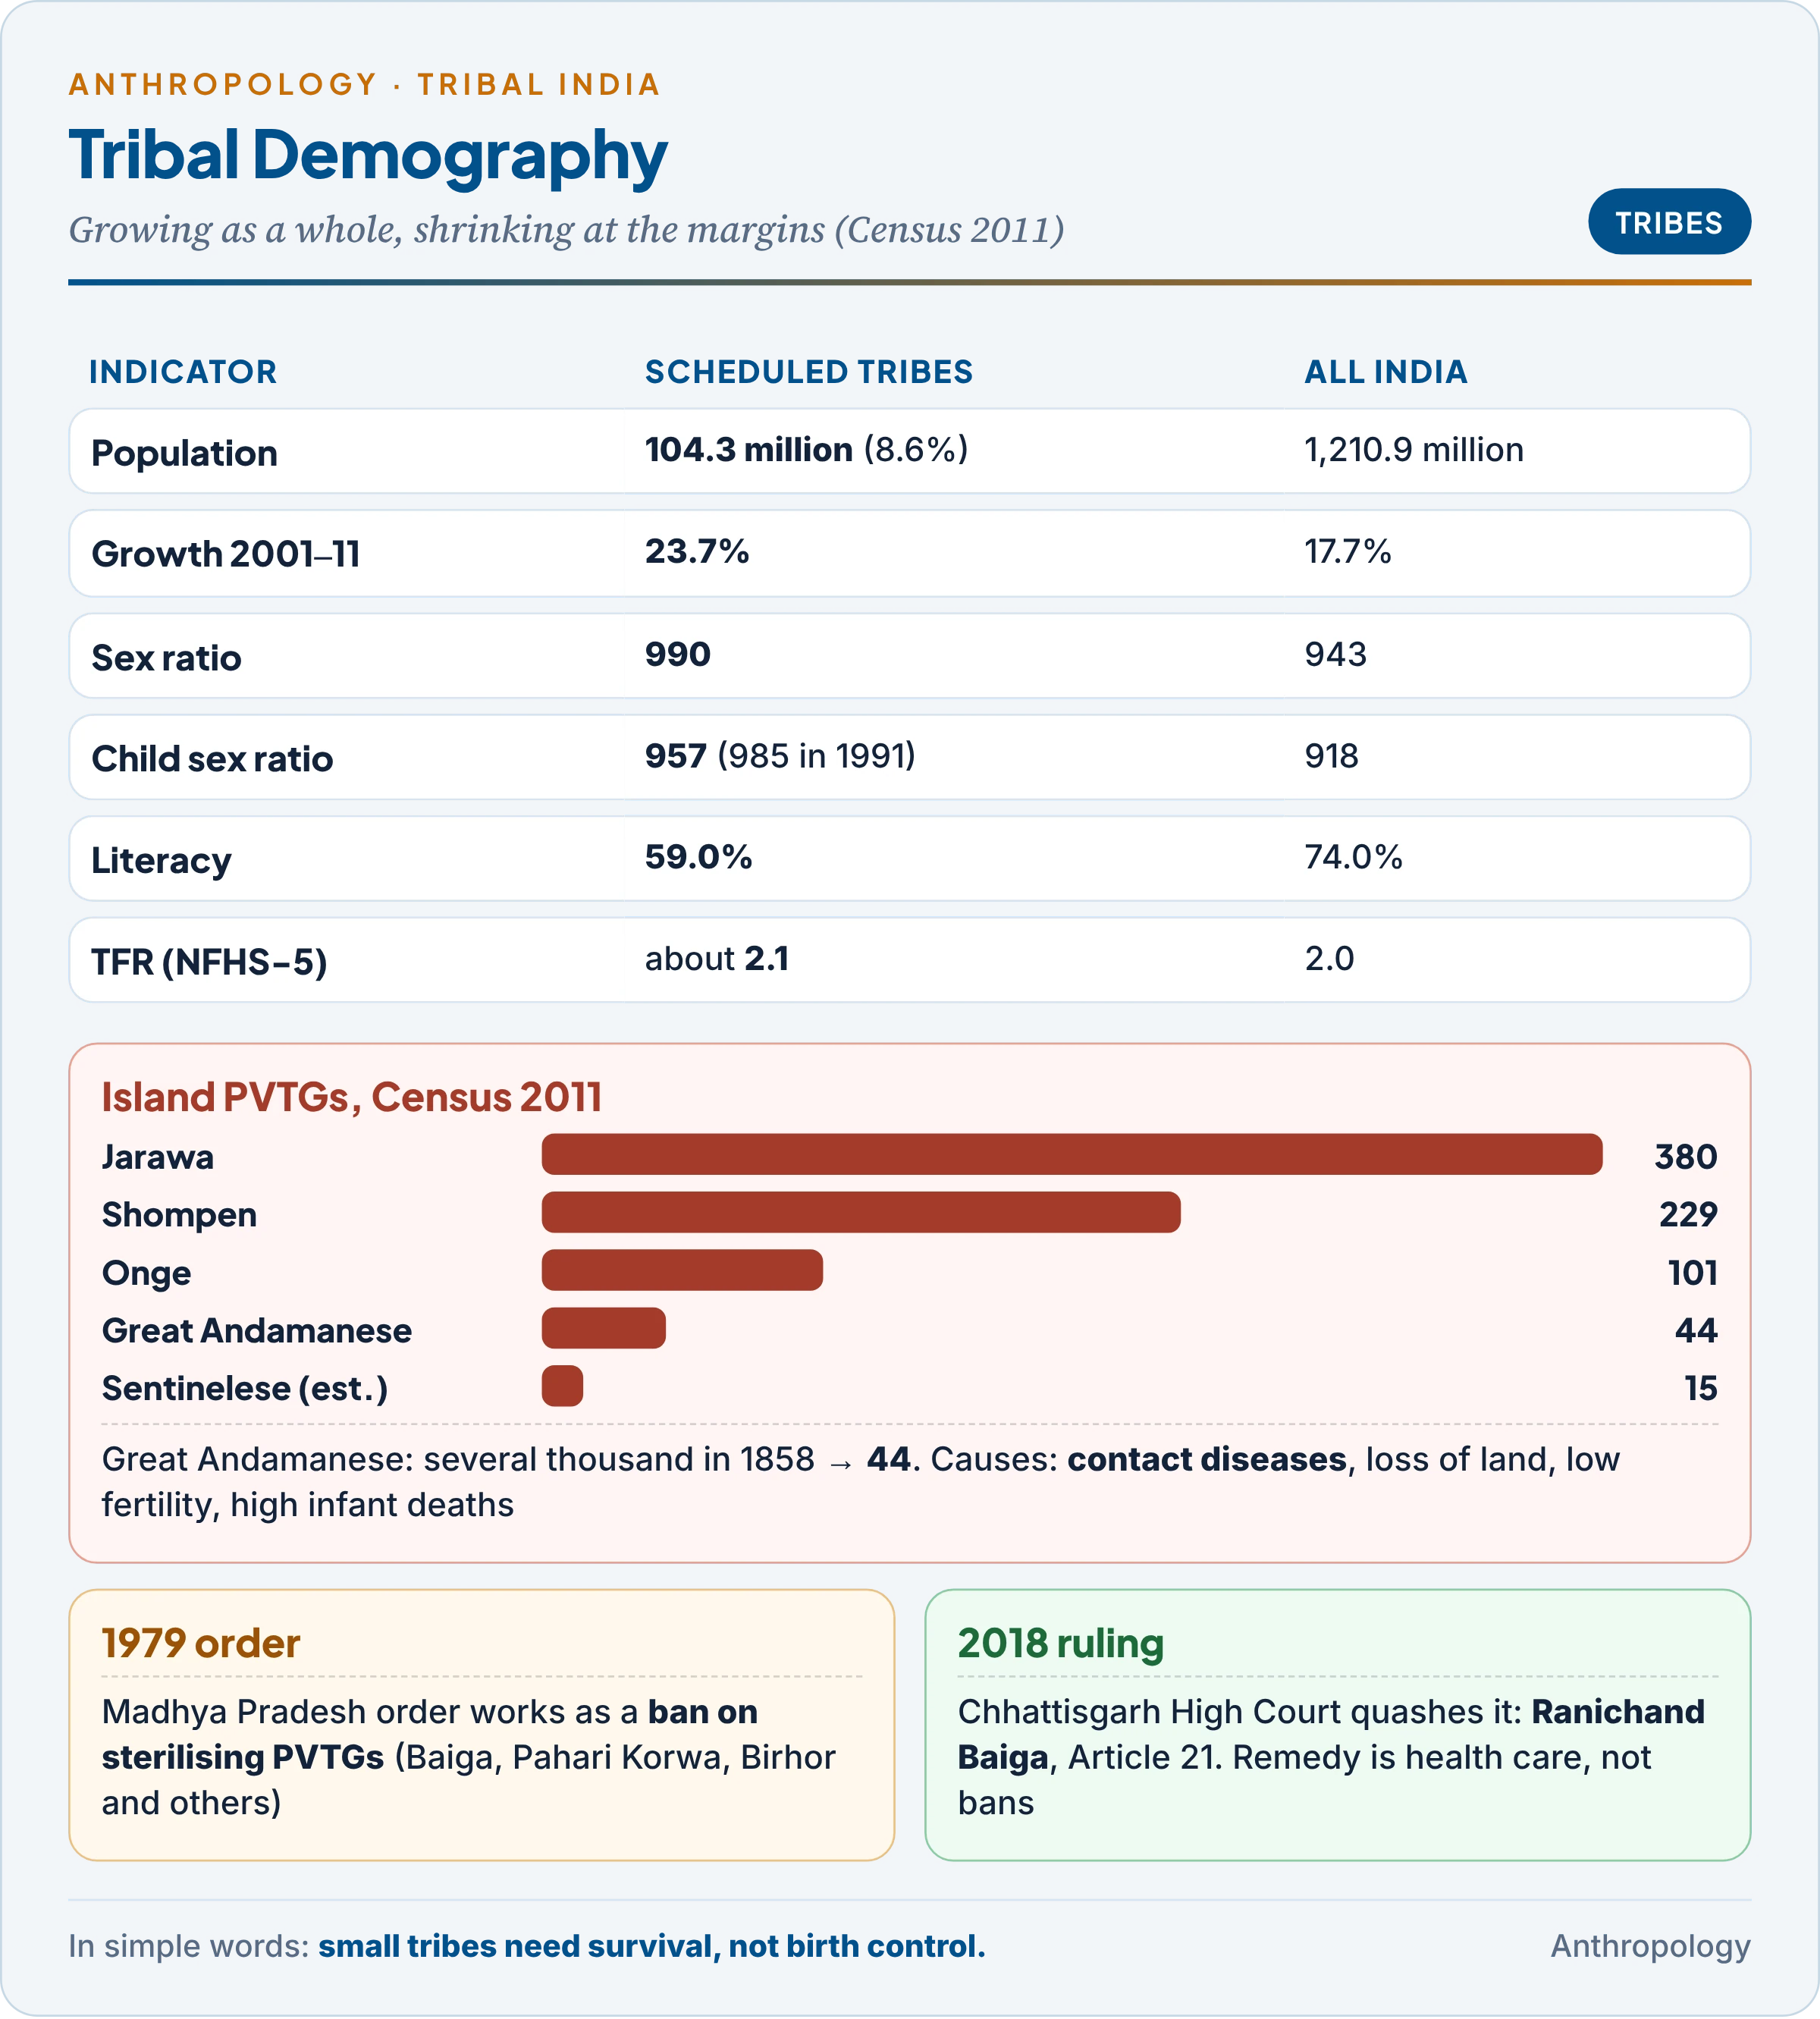
Example first. When British settlement of the Andaman Islands began in 1858, the Great Andamanese numbered several thousand. Contact brought measles, syphilis, influenza and alcohol, loss of forest and very low fertility. Census 2011 counted 44; in 2010 the last speaker of the Bo language died. The same census found 101 Onge, 380 Jarawa, 229 Shompen and an estimated 15 Sentinelese.
7.1 Scheduled Tribes as a whole
| Indicator (Census 2011) | Scheduled Tribes | All India |
|---|---|---|
| Decadal growth 2001–11 | 23.7% | 17.7% |
| Sex ratio | 990 | 943 |
| Child sex ratio | 957 | 918 |
| Rural share | about 90% | 69% |
| Literacy | 59.0% | 74.0% |
- Faster growth reflects somewhat higher past fertility and the addition of new communities to ST lists, which raises the count without any births.
- Fertility has converged: ST TFR was about 2.1 in NFHS-5, close to the national 2.0, down from about 2.5 in NFHS-4. Mortality has not: tribal infants and children still die more often, through remoteness, malaria, undernutrition and anaemia.
- Better sex ratio reflects women’s economic role and bride-price, but the tribal CSR has fallen (985 in 1991, 972 in 2001, 957 in 2011) as contact with caste society grows.
- Micro-studies show wide variation behind the averages: studies of the Muria, Maria, Bhattra and Halba of Bastar (Basu and Kshatriya, 1989) found life expectancy of only about 36–45 years, far below the national level of the time.
- Disease and genes: sickle cell disease and G6PD deficiency (an enzyme defect that makes red cells break down), both linked to malaria, are frequent in central, western and southern tribes; the National Sickle Cell Anaemia Elimination Mission was launched at Shahdol on 1 July 2023. Very small groups are also exposed to chance losses and inbreeding.
7.2 PVTGs and the policy paradox
- Particularly Vulnerable Tribal Groups (PVTGs, called Primitive Tribal Groups until 2006) are 75 communities marked by pre-agricultural technology, very low literacy, economic backwardness and a stagnant or declining population: demography is part of their definition.
- The paradox of protection: a 1979 order of the Madhya Pradesh government worked in practice as a ban on sterilising PVTGs (Baiga, Pahari Korwa, Abujhmaria, Birhor, Kamar), to protect their numbers. Poor Baiga women with many children were refused services others received. The Chhattisgarh High Court quashed it on 12 December 2018 (Ranichand Baiga v. State of Chhattisgarh) under Article 21 (right to life and liberty).
- Lesson: coercive sterilisation (1976) and coercive protection (1979) failed for the same reason: both treated people as numbers rather than as choosers. PVTG numbers fall through mortality and ill-health, so the remedy is health care and food security. PM-JANMAN, launched on 15 November 2023, targets housing, roads, water, health and nutrition in PVTG habitations (Unit 9.1b).
8. Population Policy: Evolution and Evaluation
In simple words
India was among the first countries to plan its population. For decades it chased targets, mostly by sterilising women, and during the Emergency it forced sterilisation on millions. It later shifted to choice and health. Fertility finally fell, mainly where women were educated and children survived.
8.1 Evolution
Example first: 1976. During the Emergency (1975–77) officials, teachers and police were given sterilisation targets, and millions of men were sterilised in 1976–77, many under pressure or force. The backlash helped defeat the government in 1977; “family planning” was renamed family welfare and stayed discredited for years. The table lists the main steps and the shift each made.
| Year | Step | Shift |
|---|---|---|
| 1952 | National Family Planning Programme | First national programme in the world |
| 1976 | National Population Policy; seats frozen on the 1971 Census | Incentives, then coercion |
| 1977 | Renamed Family Welfare | Voluntary in principle |
| 1978 | Marriage age raised to 18 for women, 21 for men | Marriage as a fertility lever |
| 1994 | Cairo ICPD | From targets to reproductive health and rights |
| 1996 | Target-Free Approach | Needs assessed locally |
| 2000 | National Population Policy 2000; National Commission on Population | Meet unmet need; replacement TFR by 2010; stable population by 2045 |
| 2005 | National Rural Health Mission; Janani Suraksha Yojana | Child and maternal survival |
| 2016 | Mission Parivar Vikas | High-fertility districts |
8.2 Evaluation
- Targets instead of welfare. Success meant counts of sterilisations, which bred inflated figures, coercion and poor camps, while the reasons people wanted children (child deaths, poverty, old-age security) were untouched.
- Female bias. In NFHS-6 36.5% of married women were sterilised against 0.5% of men; vasectomy, the simpler operation, is shunned through fears for masculinity.
- Late, not spaced. Couples accepted sterilisation only after reaching the family size they wanted, so contraception rarely spaced births.
- Isolation from development. Family planning was cut off from schooling, child health and women’s work, the things that actually lower fertility.
- “Development is the best contraceptive”, said the health minister Karan Singh at the Bucharest World Population Conference (1974). Kerala and Tamil Nadu proved it in a particular sense: fertility fell before high incomes, through women’s literacy, child survival and public health; poorer Bangladesh cut fertility with door-to-door female family-planning workers.
- Ignoring culture. Central programmes ignored who decides about children (husbands and mothers-in-law, §3.1), the ritual place of sons, and women’s reluctance to visit clinics staffed by men or placed where neighbours would see them. Anthropological studies showed that clinic location and timing, women staff and messages in local idiom decide whether services are used.
- Penalties. Several states barred people with more than two children from panchayat elections; the Supreme Court upheld Haryana’s rule in Javed v. State of Haryana (2003). Critics found desertion of wives, concealed births and sex selection; ageing Andhra Pradesh repealed its rule in November 2024.
- Achievements: replacement fertility, child marriage more than halved since 2005–06, institutional births above 90%, and a shift to reproductive rights.
9. Population, Development and the Challenges Ahead
In simple words
Whether a large population helps or hurts development depends on whether people are healthy, educated and employed. The next fifty years bring a peak and then a decline in numbers, rapid ageing, a north–south gap, a shortage of girls and large movements to the cities.
- Growth and development. Ansley Coale and Edgar Hoover (1958) used India to argue that rapid growth diverts savings into feeding more children; the Danish economist Ester Boserup (1965) argued that population pressure drives agricultural innovation. The current view is that the effect depends on jobs, institutions and human capital, and that the link runs both ways: development lowers fertility, and lower fertility frees resources for development.
- Challenges of the next fifty years:
- Peak and decline after the early 2060s, shifting policy from limiting births to using and caring for people.
- Ageing: one in five Indians over 60 by 2050; pensions, chronic disease, care as children migrate.
- Regional imbalance and the delimitation question after Census 2027.
- Gender imbalance: a sex ratio at birth near 918 means a marriage squeeze for decades.
- Youth employment before the dividend window closes around mid-century.
- Double burden of malnutrition: overweight or obesity among women aged 15–49 at 30.7% alongside child stunting of 29.3% (NFHS-6).
- Survival of PVTGs, which depends on health care and land security.
Key Terms
| Term | Meaning in simple words |
|---|---|
| Population structure | Make-up by age, sex, residence, social group, literacy and occupation |
| Balancing equation | Change in population = births − deaths ± net migration |
| Total fertility rate (TFR) | Average number of children a woman would have at current rates |
| Replacement level | TFR of about 2.1, at which each generation replaces itself |
| Population momentum | Continued growth after fertility falls, because many young women remain |
| Year of the great divide | 1921, after which India’s population never fell again |
| Exogenous and endogenous factors | Causes from outside the family (medicine) versus from within (values, marriage) |
| Infant mortality rate (IMR) | Deaths under one year per 1,000 live births |
| Maternal mortality ratio (MMR) | Maternal deaths per 100,000 live births |
| Child sex ratio (CSR) | Girls per 1,000 boys aged 0–6 in a census |
| Sex ratio at birth (SRB) | Girls born per 1,000 boys born |
| Son preference | Wanting sons for lineage, ritual, inheritance and old-age support |
| Missing women | Women who would be alive with the same care as men (Sen) |
| Dependency ratio | Dependants (under 15, 65 and over) per 100 people aged 15–64 |
| Demographic dividend | Extra growth possible while the working-age share is high |
| Developmental cycle | Households pass through joint and nuclear phases (A.M. Shah) |
| PVTG | Particularly Vulnerable Tribal Group: small tribes with stagnant or declining numbers |
Contemporary Developments
- SRS Statistical Report 2024 (May 2026): TFR 1.9 (rural 2.1, urban 1.5), CBR 18.3, CDR 6.4, IMR 24, U5MR 28; sex ratio at birth 918 (2022–24); only six states above replacement.
- NFHS-6 (2023–24), released 29 May 2026: TFR 2.0; contraceptive use 69.1%; child marriage down to 20.1%; stunting 29.3%; 60-plus share 12.9%.
- Census 2027: the first digital census with self-enumeration; houselisting 1 April–30 September 2026; population enumeration in February 2027 (reference date 1 March 2027; September 2026 in Ladakh and snow-bound areas); the first full caste count since 1931.
- MMR 87 for 2022–24 (SRS, May 2026) and life expectancy 70.6 for 2020–24.
Diagrams to Master
- Topic map: size and phases, structure (age, sex, social group, household), the four groups of factors, tribal demography, challenges.
- Growth phases: population bars for census years; mark the four phases, 1921 and the slowing after 1981.
- Factors of growth: biological, socio-cultural, economic and policy factors acting through marriage, contraception, child survival and migration.
- Sex ratio trend: overall ratio 972 → 927 → 943 and CSR 976 → 918; mark the spread of ultrasound and the PCPNDT Act.
- Tribal demography: ST against all-India figures; island PVTGs with 2011 numbers.
Revision Grid
| Scholar | Work (year) | Key idea |
|---|---|---|
| Kingsley Davis | The Population of India and Pakistan (1951) | Joint family spreads the cost of children |
| Ansley Coale and Edgar Hoover | Population Growth and Economic Development in Low-Income Countries (1958) | Rapid growth slows development; India as the case |
| Pauline Kolenda | “Region, Caste and Family Structure” (1968) | Joint family varies by region and caste |
| John Wyon and John Gordon | The Khanna Study (1971) | Contraceptive supply barely lowered Punjab births |
| Mahmood Mamdani | The Myth of Population Control (1972) | Large families were rational in Manupur |
| A.M. Shah | The Household Dimension of the Family in India (1973) | Households cycle between joint and nuclear |
| David Mandelbaum | Human Fertility in India (1974) | Fertility follows family roles, caste and women’s status |
| Barbara Miller | The Endangered Sex (1981) | Neglect of daughters in rural north India |
| Tim Dyson and Mick Moore | “On Kinship Structure, Female Autonomy, and Demographic Behavior in India” (1983) | Southern kinship, autonomy, lower fertility |
| Monica Das Gupta | Rural Punjab study (1987) | Excess deaths of girls with elder sisters |
| Patricia Jeffery, Roger Jeffery, Andrew Lyon | Labour Pains and Labour Power (1989) | Young wives in Bijnor lacked control over childbearing |
| Amartya Sen | “More Than 100 Million Women Are Missing” (1990) | Excess female mortality |
| Alaka Malwade Basu | Culture, the Status of Women and Demographic Behaviour (1992) | Same slum, different fertility by culture of origin |
| Monica Das Gupta and P.N. Mari Bhat | Fertility decline and sex bias (1997) | Small families intensify sex selection |
| Ravinder Kaur | Cross-region marriages (2004) | Brides brought to sex-ratio-deficit states |
Previous Year Questions
Indian population: factors influencing its structure and growth
- 2025Elucidate the role of demographic and social factors for population growth in India.
- 2024What are the demographic challenges of India’s changing population dynamics in the next 50 years?
- 2021Delineate the factors influencing fertility in Indian population.
- 2018What are the various factors influencing population growth in India? Discuss.
- 2017Give your assessment of the reasons for the imbalance in the sex-ratio in India.
- 2010Critically examine the factors responsible for the high population growth in India and suggest suitable measures for population control.
- 2006Write in brief ‘Population Growth in India indicating causes and measures of its control’
- 2004Write a note on Demographic transition in India.
- 2004Bring out the interrelationship between population growth and development in the Indian context.
- 2002Write a note on Age specific and sex specific mortality rates and dependent factor.
- 1999Point out the salient features of traditional joint family system in India. Trace causes for its disintegration in recent decades.
- 1997Critically evaluate the Indian Population Policies. Suggest appropriate measures for its improvement.
- 1996Write a note on Child mortality in rural India.
- 1995Write a note on Social implication of sex-ratio in Indian population.
- 1993Write a note on Caste bound occupations vis-a-vis urban populations.
- 1992Write a note on Joint family system ‘in india.
- 1989Write a note on Structure and function of Joint family.
- 1987Write a note on Social elements in Indian population.
- 1987Write a note on Nayar Tharavad and universality of the family.
- 1986Write a note on Joint family in modern India.
- 1983Write a note in 200 words : Economic aspects of joint family.
- 1983Write a note in 200 words: Polyandrous family.
- 1982Write a note on (200 words) : Matrilineal cultures in India.
- 1981Distribution of polyandry in India. (200 words).
Related questions from other units
- 2026Unit 11.3: What do you understand by fertility and mortality? How are these influenced by biological and socio-ecological factors?
- 2026Unit 9.1: Write notes on: Particularly Vulnerable Tribal Group (PVTG) of the islands.
- 2025Unit 9.1: What are the identifying criteria for PVTGs in India? Examine their current status, nomenclature and distribution.
- 2022Unit 11.2: Discuss the contemporary population problems in the light of various socio-cultural demographic theories.
- 2021Unit 11.3: Discuss the bio-social determinants of fertility and fecundity.
- 2018Unit 11.3: Define fecundity and explain major factors affecting fecundity in Indian populations.
- 2013Unit 11.2: Write a note in 150 words on Demographic transition.
- 2008Unit 6.2: Discuss the health problems faced by tribal populations in India. Suggest some corrective measures.
- 1995Unit 6.2: Describe the socio-cultural factors related to the poor health conditions of the Indian tribal population. Suggest measures for improving these conditions.
More from Demographic Profile of India: all notes of this unit · every PYQ of this unit · Anthropology Optional hub