

11.2 Demographic theories- biological, social and cultural.
Official Syllabus: Paper I, Unit 11.2
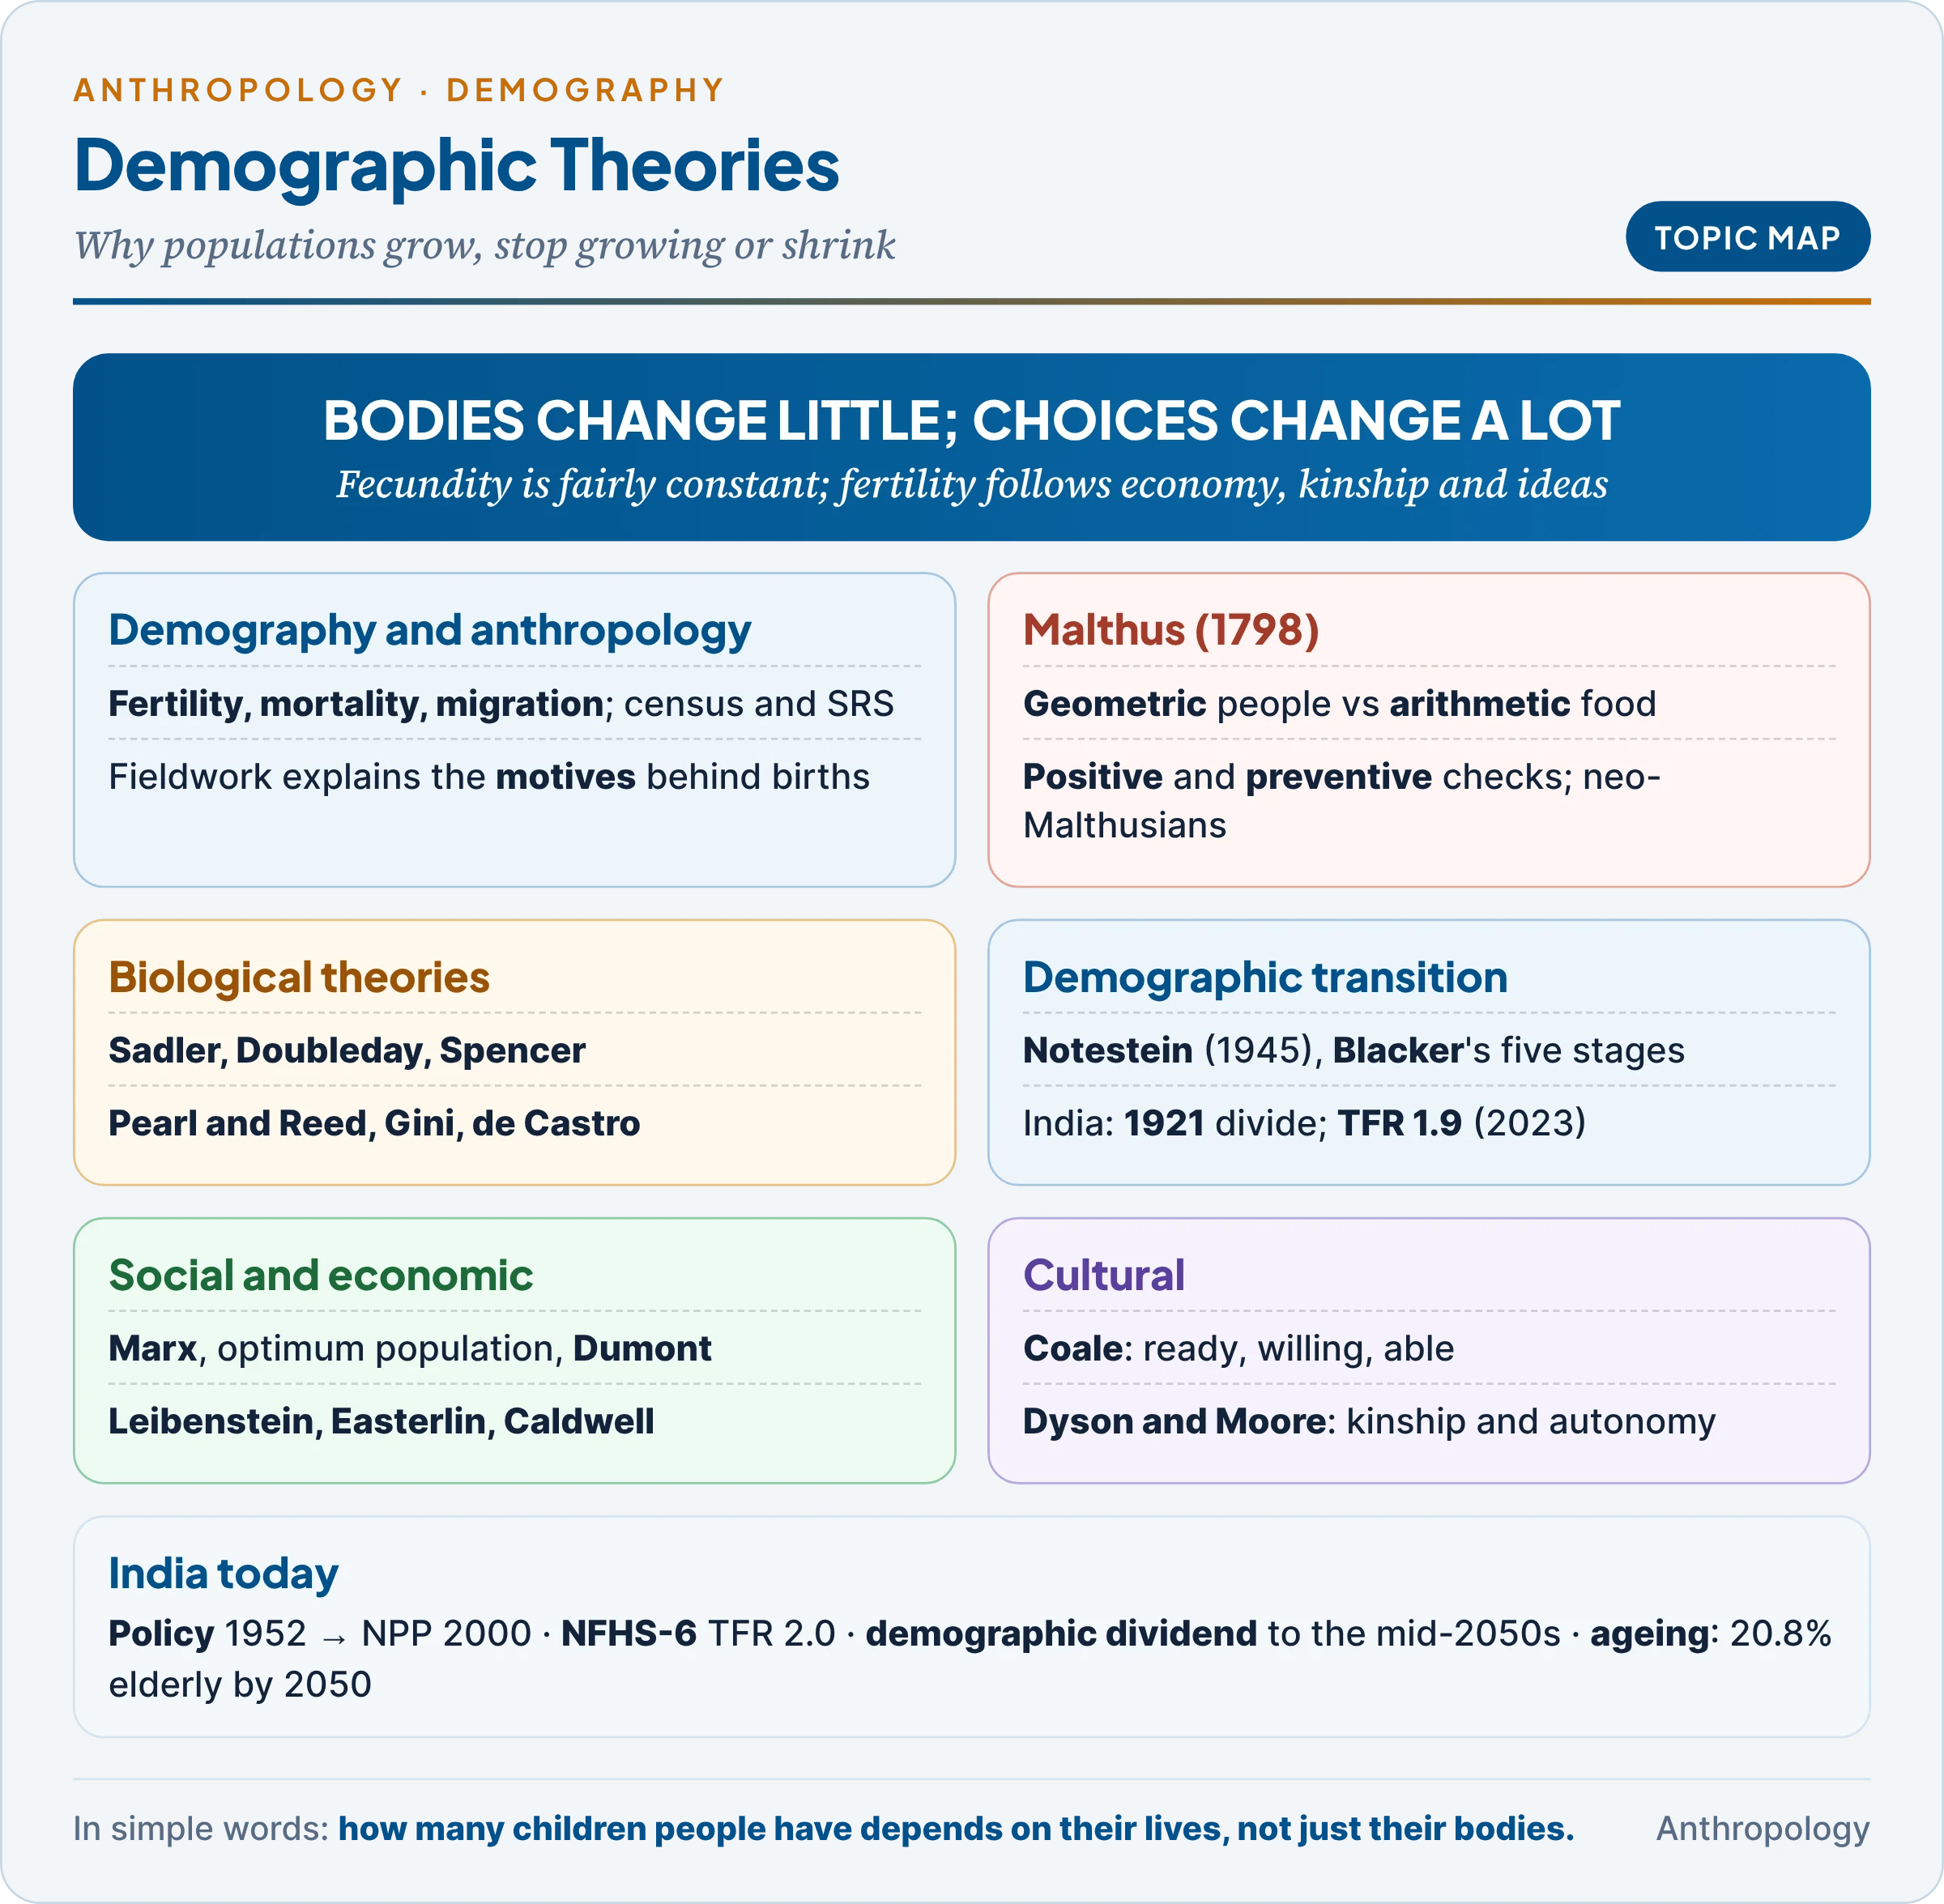
Unit 11a described the bioevents of a woman’s reproductive life and the measures of fertility. This article asks why whole populations grow, stop growing or shrink. Biological theories say a natural law, working through the body, regulates human numbers. Social and economic theories say numbers follow the economic system, class and the costs and benefits of children. Cultural theories say ideas, kinship and values decide how many children people want. The demographic transition theory cuts across all three, and India’s history is one of its best test cases.
1. Demography and Anthropology
In simple words
Demography counts people: how many are born, how many die and how many move. Anthropology asks why people in different societies have the number of children they do. Together they explain population change as the result of both bodies and beliefs.
1.1 What demography studies
- Demography is the study of human population size, composition and distribution, and of how they change through fertility (births), mortality (deaths) and migration.
- Formal demography measures these from the census (a complete count at one date) and vital registration (records of births, deaths and marriages). Social demography asks about their causes and consequences.
- The balancing equation: P₂ = P₁ + (B − D) + (I − E), where B − D is natural increase and I − E is net migration.
- Vital statistics record what happened, not why; the motives and family strategies behind a birth are where anthropology enters.
1.2 Why anthropology matters to demography
- Demographic behaviour is cultural behaviour. Marriage age, residence rules, widow remarriage, breastfeeding and son preference are set by culture, so two populations with the same income can have very different birth rates (§6.1).
- Fieldwork reveals motives. The Australian demographer John Caldwell, who worked in Nigeria and India, argued that the micro-approach of anthropology, watching how families actually decide, is needed to explain fertility change (§5.5).
- Small societies test the theories. Nancy Howell‘s Demography of the Dobe !Kung (1979) found Kalahari foraging women averaging 4–5 births, spaced by long breastfeeding, far below the biological maximum.
From 11a (summary): the total fertility rate (TFR) is the average number of children a woman would bear over her life at current rates; replacement level is a TFR of about 2.1; fecundity is the biological capacity to reproduce, and fertility is actual births. The factors acting on them are treated in 11a and 11.3.
1.3 Families of theory
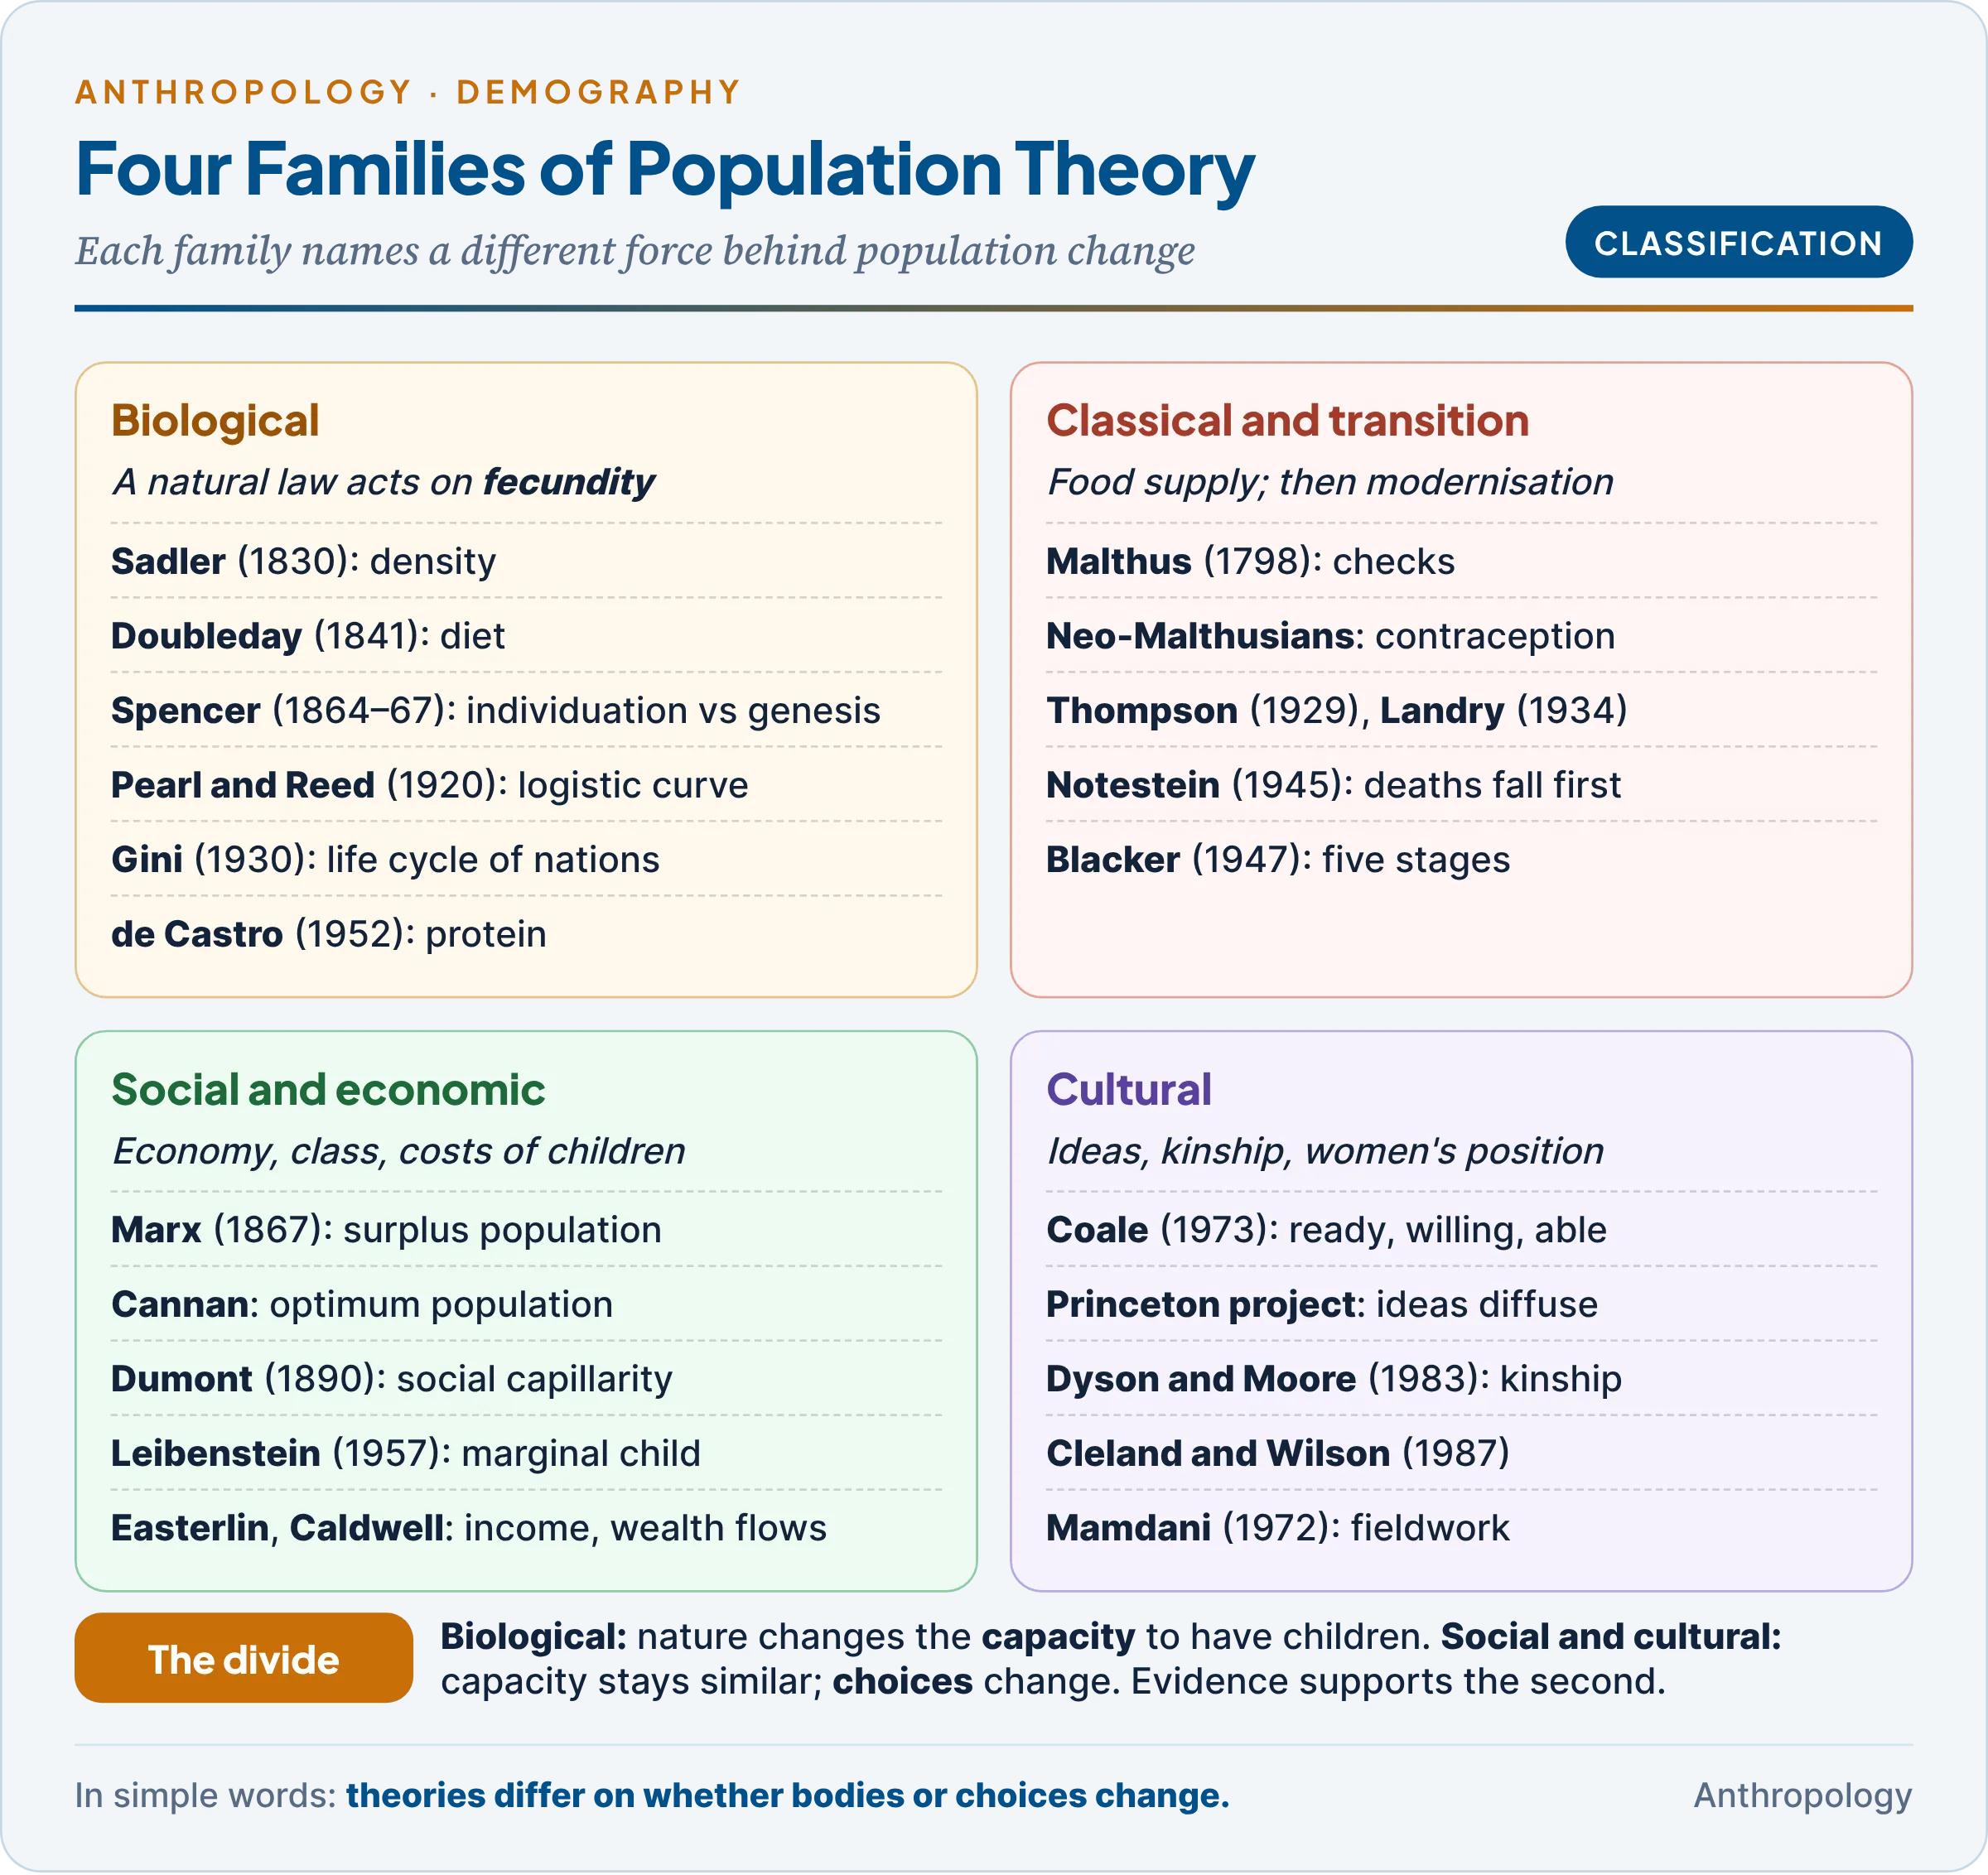
The theories differ in the force they treat as decisive: food supply, a natural law of the body, modernisation, the economy and class, or ideas and kinship. The deepest divide is between fecundity and fertility: biological theories claim nature changes people’s capacity to have children, while social and cultural theories claim capacity stays constant and choices change. The evidence favours the second view.
2. Malthus and the Neo-Malthusians
In simple words
Malthus warned that people multiply faster than food can be grown, so hunger, disease and war will always cut numbers back unless people marry late. Later thinkers kept his fear but accepted contraception as the remedy.
In 1968 the American biologist Paul Ehrlich‘s The Population Bomb predicted mass famines in the 1970s and doubted that India could feed its growing population. Within a decade the Green Revolution (high-yielding seeds, irrigation, fertiliser) made India self-sufficient in grain. The Malthusian fear had underestimated technology and people’s capacity to change behaviour.
2.1 The theory
Thomas Robert Malthus (1766–1834), an English clergyman and economist, published An Essay on the Principle of Population in 1798, enlarged in 1803.
- Two postulates: food is necessary for human existence, and the “passion between the sexes” is constant.
- Two ratios: unchecked, population grows geometrically (1, 2, 4, 8), doubling about every 25 years, while food grows arithmetically (1, 2, 3, 4), because new land is poorer (diminishing returns: each extra unit of labour on fixed land adds less output).
- Two kinds of check:
- Positive checks raise the death rate: famine, epidemic, war and misery.
- Preventive checks lower the birth rate: moral restraint (late marriage with chastity) and “vice” (his term for contraception and abortion, which he condemned).
- Conclusion: if preventive checks fail, positive checks will act. Poverty is a natural result of numbers, so poor relief only encourages more births.
Worked example. Starting with population and food both at 1 unit, at 25-year intervals:
| Years | 0 | 25 | 50 | 75 | 100 | 125 | 150 | 175 | 200 |
|---|---|---|---|---|---|---|---|---|---|
| Population (geometric) | 1 | 2 | 4 | 8 | 16 | 32 | 64 | 128 | 256 |
| Food (arithmetic) | 1 | 2 | 3 | 4 | 5 | 6 | 7 | 8 | 9 |
After two centuries people would outnumber food by 256 : 9. Malthus used this arithmetic to argue that the gap must close, and that nature closes it through the positive checks.

Common confusion
Are “positive checks” the good ones? No. “Positive” means they act directly on numbers by raising deaths (famine, disease, war). The preventive checks, which lower births through late marriage, are the ones Malthus hoped people would choose.
2.2 Criticism and legacy
- Technology broke the arithmetic. Output grew faster than population in Europe and later India. The Danish economist Ester Boserup (The Conditions of Agricultural Growth, 1965) reversed Malthus: population pressure drives farming to intensify (shorter fallows, irrigation, double-cropping).
- Fertility fell with prosperity. Malthus expected richer people to have more children; Europe after 1870 and Kerala after 1960 showed the opposite. The demographic transition (§4) is the empirical refutation.
- He merged two instincts: the biological drive for sex and the social desire for children. Contraception separates them, which he could not imagine.
- Distribution, not supply. Amartya Sen (Poverty and Famines, 1981) showed that the Bengal famine of 1943 occurred without a large fall in food availability: people starved because their entitlements (wages, purchasing power) collapsed.
- The ratios were illustrations, never measurements, and Marx rejected the theory as an apology for capitalism (§5.1).
- What survives: population, resources and environment must be studied together, and every environment has a carrying capacity (the largest population it can support).
2.3 Neo-Malthusianism
Neo-Malthusians keep Malthus’s fear of numbers but replace moral restraint with birth control.
- Francis Place urged contraception in 1822; the Malthusian League (1877) followed the trial of Annie Besant and Charles Bradlaugh for publishing a birth-control pamphlet.
- In the twentieth century the fear became global and ecological: Ehrlich (1968), Garrett Hardin‘s “The Tragedy of the Commons” (1968, on the overuse of shared resources) and the Club of Rome‘s The Limits to Growth (1972).
- India’s 1952 family-planning programme, the first national programme in the world, drew on this thinking, as did the coercive sterilisation drive of the Emergency (1975–77). Its backlash showed that fertility decline imposed from above, without changing people’s reasons for having children, fails.
3. Biological Theories of Population
In simple words
Some nineteenth- and early twentieth-century thinkers believed that nature regulates human numbers as it does animals: crowding, rich food or hard thinking would make people less able to have children. These ideas are rejected now, because birth rates change through people’s choices, not through changes in their bodies.
Nineteenth-century observers noticed that the poorest English families had the most children and the richest the fewest. Some concluded that the diet, comfort or crowding of the rich reduced their power to reproduce. Every biological theory starts here: a natural law acting on fecundity keeps numbers in check, so Malthus’s gloom is unnecessary.
3.1 Sadler: density and fecundity
- Michael Thomas Sadler (1780–1835), an English social reformer and critic of Malthus, wrote The Law of Population (1830).
- Claim: human fecundity is inversely proportional to density; as numbers rise it falls, and as they fall it recovers. Prolificness is also greater where mortality is greater.
- He blamed crowding (loss of privacy) and machines replacing labour.
- Criticism: he never separated fecundity from fertility, and densely settled India and Bangladesh kept high fertility for generations. Value: he answered Malthus with the idea of self-regulation.
3.2 Doubleday: the diet theory
- Thomas Doubleday (1790–1870), an English economist, argued in The True Law of Population (1841) that increase is inversely related to food supply.
- Three states: the over-fed plethoric rich, whose numbers decrease; the under-fed deplethoric poor, whose numbers increase fastest; and the adequately fed middle, which is stationary. He added that meat-eaters are less fertile than vegetarians.
- Criticism: Spencer replied that the fat, infertile cases Doubleday cited showed poor absorption, not good nutrition, and rich countries kept growing. The American demographers Warren Thompson and David Lewis concluded that no scientific basis exists for linking density, protein or calories to fecundity.
3.3 Spencer: individuation versus genesis
- Herbert Spencer (1820–1903), the English philosopher of social evolution, proposed in The Principles of Biology (1864–67) an antagonism between individuation (energy spent on developing oneself) and genesis (energy spent on producing young). Simple organisms multiply in millions; complex ones produce few.
- Applied to humans: as civilisation grows complex and people invest in mental development and personal advancement, reproductive power declines.
- Criticism: no evidence that educated people are biologically less fecund. Insight: he noticed, in biological language, the real link between education, aspiration and low fertility that Dumont (§5.3) and Caldwell (§5.5) later explained socially.
3.4 Pearl and Reed: the logistic curve
- The American biologist Raymond Pearl and biostatistician Lowell Reed (1920) revived the logistic curve of the Belgian mathematician Pierre-François Verhulst (1838); Pearl developed it in The Biology of Population Growth (1925).
- Evidence: fruit flies (Drosophila) in a bottle multiply slowly, then rapidly, then level off as crowding grows. Human populations in a given area and cultural epoch, Pearl argued, follow the same S-curve: P = K ÷ (1 + e^(a − bt)), with K the upper limit and fastest growth at the inflection point (P = K/2).
- Criticism: humans are not flies in a bottle; K shifts with technology and trade. Pearl and Reed’s 1920 ceiling for the United States, about 197 million, was passed in the late 1960s. Value: ecologists still use K as carrying capacity.
3.5 Gini: the cyclical theory
- Corrado Gini (1884–1965), the Italian statistician who devised the Gini coefficient, proposed (1930) that nations pass through a life cycle: youth, maturity and senescence.
- Claim: a young, simple society grows fast because each generation springs from its most prolific members. As it grows complex, the less prolific upper classes expand, and war and colonisation drain the young. Fertility falls because fecundity falls, through a weakening “reproductive instinct”; even rising lower-class families lose fertility as a phase of the cycle.
- Criticism: the mechanism is mystical and untestable, ignores contraception, and its talk of national decline suited the pronatalist policy of the Fascist regime under which Gini worked.
3.6 De Castro: protein and fertility
- Josué de Castro (1908–1973), a Brazilian physician and geographer, argued in The Geography of Hunger (1952) that a low-protein diet raises fertility. He cited rat-feeding experiments in which litters fell as dietary protein rose, and a negative correlation between protein intake and birth rates across countries.
- Political argument: hunger, and so high fertility, was the product of colonial and capitalist exploitation; feeding people properly would lower their birth rates.
- Criticism: the physiology is unproven, and protein-poor Kerala reached low fertility through schooling, not diet. Value: he made hunger a political question, as Sen later did.
3.7 Evaluation
| Scholar | Regulating force | Main flaw |
|---|---|---|
| Sadler (1830) | Density lowers fecundity | Dense India stayed fertile |
| Doubleday (1841) | Over-feeding lowers fecundity | Rich countries kept growing |
| Spencer (1864–67) | Individuation reduces genesis | No proof the educated are less fecund |
| Pearl and Reed (1920) | Crowding in fixed space | Humans shift their limit |
| Gini (1930) | Life cycle of nations | Mystical, untestable |
| De Castro (1952) | Low protein raises fertility | Physiology unproven |
All six explain changes in fertility by imagined changes in fecundity. Fecundity varies little between populations, while fertility varies hugely through marriage, contraception, breastfeeding and abortion, so demography moved to social and cultural explanations.
4. The Demographic Transition Theory
In simple words
Every country that has modernised has gone through the same change: first many births and many deaths, then fewer deaths while births stay high (so the population shoots up), and finally fewer births too. The theory describes this change and explains why deaths fall before births.
India’s census record traces the curve. Between 1891 and 1921 population barely moved, from 236 to 251 million, because famine, plague and the 1918 influenza kept deaths almost as high as births. 1921 is called the “year of the great divide”: after it, death rates fell steadily while birth rates stayed near 45. Growth accelerated, exploded after 1951 (361 million in 1951, 683 million by 1981) and then slowed. By 2023 the birth rate was 18.4, the death rate 6.4 and the TFR 1.9 (SRS 2023).
4.1 Origin
- Warren Thompson (1929) grouped countries into three types by birth and death rates.
- The French demographer Adolphe Landry (La Révolution démographique, 1934) described primitive, intermediate and modern regimes, ending with fertility controlled within marriage.
- Frank Notestein (1945), of Princeton’s Office of Population Research, gave the theory its name and form: mortality declines first with development, fertility later.
- The British demographer C. P. Blacker (1947) proposed the five-stage version.
4.2 The stages
| Stage (Blacker) | Birth rate | Death rate | Growth | Example |
|---|---|---|---|---|
| 1. High stationary | High (40–50) | High, fluctuating | Slow | India before 1921 |
| 2. Early expanding | High | Falling fast | Rapid | India 1921–1971 |
| 3. Late expanding | Falling | Low | Slowing | India 1971–2015 |
| 4. Low stationary | Low | Low | Near zero | Western Europe; Kerala, Tamil Nadu |
| 5. Declining | Below death rate | Low, rising with ageing | Negative | Japan, South Korea, Italy |
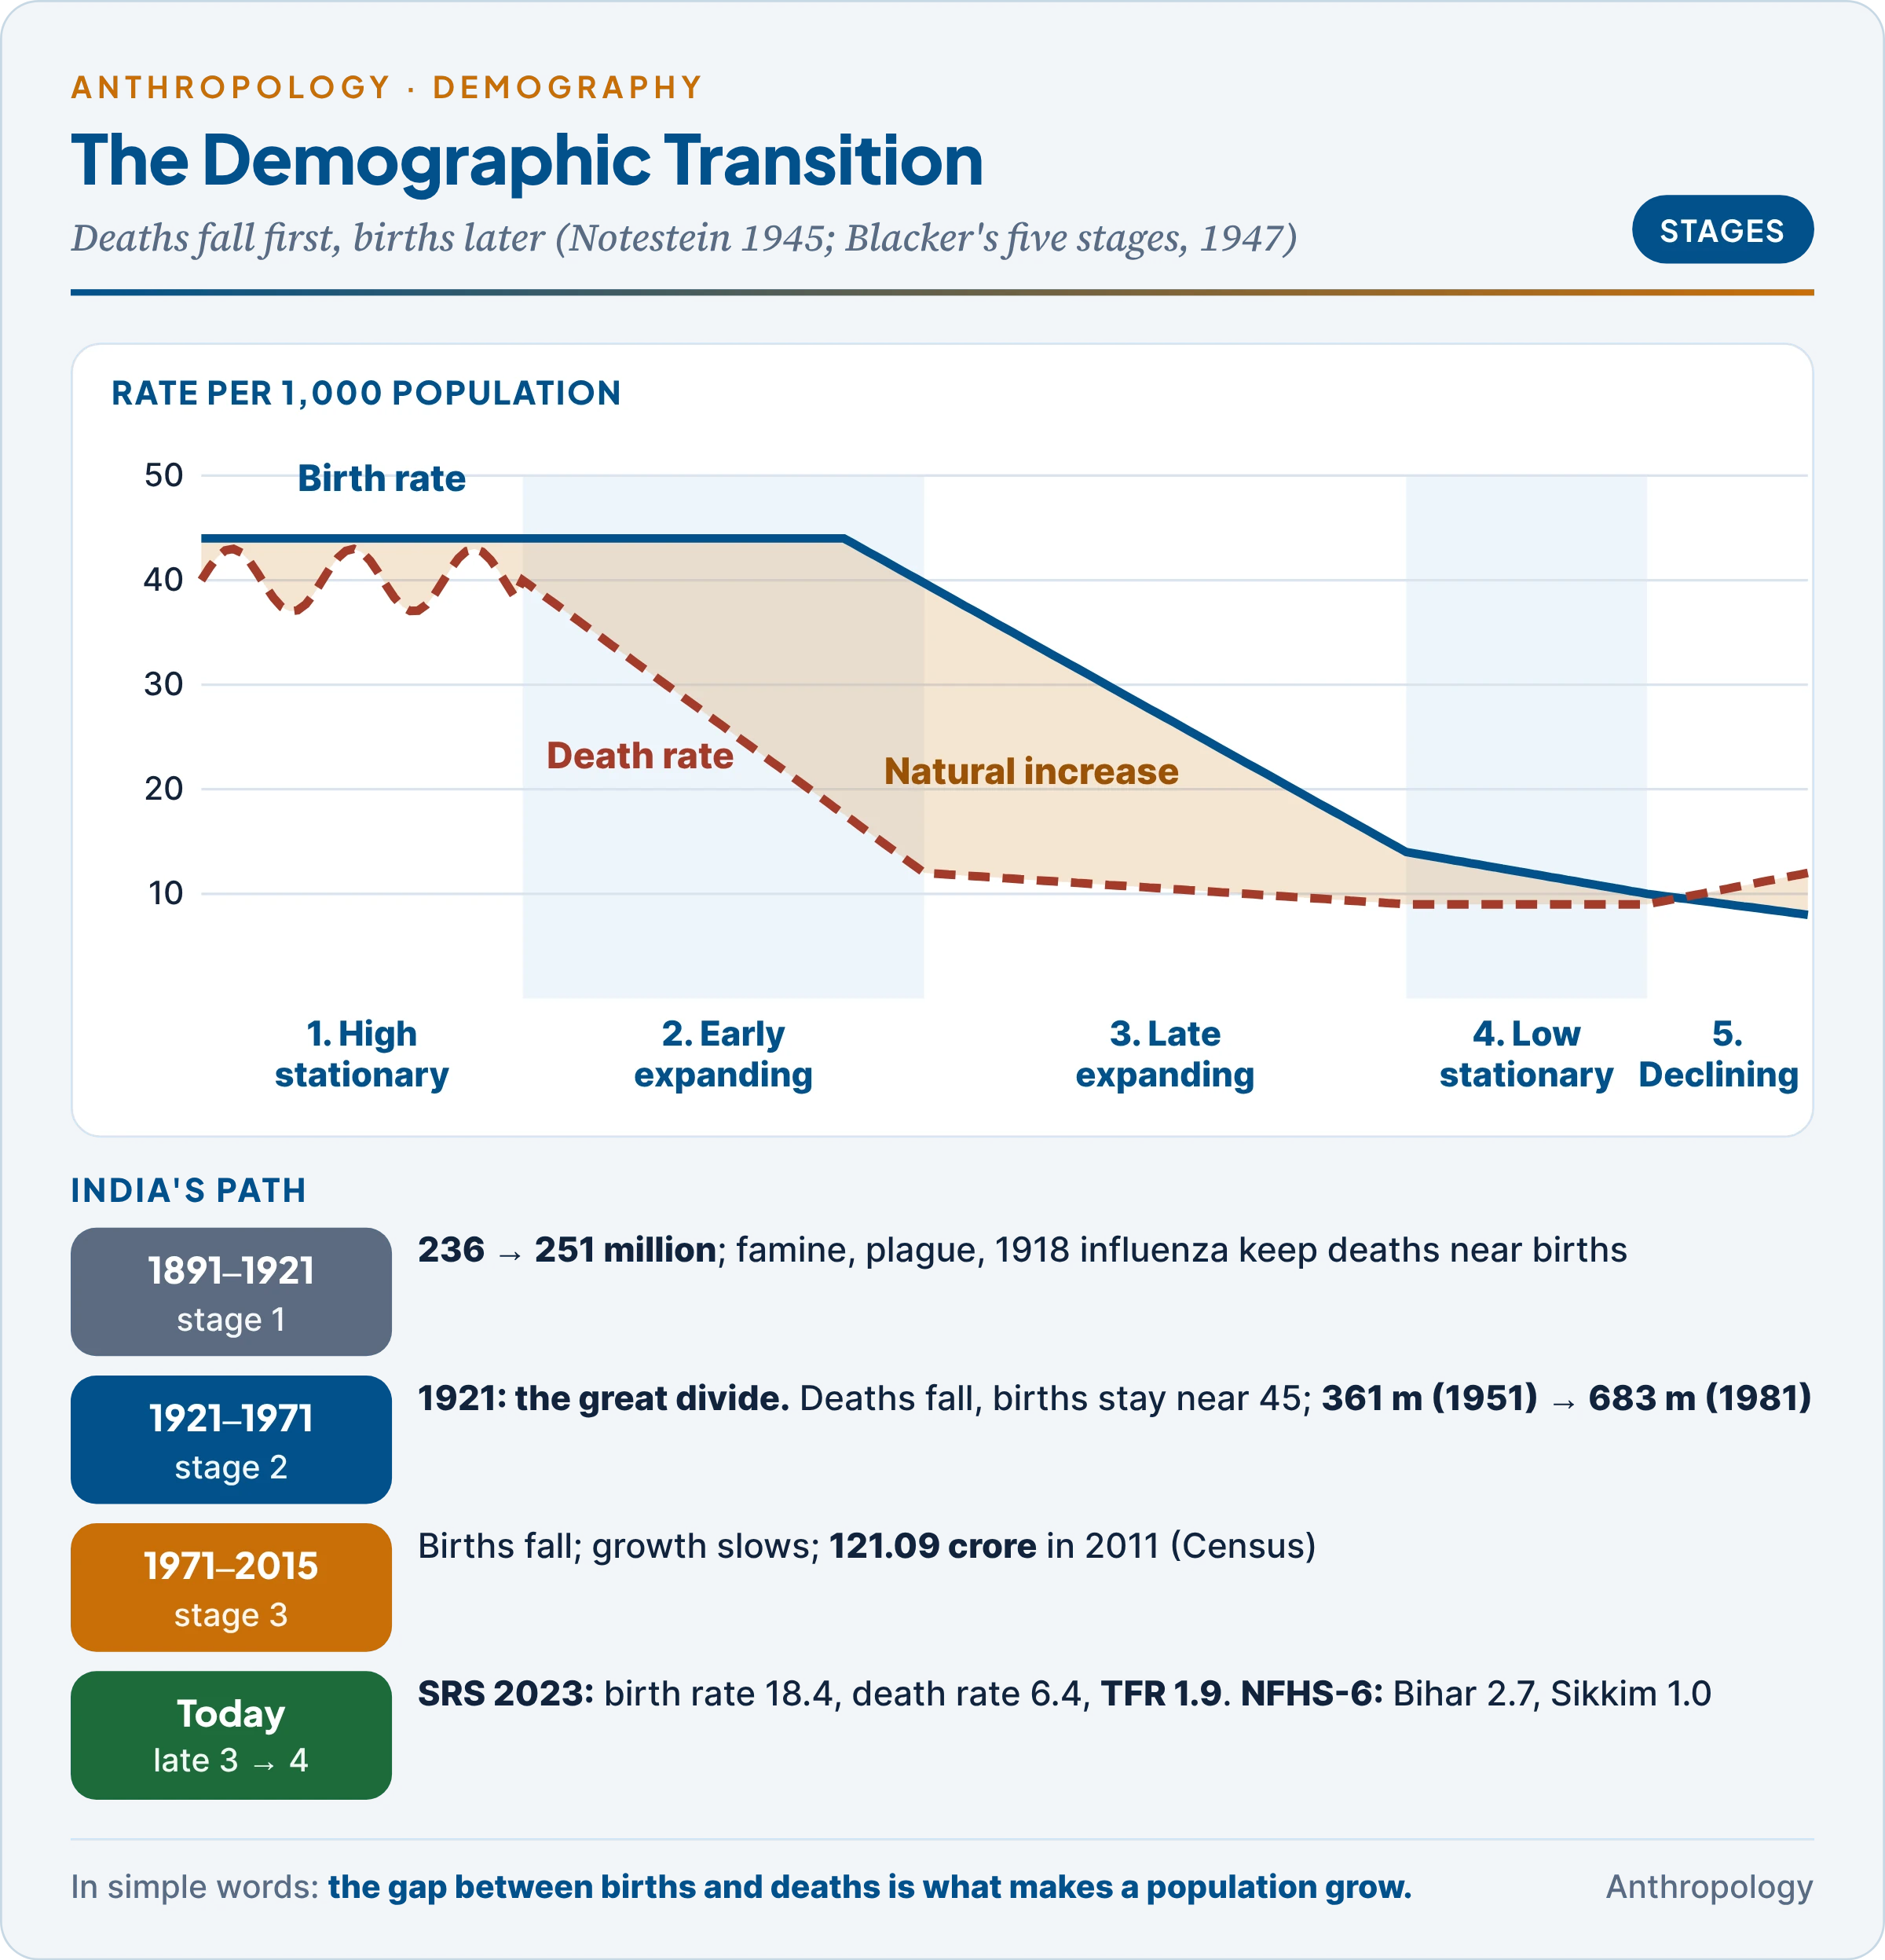
Growth depends on the gap between the two curves, which is widest in stage 2; that is why the poorest countries grew fastest in the twentieth century.
4.3 Why deaths fall before births
- Death-reducing causes are exogenous (from outside the community): vaccines, sanitation and famine relief can be introduced by governments and are welcomed by all.
- Birth-reducing causes are endogenous (inside the culture): the number of children people want depends on marriage age, kinship duties, children’s labour, old-age security and religion, which change over a generation or more.
- The lag causes the explosion. In an agrarian society children work early and support parents in old age, and high infant mortality means many births for a few survivors. With urbanisation, schooling, women’s work outside the home and falling infant mortality, children become costly and the small family becomes rational.
4.4 India’s position
- TFR 2.0 in both NFHS-5 (2019–21) and NFHS-6 (2023–24); 1.9 in SRS 2023. India is in late stage 3, entering stage 4: births still exceed deaths (natural growth 12.0 per 1,000 in 2023), but fertility is at replacement.
- Population momentum (continued growth because many young people are entering child-bearing ages) will keep numbers rising for some decades. India became the world’s most populous country in 2023 (United Nations).
- Regions are at different stages: in NFHS-6, Bihar (2.7), Uttar Pradesh, Jharkhand and Meghalaya (2.2) remain above replacement, while Sikkim (1.0), Punjab, West Bengal, Tamil Nadu and Kerala are at stage 4 levels.
- Ansley Coale and Edgar Hoover (1958) used India as their case to argue that rapid growth diverts savings from investment, an argument that shaped early family planning.
4.5 Criticism
- Description, not explanation. The theory does not say which factor (income, schooling, urbanisation, infant survival) triggers the fall of fertility, or at what threshold, so it cannot predict.
- The Princeton European Fertility Project (led by Ansley Coale, 1963–86) found that European fertility fell at very different levels of development: France began in the late eighteenth century, before industrialisation. Decline spread along linguistic and cultural regions, suggesting that ideas diffused (§6.2).
- Developing countries differ: imported medicine cut mortality much faster than in Europe, so the explosion was bigger, and Kerala and Bangladesh reached low fertility at low income. The post-war baby boom also contradicted steady decline.
- Stage 4 is not the end. The second demographic transition (Ron Lesthaeghe and Dirk van de Kaa, 1986) describes late marriage, cohabitation and sub-replacement fertility driven by values of self-fulfilment; South Korea‘s TFR fell to 0.72 in 2023.
Common confusion
Is the “Neolithic demographic transition” the same thing? No, it runs the opposite way. The Neolithic demographic transition, an archaeological term, describes how farming and settled villages about 10,000 years ago raised birth rates through shorter birth spacing. The modern transition describes industrial societies lowering first deaths and then births.
5. Social and Economic Theories
In simple words
These theories say that people’s numbers follow their economic and social situation. When children help the family earn and support parents in old age, people have many; when children cost money and parents hope to rise in society, people have few.
An urban Indian couple today often stops at one or two children and spends heavily on their schooling, while their grandparents in a village may have had six. Nothing changed in their bodies; what changed is what a child costs, what a child returns and what the parents hope for. Each theory below explains part of that change.
5.1 Marx: relative surplus population
- Karl Marx (1818–1883) denied any universal law of population. In Capital (Vol. I, 1867) he wrote that every historical mode of production has its own law of population.
- Under capitalism, machinery and the accumulation of capital make part of the working class “relatively superfluous”: a relative surplus population or industrial reserve army of the unemployed, which keeps wages low. Over-population is relative to the needs of capital, not to food, and poverty is caused by the system, not by numbers.
- Criticism: socialist states also had to manage fertility; communist China adopted the strictest control of all, the one-child policy (1980), and fertility differences persisted in classless societies. Value: “over-population” is partly a social definition tied to employment and distribution. Henry George (Progress and Poverty, 1879) likewise blamed want on land monopoly.
5.2 Optimum population theory
- Associated with the British economist Edwin Cannan, it asks not “Is there enough food?” but “What population gives the highest income per head?“
- Logic: with given land, capital and technology, more workers at first raise output per head (division of labour, fuller use of resources); beyond a point diminishing returns cut it. The size at which per-capita income is maximum is the optimum; below it a country is under-populated, above it over-populated.
- Hugh Dalton‘s measure of maladjustment: M = (A − O) ÷ O, where A is actual and O optimum population. Worked example: A = 140 million, O = 100 million gives M = +0.4 (40 per cent over-populated); A = 80 million gives M = −0.2 (20 per cent under-populated).
- Criticism: the optimum cannot be measured and shifts with every change in technology or trade; per-capita income ignores distribution. Value: it replaced Malthus’s absolute limit with a relative, dynamic idea of over-population.
- Related positions: Frank Fetter‘s voluntarism (fertility follows will and conditions, not food), Francesco Nitti‘s principle of individuality (births fall as individuality and democracy grow) and Lujo Brentano‘s prosperity theory (prosperity brings competing pleasures) all treat falling fertility as a response to rising living standards, the opposite of Malthus’s expectation.
5.3 Dumont: social capillarity
- Arsène Dumont (1849–1902), a French demographer, explained France’s early fertility decline in Dépopulation et civilisation (1890).
- The analogy: as liquid rises in a thin tube by capillary action, individuals in an open society try to rise socially; and as the column must be thin to rise, a family must be small to rise.
- Prediction: fertility falls fastest where mobility is open (cities, democracies, the middle classes) and stays high where society is rigid (he cited caste) or far from opportunity. Unlike Spencer, he made the cause social and openly approved of contraception.
- Criticism: many successful people have large families, and urban fertility in India is lower partly because migrants leave families in villages. Value: parents investing in fewer, upwardly mobile children foreshadows the quality–quantity trade-off.
5.4 Leibenstein and Easterlin
Harvey Leibenstein (American economist, Economic Backwardness and Economic Growth, 1957) analysed the decision to have one more child, the marginal child.
- Utilities: consumption (the pleasure of a child), productive (labour and earnings) and security (support in old age).
- Costs: direct (food, schooling, health) and opportunity (the mother’s lost earnings, parents’ time).
- Mechanism: as income rises, productive and security utilities fall (child labour declines, pensions appear) and costs rise (longer schooling, higher wages forgone), so the marginal child stops being worth it. Gary Becker (1960) added that richer parents prefer quality over quantity.
Richard Easterlin (American economist, Birth and Fortune, 1980) proposed the relative income hypothesis.
- Young adults compare their earning power with the aspirations formed in their parents’ home: high relative income brings early marriage and more children, low relative income fewer.
- The US baby boom fits: the small 1930s cohort, with modest Depression-era aspirations, met a booming post-war labour market and had many children; their large cohort later faced crowded markets and had few. Easterlin predicted fertility cycles; with Eileen Crimmins (1985) he later added the costs of fertility regulation to supply and demand.
5.5 Caldwell: the wealth-flows theory
John C. Caldwell (“Toward a Restatement of Demographic Transition Theory”, 1976; Theory of Fertility Decline, 1982) built his theory from fieldwork among the Yoruba of Nigeria and later in Karnataka villages.
- The key variable is the direction of the “wealth flow”: money, goods, labour, services and security passing between generations over a lifetime.
- In familial societies wealth flows upward, from children to parents: children work from an early age, care for siblings and support parents in old age. High fertility is then economically rational, not ignorant.
- In modern societies the flow reverses: parents spend on children’s schooling, health and marriage and get little back, so fertility falls.
- What reverses the flow is cultural as much as economic: mass schooling (children leave work and learn new values), the emotional nucleation of the family (husband–wife and parent–child bonds strengthening against the wider kin) and Western ideas of childhood. Caldwell, P. H. Reddy and Pat Caldwell‘s Karnataka study (The Causes of Demographic Change, 1988) found schooling and changing marriage costs lowering fertility even without large income gains.
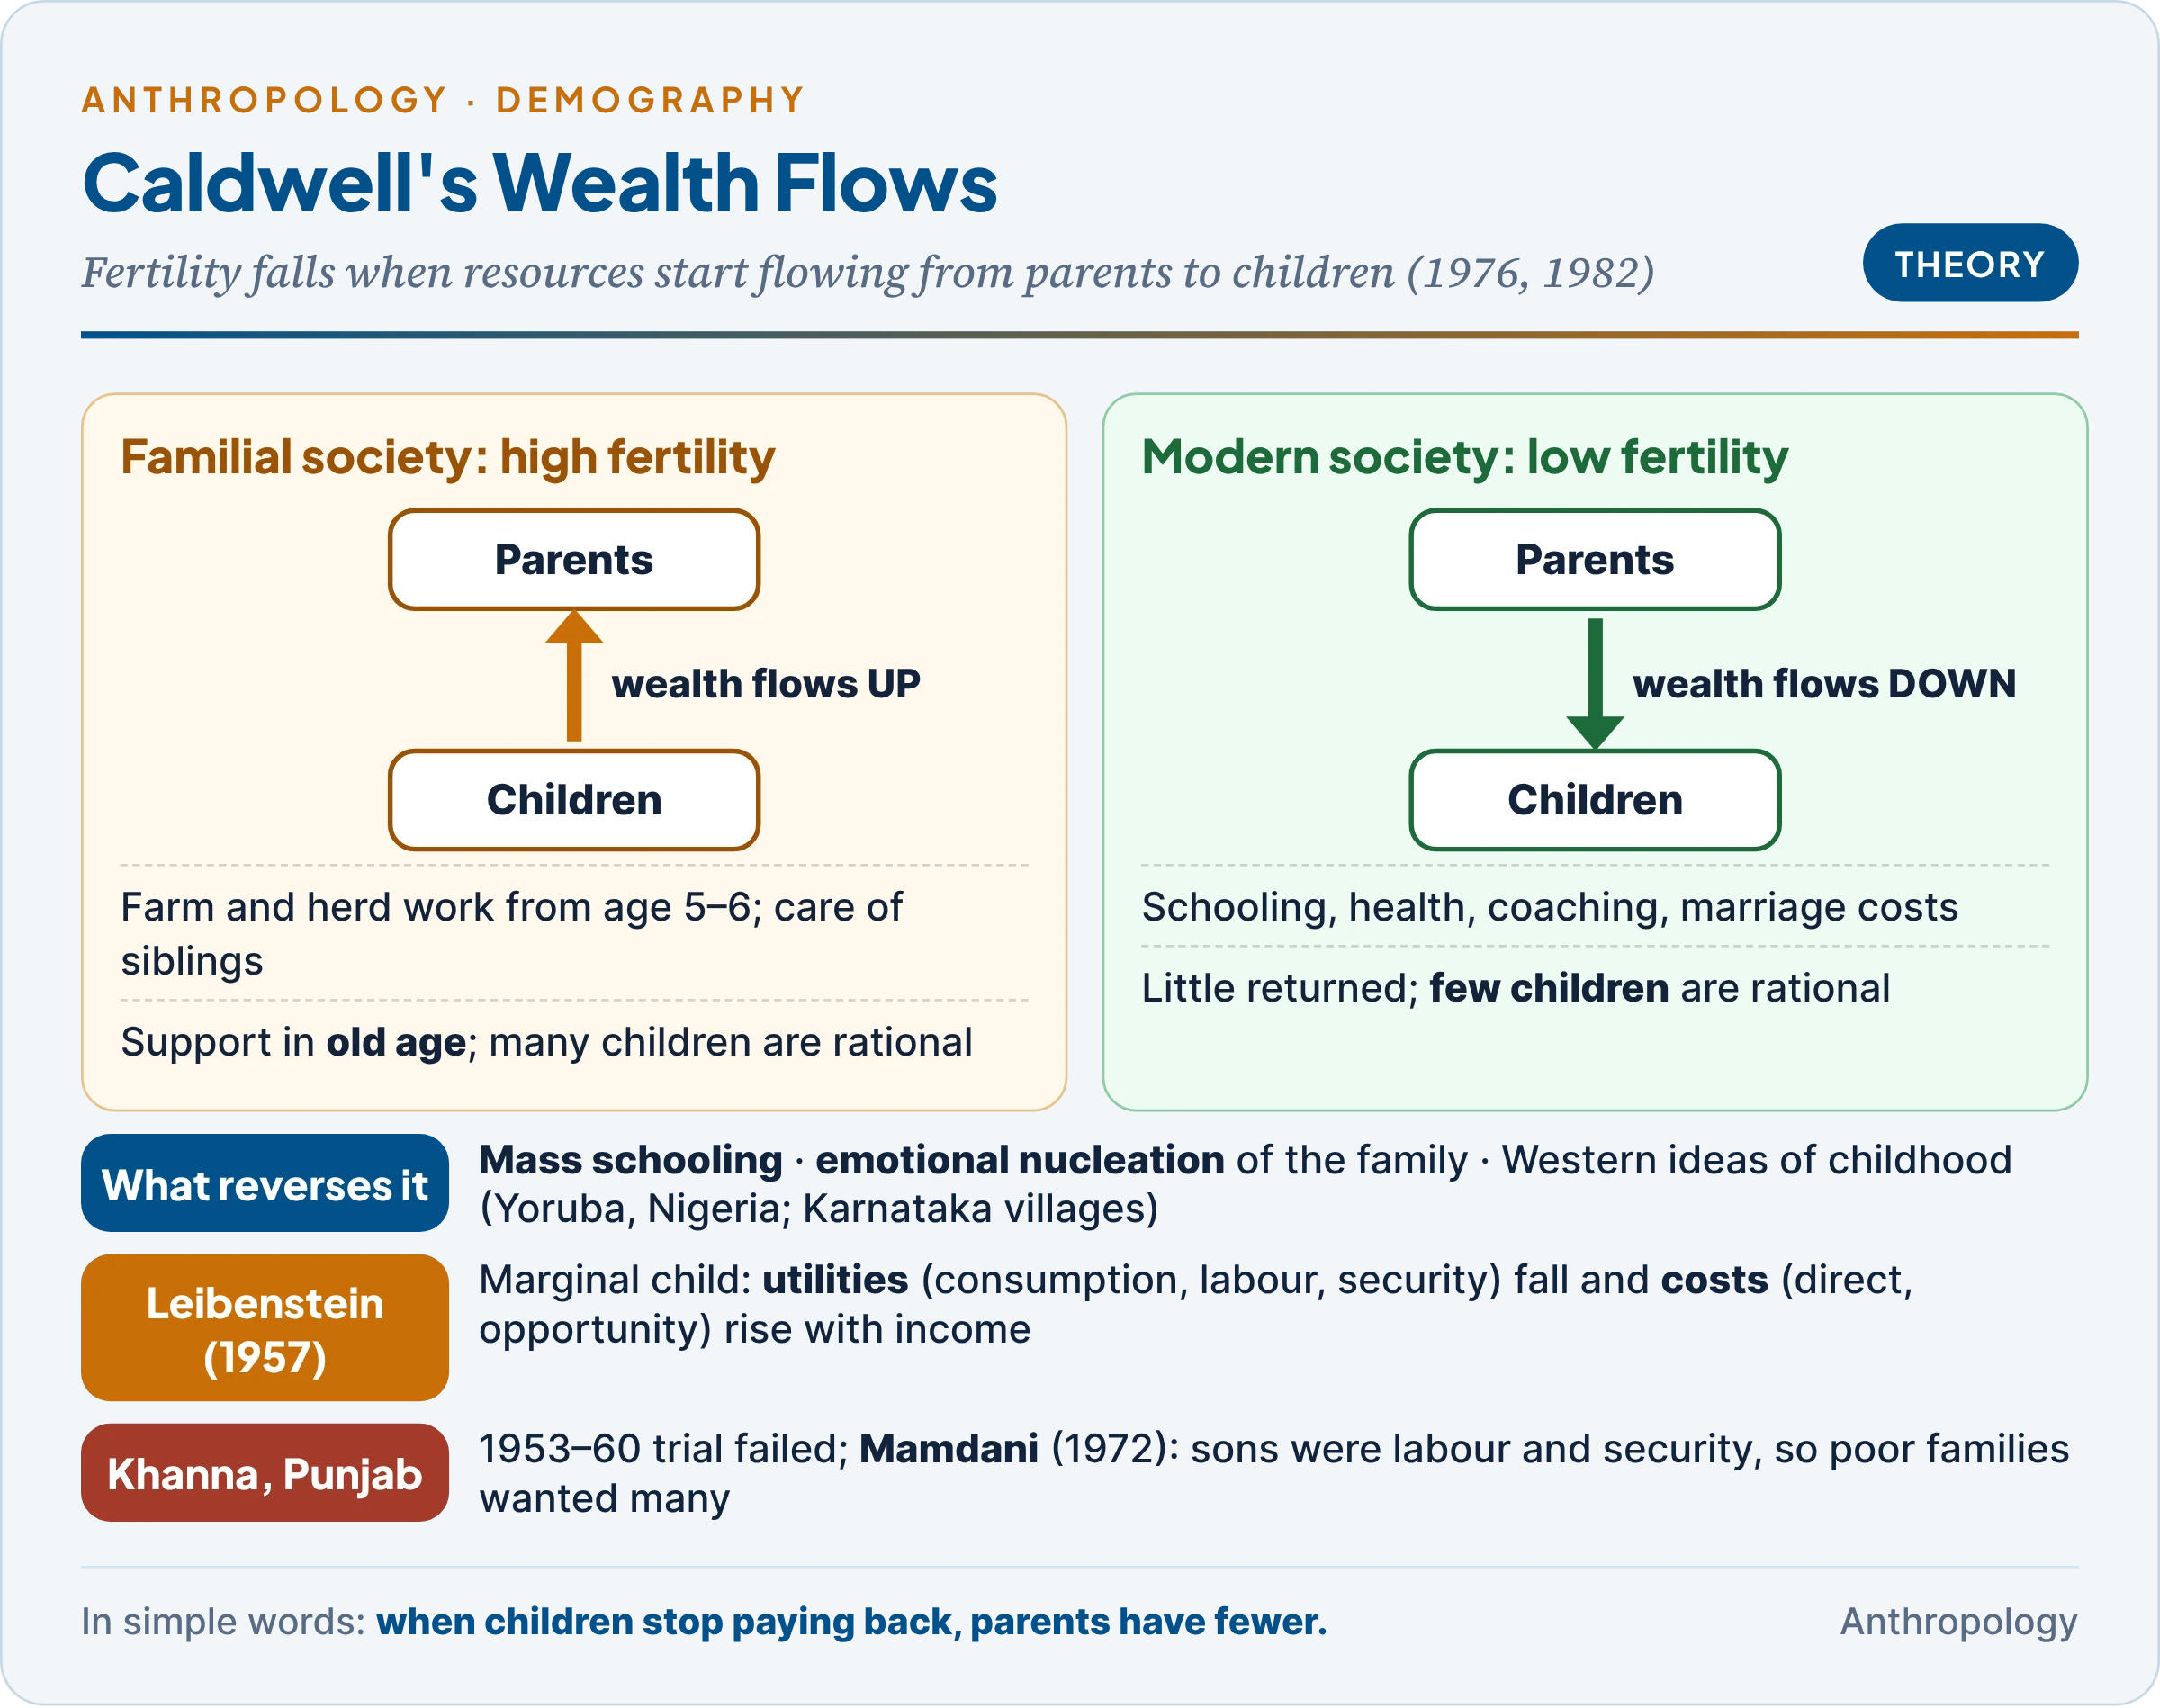
The Khanna study and its critic. The Khanna Study (1953–60), a Harvard-led contraceptive trial in villages of Ludhiana, Punjab, distributed contraceptives but produced almost no fall in births. The Ugandan scholar of Indian origin Mahmood Mamdani revisited one village, Manupur, and showed in The Myth of Population Control (1972) that for small farmers and labourers sons were labour and security: families were not poor because they had many children; they had many children because they were poor. This is Leibenstein’s and Caldwell’s argument proved by fieldwork.
6. Cultural Theories and Anthropological Demography
In simple words
Cultural theories say that people have few children when new ideas reach them: that it is right and possible to plan a family, that a daughter’s schooling matters, that a small family is a good family. Kinship, women’s status and religion shape how fast these ideas spread.
6.1 Kinship and female autonomy: north and south India
The British demographer Tim Dyson and the anthropologist Mick Moore (“On Kinship Structure, Female Autonomy, and Demographic Behavior in India”, 1983) asked why south India had lower fertility and infant mortality than the north before it was richer.
- North Indian kinship (as described by Irawati Karve): village exogamy and hypergamy send brides to distant strangers; a young wife has little contact with her natal kin, low autonomy (control over her movement, earnings and decisions) and must prove herself by bearing sons.
- South Indian (Dravidian) kinship: cross-cousin and close-kin marriage keep a woman near her natal kin; women have more autonomy, use clinics readily and adopt contraception sooner.
- Result: the same income produces different demographic outcomes because kinship structures women’s position, a purely cultural explanation.
6.2 Coale’s three conditions and the diffusion of ideas
- From the Princeton findings, Coale (1973) concluded that sustained fertility decline needs three preconditions, summarised as “ready, willing and able”:
- Ready: lower fertility must be advantageous (the economic calculus of §5.4).
- Willing: fertility must be within the calculus of conscious choice, culturally and morally acceptable to control.
- Able: effective techniques of control must be available.
- All three must hold: a village that is “ready” but not “willing” or not “able” keeps high fertility.
- Ideational theory: John Cleland and Christopher Wilson (1987) argued that decline is driven more by the diffusion of new ideas about family and contraception, through language, religion, schooling and media, than by economic change.
6.3 Natural fertility and proximate determinants (summary)
- Louis Henry (1961) defined natural fertility as fertility without deliberate stopping after a desired number. The Hutterites, a North American religious farming community with almost ten children per woman in the 1950s, are its standard benchmark.
- Kingsley Davis and Judith Blake (1956) and John Bongaarts (1978) showed that culture affects fertility only through proximate determinants: the proportion married, contraception, abortion and post-partum infecundability (mainly breastfeeding). They are treated in 11a and 11.3; they are the channels through which every social and cultural theory must work.
6.4 Cultural factors in India
- Son preference keeps couples having children until a son is born and has distorted the sex ratio at birth.
- Education: women with no schooling have about one child more than women with twelve or more years (NFHS-5), because schooling raises marriage age, autonomy and investment in each child.
- Religion: fertility gaps between communities have narrowed in every NFHS round, because they follow education and income, not doctrine.
- Decline, too, is cultural: small isolated tribes such as the Onge and Great Andamanese shrank after contact through new diseases and low fertility.
| Lens | Explains best | Weakness |
|---|---|---|
| Biological | Historical interest only | Confuses fecundity with fertility |
| Transition | The broad sequence in every modernising country | Does not say what triggers the fall |
| Economic | Why children become costly; fertility cycles | Underplays norms and kinship |
| Cultural | Diffusion, regional patterns, women’s position | Can underplay material constraints |
Most demographers now combine the lenses: economic change makes small families advantageous, and cultural change makes them thinkable. Caldwell’s theory and Coale’s three conditions are the clearest syntheses.
7. Population Policy, Demographic Dividend and Ageing in India
In simple words
India began planning its population in 1952, moved from targets and coercion to choice and health, and has now reached replacement fertility. The new questions are how to use a large working-age population while it lasts, and how to care for a fast-growing number of elderly people.
In 1994 Andhra Pradesh barred anyone with more than two children from contesting local elections. In November 2024 the same state, with a TFR of 1.7, repealed the rule, and its chief minister urged families to have more children because the state was ageing. Within one generation the policy problem had reversed.
7.1 Policy chronology
| Year | Step | Significance |
|---|---|---|
| 1952 | National family-planning programme | First in the world; later target-based |
| 1976 | National Population Policy; Lok Sabha seats frozen on the 1971 Census (42nd Amendment) | Freeze extended to the first census after 2026 (84th Amendment, 2001) |
| 1975–77 | Emergency sterilisation drive | Backlash; renamed Family Welfare (1977) |
| 1994–96 | Cairo ICPD; Target-Free Approach (1996) | From targets to reproductive rights |
| 2000 | National Population Policy 2000 | Meet unmet need; replacement TFR by 2010; stable population by 2045 |
| 2016 | Mission Parivar Vikas | High-fertility districts; now 13 states |
India moved from the neo-Malthusian logic of targets to Caldwell’s and Coale’s lesson: fertility falls when health, schooling and women’s choices improve.
7.2 Key data
| Indicator | Value | Source |
|---|---|---|
| Population; decadal growth | 121.09 crore; 17.7% | Census 2011 |
| Birth rate / death rate / IMR | 18.4 / 6.4 / 25 | SRS 2023 |
| TFR | 1.9 (SRS 2023); 2.0 (NFHS-5, NFHS-6) | SRS; NFHS |
| Highest / lowest TFR | Bihar 2.7 / Sikkim 1.0 | NFHS-6 |
| Aged 60 and over | 12.9% (11.8% in NFHS-5) | NFHS-6 |
| Elderly share projected | 10.5% (2022) → 20.8% (2050) | India Ageing Report 2023 |
7.3 The demographic dividend
- Meaning: the demographic dividend is the growth possible when the working-age share (15–64) is high and the dependency ratio (dependants per worker) low, as in late stage 3.
- Mechanism: fewer dependants per worker allow more savings, more women in paid work and more spending per child, as in East Asia from the 1960s.
- It is a window, not a gift. The UN Population Fund expects India’s window to close around the mid-2050s. Without jobs, skills, health and women’s participation, a young population becomes Marx’s reserve army instead.
- Regional mismatch: the dividend is ending in the south while still arriving in Bihar and Uttar Pradesh, which feeds the post-2026 delimitation debate.
7.4 Ageing
- Cause: falling fertility shrinks the base of the age pyramid and longer life enlarges the top; India may grow old before it grows rich.
- Features: feminisation of old age (more widows), chronic disease and weaker family care as children migrate. Responses include the Maintenance and Welfare of Parents and Senior Citizens Act (2007) and PM-JAY health cover for everyone aged 70 and above (October 2024).
7.5 Contemporary population problems through the theories
| Problem | Most useful lens | Why |
|---|---|---|
| Water and land stress | Neo-Malthusian, carrying capacity | Numbers and consumption press on finite resources |
| Jobless young adults | Marx‘s reserve army; the dividend | Surplus is relative to demand for labour |
| North–south fertility gap | Transition stages; Dyson and Moore | Different stages, shaped by kinship and autonomy |
| Son preference, skewed sex ratio | Cultural theory | Norms of lineage and inheritance |
| Ageing south | Second demographic transition | Late marriage, small-family values |
| Small urban middle-class families | Dumont, Leibenstein | Mobility aspirations; costly children |
| High fertility among the poorest | Caldwell, Mamdani | Children still bring labour and security |
Together the theories show that India’s population problems are problems of distribution, opportunity and women’s status, not of numbers alone.
Key Terms
| Term | Meaning in simple words |
|---|---|
| Demography | The study of population size and how births, deaths and migration change it |
| Fecundity / fertility | The biological ability to have children / the actual number of births |
| Replacement level | A TFR of about 2.1, at which each generation just replaces itself |
| Positive / preventive check | Malthus’s forces raising deaths / lowering births |
| Neo-Malthusianism | Malthus’s fear of numbers combined with support for birth control |
| Demographic transition | The shift from high births and deaths to low births and deaths |
| Optimum population | The population size giving the highest income per head |
| Relative surplus population | Marx’s term for workers made unnecessary by capitalist production |
| Social capillarity | Dumont’s idea that small families help people climb socially |
| Marginal child | Leibenstein’s “one more child”, weighed by its benefits and costs |
| Relative income hypothesis | Easterlin’s idea that fertility depends on earnings compared with aspirations |
| Wealth flow | Caldwell’s term for the direction in which resources pass between generations |
| Natural fertility | Fertility without deliberate stopping after a chosen number of children |
| Demographic dividend | Growth made possible when the working-age share is high |
| Second demographic transition | The move to below-replacement fertility driven by individualistic values |
Contemporary Developments
- NFHS-6 (2023–24), released 29 May 2026: TFR stays at 2.0; contraceptive use rose from 66.7 to 69.1 per cent.
- SRS 2023 (September 2025): TFR fell to 1.9, infant mortality to 25.
- Census 2027: the first digital census, with caste enumeration, reference date 1 March 2027 (1 October 2026 for snow-bound areas).
- Pronatalist turn: Andhra Pradesh repealed its two-child rule for local elections in November 2024.
- India Ageing Report 2023: the elderly share will double to 20.8 per cent by 2050.
Diagrams to Master
- Topic map: the seven sections, Malthus to India.
- Families of theory: four columns with scholars; the fecundity vs fertility divide.
- Malthus’s principle: geometric vs arithmetic curves; positive and preventive checks.
- Demographic transition: birth and death curves, five stages, shaded natural increase; India’s 1921, 1951–81 and 2023 points.
- Wealth flows: upward flow reversed downward by mass schooling; the Khanna–Mamdani case.
Revision Grid
| Scholar | Work (year) | Key idea |
|---|---|---|
| T. R. Malthus | An Essay on the Principle of Population (1798) | Geometric vs arithmetic growth; positive and preventive checks |
| M. T. Sadler | The Law of Population (1830) | Fecundity falls with density |
| Herbert Spencer | The Principles of Biology (1864–67) | Individuation versus genesis |
| Karl Marx | Capital, Vol. I (1867) | Relative surplus population |
| Arsène Dumont | Dépopulation et civilisation (1890) | Social capillarity |
| Frank Notestein | “Population: The Long View” (1945) | Classic demographic transition |
| Josué de Castro | The Geography of Hunger (1952) | Low protein raises fertility |
| Harvey Leibenstein | Economic Backwardness and Economic Growth (1957) | The marginal child |
| Mahmood Mamdani | The Myth of Population Control (1972) | Children as labour and security |
| Ansley Coale | Princeton project; three preconditions (1973) | Ready, willing and able |
| John Caldwell | Theory of Fertility Decline (1982) | Reversal of wealth flows |
| Richard Easterlin | Birth and Fortune (1980) | Relative income hypothesis |
| Dyson and Moore | Kinship and female autonomy (1983) | North–south contrast through kinship |
Previous Year Questions
Unit 11.2: Demographic theories: biological, social and cultural
- 2022Discuss the contemporary population problems in the light of various socio-cultural demographic theories.
- 2018Do Allen’s rule and Bergmann’s rule hold for human populations ? Explain with examples.
- 2013Write a note in 150 words on Demographic transition.
- 2007Write a note on Demographic Transition.
- 1999Discuss the different theories which explain social and cultural changes.
- 1994Discuss the racial classification of Indian population as per B.S. Guha. Mention the criticism propounded by other anthropologists.
- 1986Give a brief account of classification of Indian population as suggested by B.S. Guha, Critically examine his classification.
The Guha questions are treated in 9.5 (race), and the question on Allen’s and Bergmann’s rules in 9.7 (ecological anthropology).
Related questions from other units
- 2026Unit 11.3: What do you understand by fertility and mortality? How are these influenced by biological and socio-ecological factors?
- 2021Unit 11.3: Discuss the bio-social determinants of fertility and fecundity.
- 2020Unit 9.8: Critically examine the demographic and epidemiological consequences with rise in food production and sedentism.
- 2019Unit 11.3: Discuss the bio-cultural factors influencing fertility in light of the relationship between fecundity and fertility.
- 2018Unit 11.3: Define fecundity and explain major factors affecting fecundity in Indian populations.
- 2017Unit 11.3: Describe the biological and socio- ecological factors affecting fertility and mortality.
- 2014Unit 11.1: Discuss the relevance of menarche, menopause and other bio-events to fertility.
- 2013Unit 9.8: What is meant by epidemiological transition? Elaborate upon its causes and consequences highlighting major health problems of our adult population today. (250 words).
- 2010Unit 11.3: Distinguish between the terms ‘fecundity’ and ‘fertility’. Are the factors influencing them distinguishable? Discuss.
- 2010Unit 10: Write a note in 150 words on Senescence and socio-economics in contemporary times.