

11.1 Relevance of menarche, menopause and other bioevents to fertility. Fertility patterns and differentials. 11.3 Biological and socio-ecological factors influencing fecundity, fertility, natality and mortality.
Official Syllabus: Paper I, Units 11.1 and 11.3
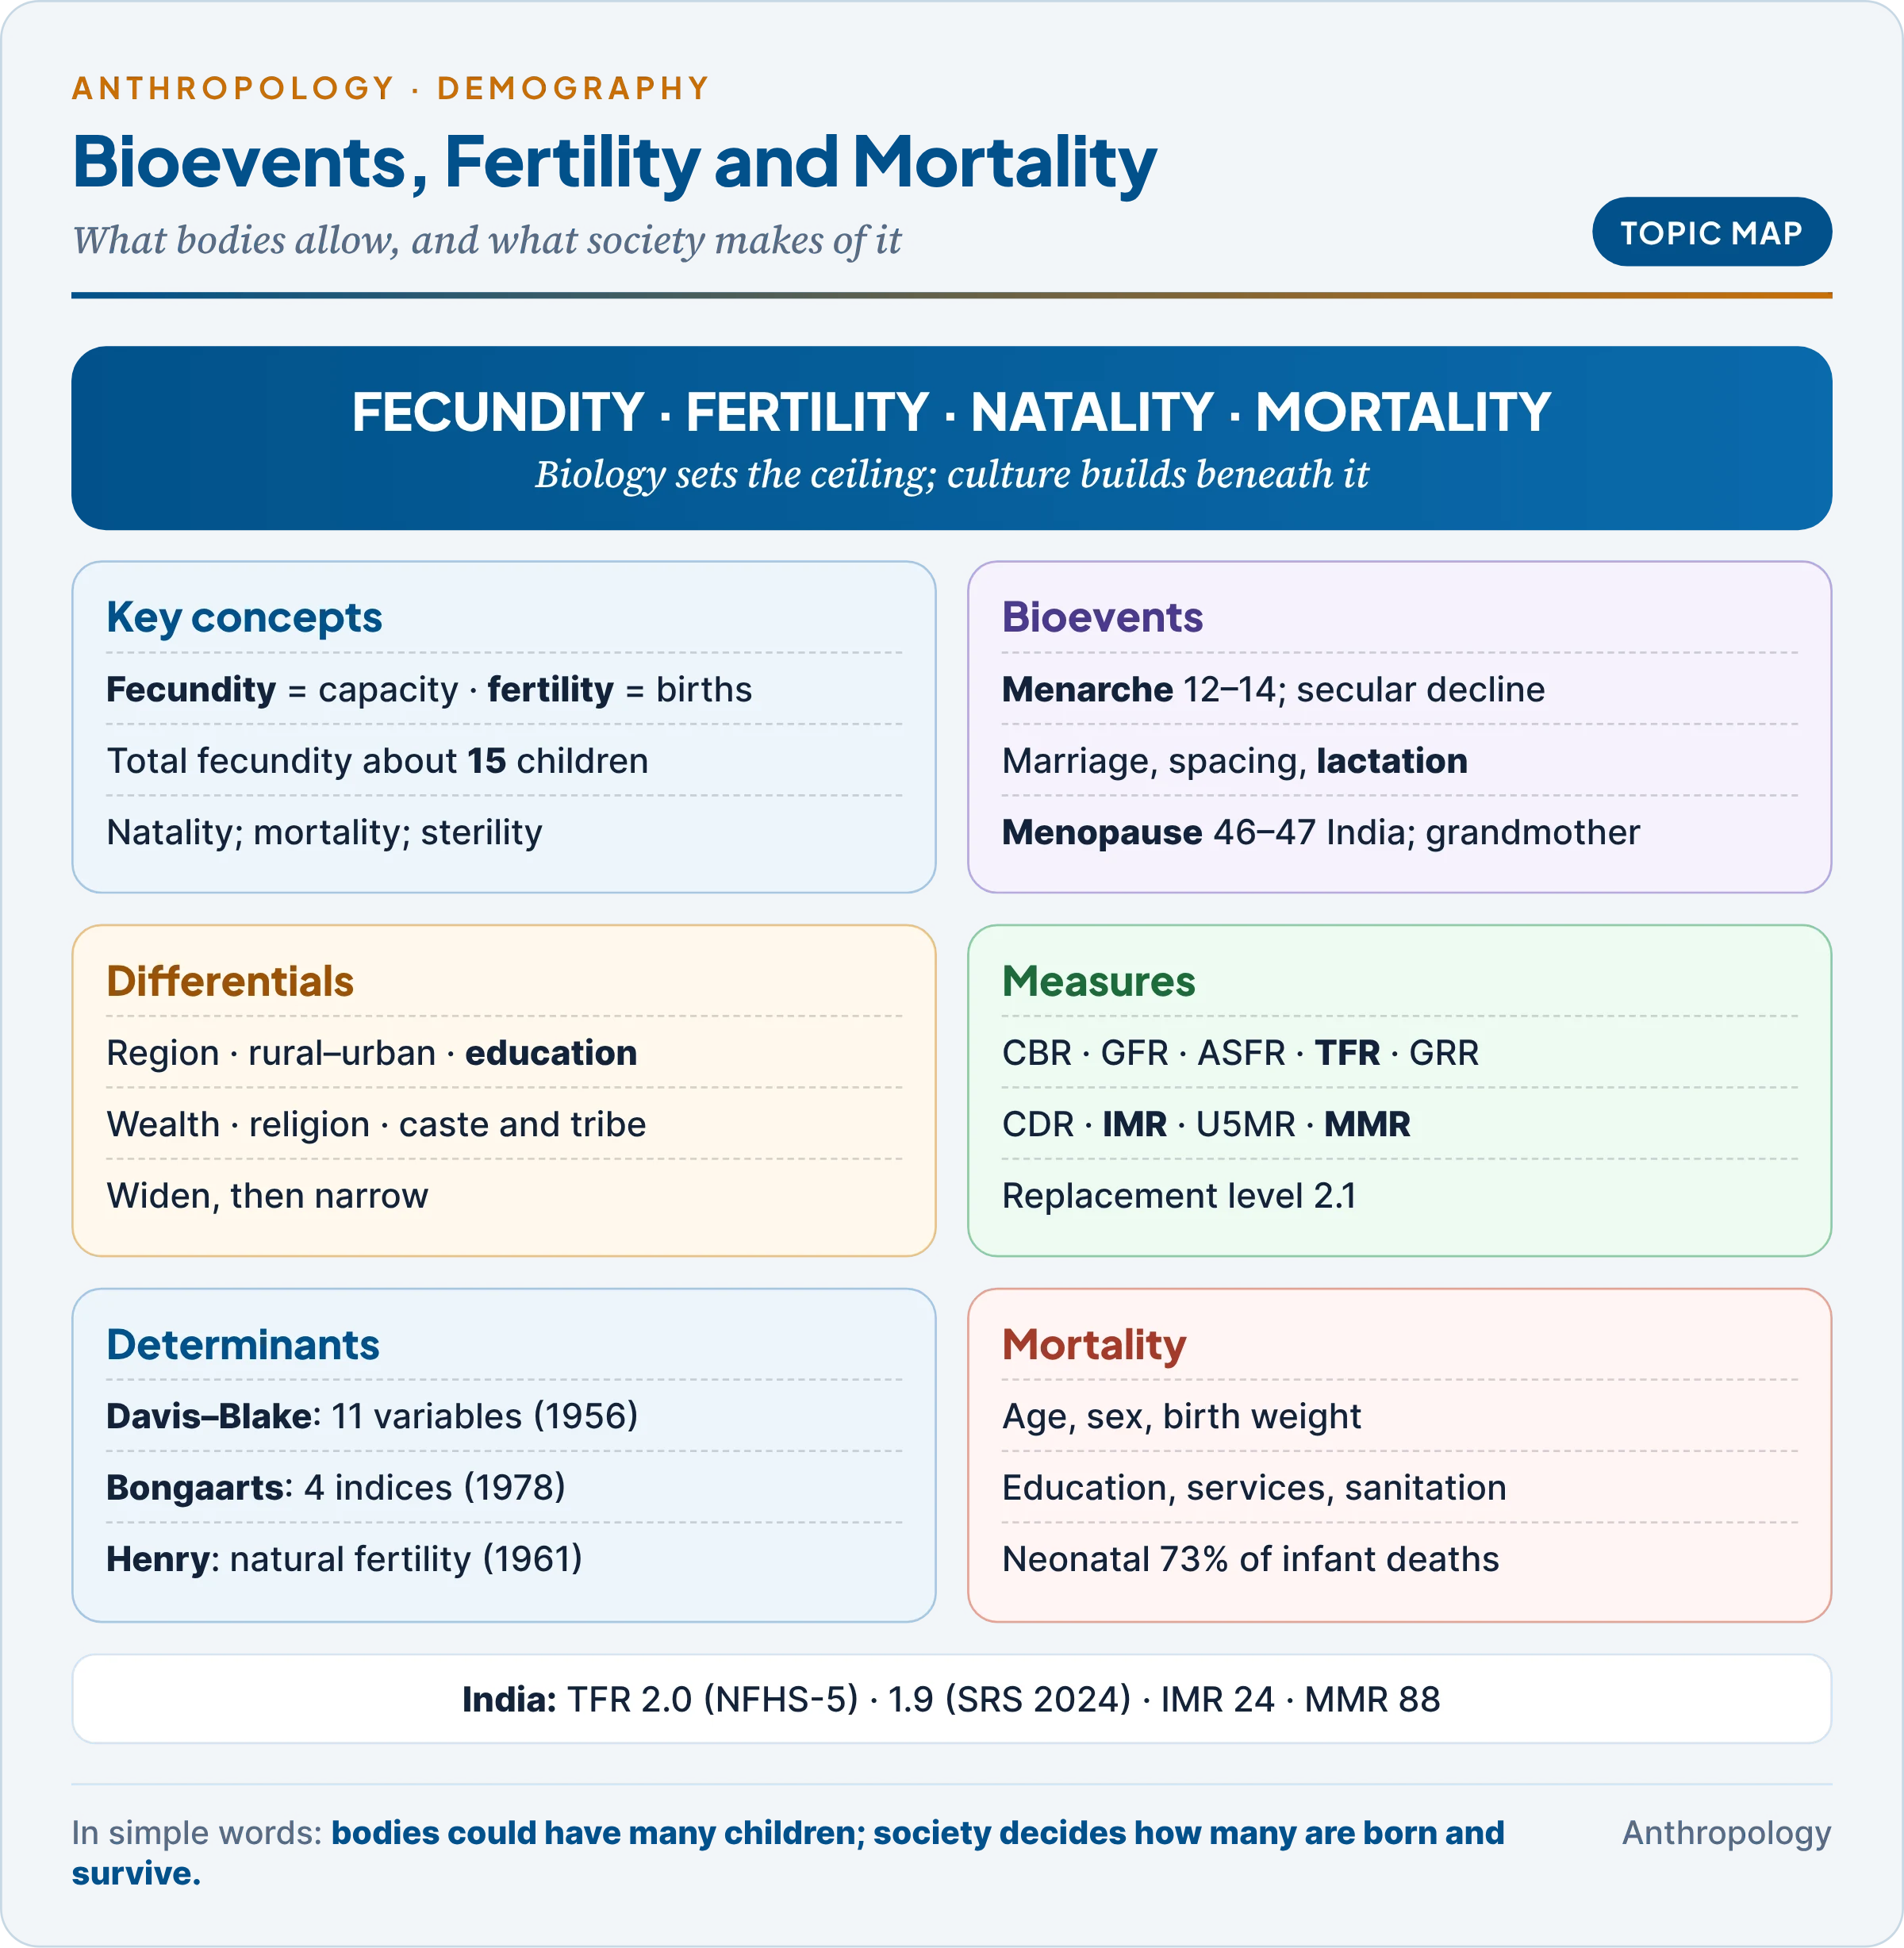
Births, deaths and migration are the three forces that change the size of a population. This unit explains the biological events of a woman’s reproductive life, how they set limits to childbearing, and why actual births and deaths vary so widely between groups. The demographic theories that try to explain these changes over history (Malthus, the demographic transition and their biological, social and cultural rivals) are treated in Unit 11b.
1. Fecundity, Fertility, Natality and Mortality
In simple words
Fecundity is the ability to have children; fertility is the number of children people actually have. Natality is the birth rate of a population, and mortality is its rate of dying. The gap between what bodies could produce and what people actually produce is shaped by culture.
An example first. Married women among the Hutterites, an Anabaptist farming community of North America who rejected contraception, had on average about ten children each in the mid-twentieth century. Women in India today average about two (TFR 1.9 in 2024). Indian women are not biologically less able to bear children. The difference lies almost entirely in marriage, breastfeeding, contraception and choice. This gap between the biologically possible and the actual is the core of the topic.
The key terms.
- Fecundity: the biological capacity to reproduce, of a man, a woman or a couple. It cannot be measured directly, only inferred. Its absence is sterility or infecundity: primary sterility if a person has never been able to conceive, secondary sterility if the capacity is lost after one or more births (for example after infection).
- Fertility: actual reproductive performance, measured by live births. The American demographers Warren Thompson and David Lewis defined it as “the actual reproductive performance of a woman or group of women”; the British statistician Bernard Benjamin as the rate at which a population adds to itself by births. A woman who has borne at least one live child is fertile; one who conceives but repeatedly miscarries is fecund but not fertile.
- Natality: the ecologist’s term for the birth rate: live births per 1,000 population per year. Absolute (potential) natality is the birth rate under ideal conditions; realised natality is the rate actually achieved under environmental and social limits.
- Mortality: the occurrence of deaths in a population. The United Nations and WHO define death as the permanent disappearance of all evidence of life after a live birth has taken place; deaths before a live birth are foetal deaths or stillbirths, not counted in mortality.
How large is the gap? A woman who married at puberty, never used contraception and did not breastfeed could in theory bear about 15 children before menopause (the Dutch demographer John Bongaarts puts this “total fecundity” at about 15.3). Real populations always fall well below this.
| Point | Fecundity | Fertility |
|---|---|---|
| Meaning | Biological capacity to reproduce | Actual births |
| Nature | Physiological | Biological plus social, cultural, economic |
| Measured by | Not directly; inferred (medical tests, waiting time to conception) | Birth statistics: CBR, GFR, TFR |
| Upper limit | About 15 births per woman | Observed maximum about 10–11 (Hutterites) |
| Affected by | Age, nutrition, disease, genetics | All of these plus marriage, contraception, abortion, breastfeeding customs, values |
The key contrast: fecundity sets the ceiling; fertility is what society builds beneath it. The factors are distinguishable but overlapping: disease and malnutrition lower fecundity directly, while late marriage or contraception lower fertility without touching fecundity; breastfeeding works through biology but is governed by custom.
Common confusion
Is a woman who cannot carry a pregnancy to term infertile or infecund? She is fecund, because she can conceive, but she is not fertile, because she has no live birth. Fecundity is the capacity to conceive and reproduce; fertility is counted only in live births. This is why reproductive wastage (miscarriage and stillbirth) lowers fertility even in fully fecund women.
2. Bioevents and Fertility: Menarche, Reproductive Span and Menopause
In simple words
A woman’s reproductive life is framed by biological events: her first menstruation, the years in which she can conceive, the pauses after each birth, and finally menopause, when menstruation stops for good. The timing of each event changes how many children she can have.
Bioevents are the biological milestones of the reproductive life course: menarche, the onset of regular ovulation, pregnancy and its outcome, postpartum amenorrhoea (absence of menstruation after a birth), lactation, and menopause. Several social events, above all age at marriage, decide how much of this biological span is actually used.
2.1 Menarche
- Meaning: the first menstrual period, a clear marker of puberty that comes late in the sequence, after the peak of the adolescent growth spurt (Unit 10a).
- Adolescent subfecundity: the first cycles are often anovulatory (no egg is released), so for about two or three years after menarche fecundity is low. This is why menarche signals the start, not the peak, of reproductive capacity.
- Normal range: roughly 9 to 15 years; most Indian studies, from the early surveys of Ho, Korwa and Tharu girls by the Indian anthropologist D.N. Majumdar onward, place the average between about 12 and 14, earlier in cities and better-off families and later among poorer rural and hill groups.
What determines age at menarche.
- Genes: mothers and daughters, and identical twins, reach menarche at similar ages; genome-wide studies since 2009 have found many gene regions (such as near LIN28B) linked to its timing.
- Nutrition and body fat: the American biologist Rose Frisch and Janet McArthur (1974) proposed a critical-fatness hypothesis: about 17% body fat is needed for menarche and about 22% to maintain regular cycles. The discovery of the fat-cell hormone leptin (1994), which signals energy stores to the hypothalamus, later gave a mechanism. Criticism: fat is a permissive signal, not a fixed threshold; many girls menstruate below it.
- Socio-economic status and urban life: better diet and less childhood infection bring menarche earlier.
- Heavy physical activity and stress: gymnasts, ballet dancers and girls doing hard labour often reach menarche late. Some studies also link family stress and father absence to earlier menarche.
- Altitude and climate: high altitude delays it; climate has little effect once nutrition is allowed for.
- Environmental chemicals: exposure to endocrine-disrupting chemicals that mimic hormones is a suspected factor.
Why menarche has become earlier: the secular trend. In Norway, average menarche fell from about 17 years in the 1840s to about 13 by the mid-twentieth century, a fall of roughly three to four months per decade, documented by the British auxologist James Tanner. Similar declines occurred across Europe and, later, in Asia, including urban India. A critical evaluation of the reasons:
- Better nutrition and higher body mass are the main cause, which is why the trend is strongest where diets improved most and why rising childhood obesity continues to push menarche earlier.
- Less childhood infection and better health care let energy go to growth rather than fighting disease.
- Urbanisation and smaller families add to better nutrition; psychosocial stress and artificial light have weaker evidence.
- Heterosis (outbreeding as villages open up) is sometimes suggested but is hard to separate from nutrition.
- Limit: in affluent countries the trend has slowed or stopped, showing a biological floor; where nutrition worsens (famine, war) menarche gets later again, so the trend is reversible.
Relevance to fertility. Earlier menarche lengthens the potential reproductive span and, where marriage is early, raises fertility. Where marriage is late, it widens the gap between biological and social maturity, raising questions of adolescent sexuality and pregnancy. It also raises lifetime exposure to oestrogen, a known risk factor for breast cancer.
2.2 The reproductive span and other bioevents
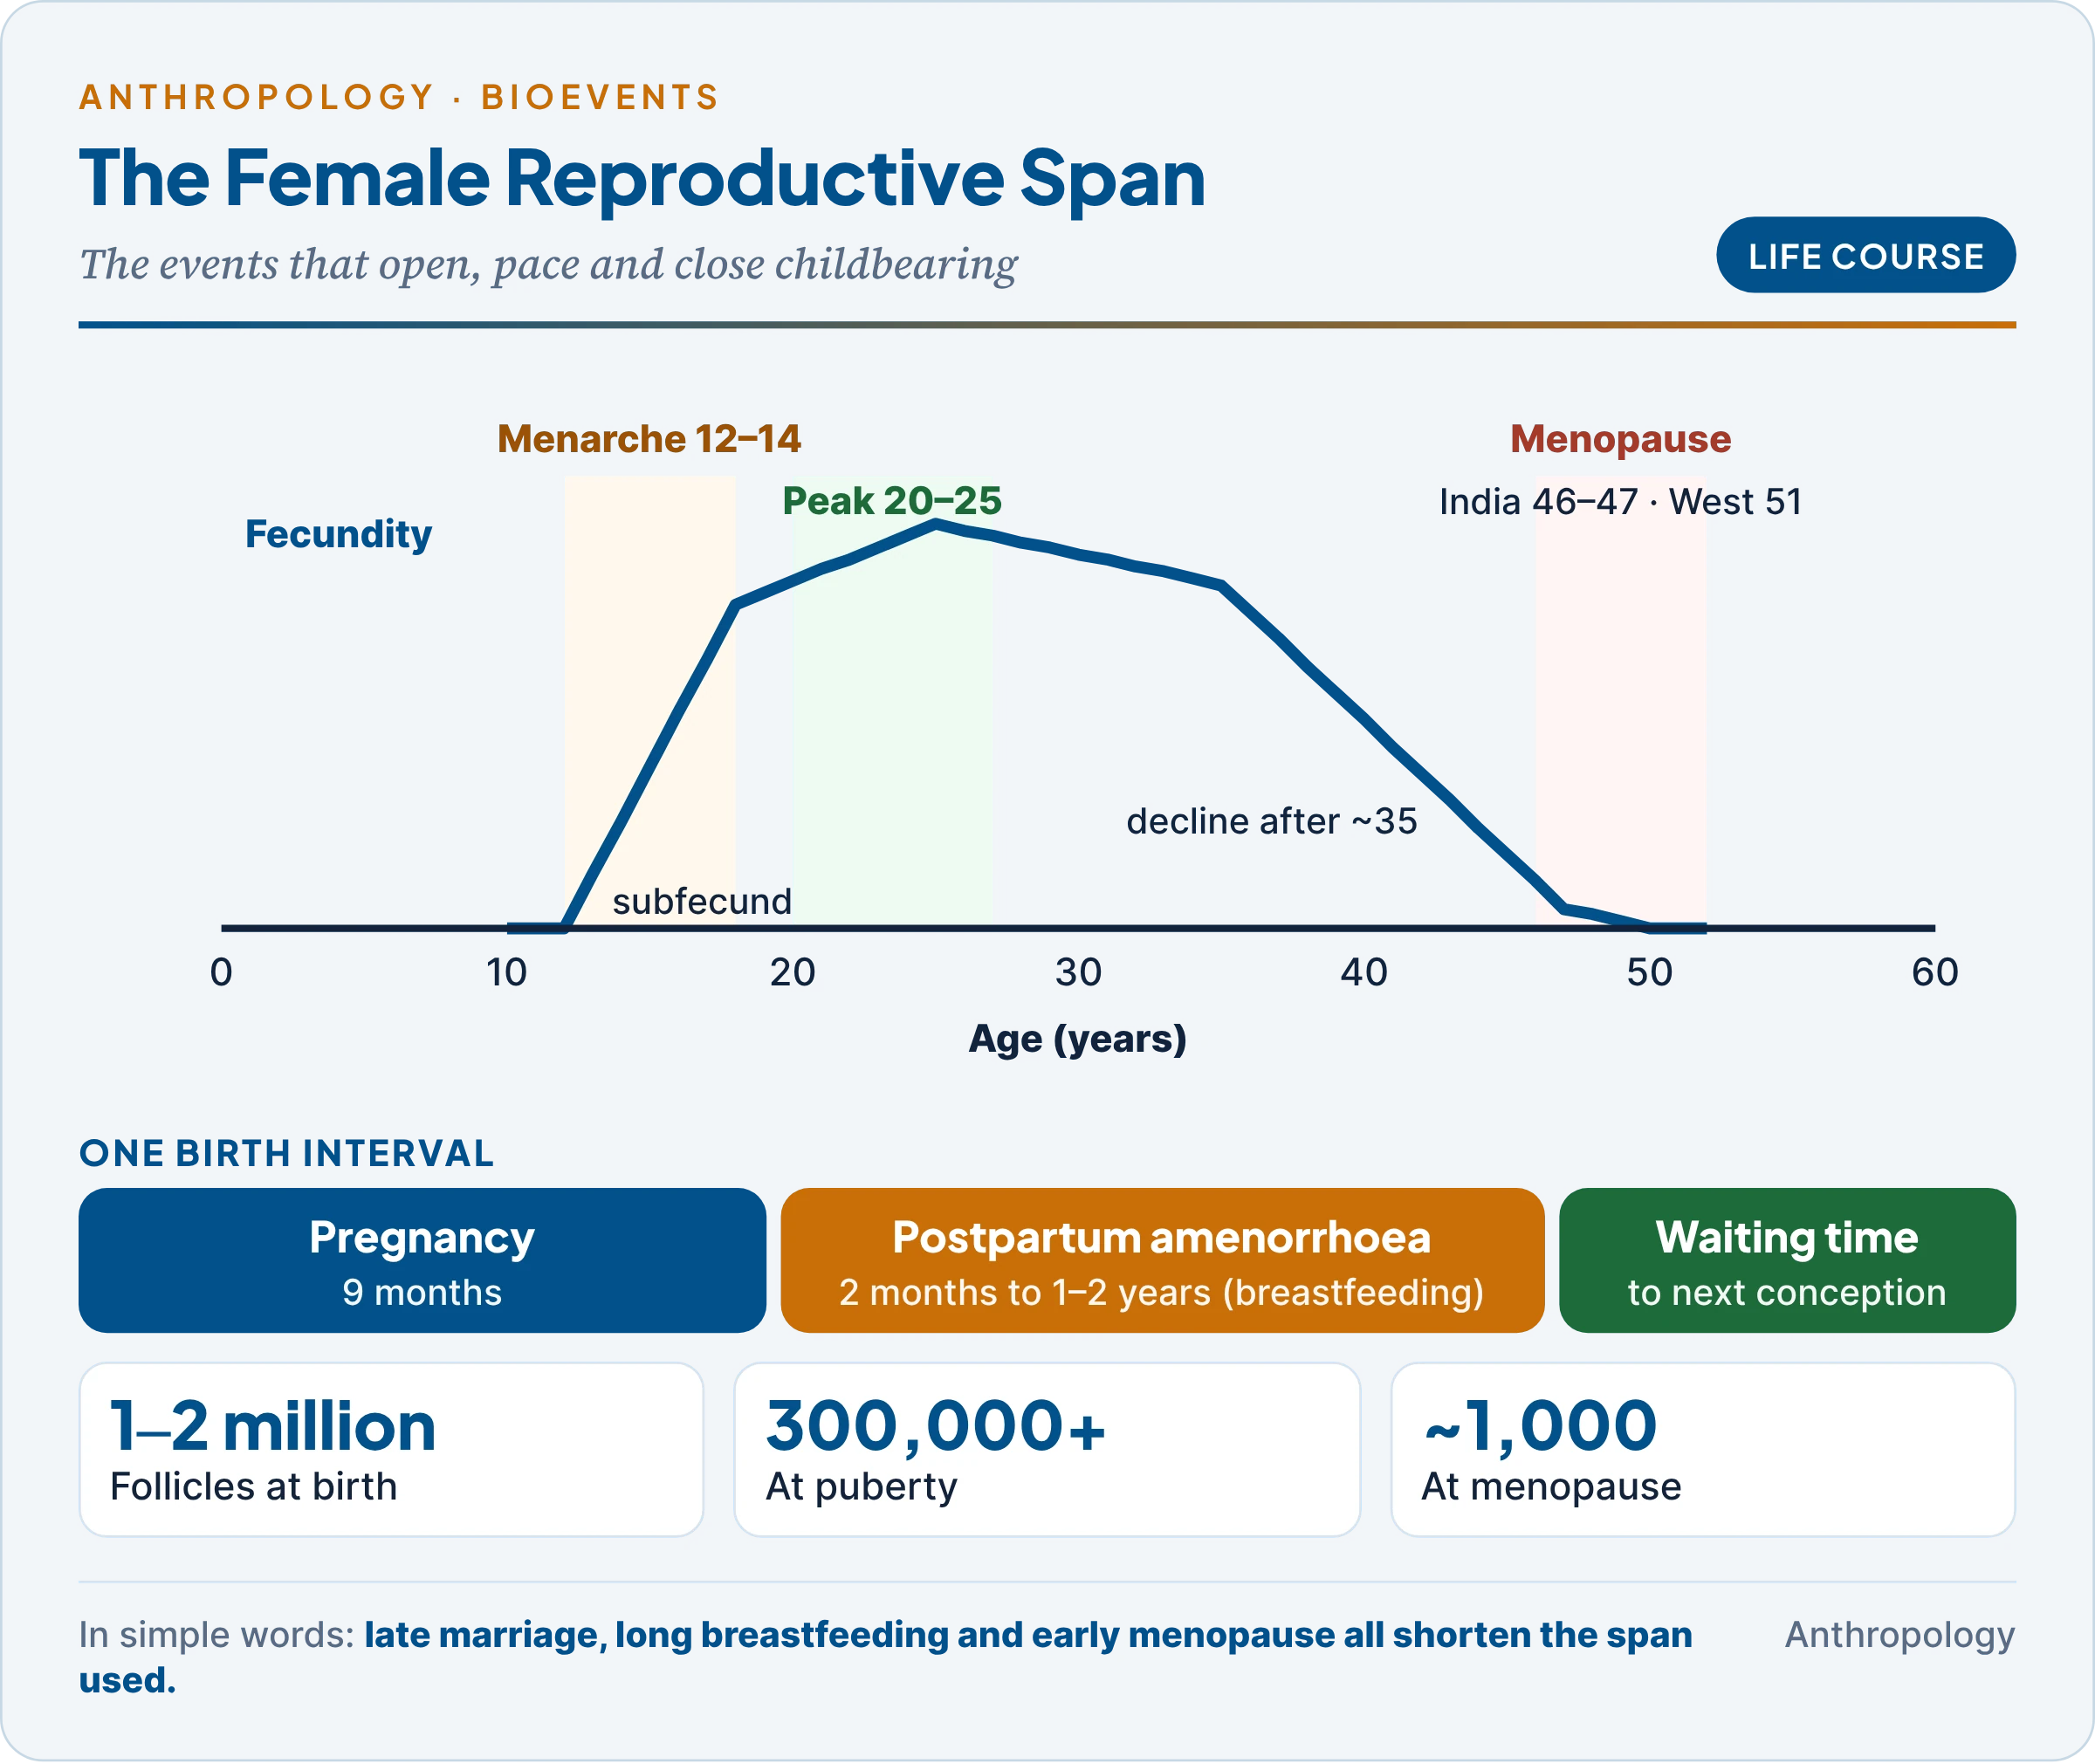
- Span: demographers treat 15–49 years as the female reproductive span. Fecundity peaks at about 20–25, declines slowly after the late twenties, faster after about 35–38, and reaches zero around 50.
- Age at marriage: in most societies childbearing begins within marriage, so age at marriage decides how much of the span is used. In India the mean age at effective marriage of women reached 23.1 years in 2024 (SRS), and the median age at first birth was 21.2 in NFHS-5 (2019–21). Early marriage is the single strongest social link between menarche and high fertility.
- Birth interval: each interval is made up of pregnancy (9 months), postpartum amenorrhoea (from about 2 months without breastfeeding to well over a year with prolonged breastfeeding), and waiting time to the next conception, plus any foetal loss. Long intervals mean fewer births (§4.4).
- Reproductive wastage: about one in five recognised pregnancies ends in spontaneous miscarriage, and the French demographer Jean Bourgeois-Pichat estimated that around 30% of all conceptions are lost, most before they are noticed.
2.3 Menopause
Meaning. Menopause is the permanent end of menstruation, confirmed after 12 consecutive months without a period. It results from depletion of ovarian follicles: a girl is born with about 1–2 million, has about 300,000–400,000 at puberty and only about 1,000 at menopause, after which oestrogen and progesterone fall and the pituitary hormones FSH and LH rise. The preceding years of irregular cycles are the perimenopause.
Timing.
- India: a meta-analysis put the mean age at natural menopause at about 46.6 years, and analyses of LASI Wave 1 data give about 46–47, compared with about 51 in Western populations. LASI data also show about 7% of Indian women reaching premature menopause (before 40).
- Factors: heredity, smoking (earlier), undernutrition and low body weight (earlier), parity and contraceptive use (some studies find later), rural residence and low schooling (earlier), and surgical menopause from hysterectomy, common in parts of India.
Symptoms and impact.
- Vasomotor: hot flushes and night sweats; sleep disturbance, irritability and low mood; joint pains.
- Urogenital: vaginal dryness and urinary problems.
- Long-term: osteoporosis and fractures, and a rise in cardiovascular risk as the protective effect of oestrogen is lost.
- Social and psychological: the end of childbearing can mean loss of status where women are valued for fertility, or release where it frees them from restrictions.
Culture shapes the experience. The Canadian medical anthropologist Margaret Lock (Encounters with Aging, 1993) found that Japanese women going through kōnenki (the “change of life”) reported hot flushes far less than North American women and complained more of shoulder stiffness. The Australian anthropologist Marcha Flint (1975) found that Rajput women in Rajasthan reported few menopausal complaints because menopause freed them from purdah and raised their standing. In India, many women endure menopausal and reproductive ill-health in a “culture of silence”, rarely seeking care. These studies show that biology sets the event, but culture shapes what it means and how it is felt.
Evolutionary significance. Few mammals stop reproducing long before death; humans, several toothed whales (killer whales, short-finned pilot whales) and, as shown in 2023, the wild Ngogo chimpanzees of Uganda are the main exceptions. The explanations are:
- Grandmother hypothesis (Kristen Hawkes, an American anthropologist, and colleagues, 1998): among the Hadza foragers of Tanzania, older women gather tubers that feed their grandchildren. Selection favoured women who stopped bearing children and invested in their daughters’ offspring, which also lengthened the human lifespan.
- Mother hypothesis (George Williams, 1957): childbirth grows riskier with age, so stopping early protects the survival of children already born.
- Reproductive conflict hypothesis: where daughters-in-law and mothers-in-law live together, the older woman gains more by ceasing to compete for resources with the younger.
- By-product view: menopause is not adaptive; human lifespan simply outran the fixed follicle supply. The Ngogo chimpanzee study found that females could spend about a fifth of adult life after reproduction, about half the human hunter-gatherer figure, suggesting that the capacity may predate humans.
2.4 Fertility patterns and differentials
Fertility differentials are differences in fertility between sub-groups of one population, by region, residence, education, income, occupation, religion, caste and tribe. Studying them identifies which groups are driving overall fertility, helps project future population, and shows family-planning programmes where to focus.
India shows these differentials clearly; the table gives verified national figures.
| Differential | Pattern | Indian data |
|---|---|---|
| Region | Northern and central states higher, southern and western lower | SRS 2024 TFR: Bihar 2.9, Uttar Pradesh highest group; Delhi 1.2, Kerala 1.3 |
| Residence | Rural above urban | SRS 2024: rural 2.1, urban 1.5; NFHS-5: 2.1 and 1.6 |
| Women’s education | The strongest inverse gradient | NFHS-5: no schooling 2.8; 12+ years 1.8 |
| Wealth | Poorer women have more children | Poorest about one child more than richest (NFHS-5) |
| Religion | Gaps narrowing fast | Hindu–Muslim gap 0.42 in NFHS-5, down from 1.1 in 1992–93 |
| Caste and tribe | Scheduled Tribes slightly higher, converging | NFHS-5: ST about 2.1, others about 2.0 (ST 2.48 in NFHS-4) |
| Women’s work | Paid employment outside the home goes with fewer births | Causality runs both ways |
What the table shows. Education and wealth matter more than religion or caste: groups converge as schooling and income rise. Muslim-majority Jammu and Kashmir (TFR about 1.4 in NFHS-5) has lower fertility than Hindu-majority Bihar, the Parsis (Zoroastrians) of India have long had very low fertility, and in the West the higher fertility of Roman Catholics than of Protestants and Jews narrowed as religious control over birth control weakened. Differentials usually follow a sequence: classes have similar fertility before the transition; the educated urban elite reduce fertility first, so differentials widen; finally fertility falls everywhere and differentials narrow. Most developed countries are in the last phase; India is moving from the second to the third.
3. Measuring Fertility and Mortality: Worked Examples
In simple words
Demographers count births and deaths and divide them by the right population to make rates that can be compared. The total fertility rate tells how many children a woman would have; the infant mortality rate tells how many babies die before their first birthday.
The measures.
- Crude birth rate (CBR) = live births in a year ÷ mid-year population × 1,000. Simple, but affected by age structure.
- General fertility rate (GFR) = live births ÷ women aged 15–49 × 1,000. Better, because only women of childbearing age are in the denominator.
- Age-specific fertility rate (ASFR) = births to women of an age group ÷ women of that age group × 1,000, for 15–19, 20–24 … 45–49.
- Total fertility rate (TFR) = sum of ASFRs × 5 ÷ 1,000: the average number of children a woman would bear if she lived through current age-specific rates. Replacement level is about 2.1, slightly above 2 because some girls die before childbearing age and slightly more boys than girls are born.
- Gross reproduction rate (GRR) = TFR × proportion of births that are girls: daughters per woman. Net reproduction rate (NRR) also allows for daughters’ mortality; NRR = 1 means each generation of mothers exactly replaces itself.
- Crude death rate (CDR) = deaths ÷ mid-year population × 1,000.
- Infant mortality rate (IMR) = deaths under one year ÷ live births of the year × 1,000. The neonatal mortality rate counts deaths in the first 28 days; under-five mortality (U5MR) deaths before age five, per 1,000 live births.
- Maternal mortality ratio (MMR) = maternal deaths ÷ live births × 100,000. A maternal death is the death of a woman during pregnancy or within 42 days of its end, from causes related to or aggravated by pregnancy, not accidents. The maternal mortality rate instead divides by women aged 15–49.
- Case fatality rate = deaths from a disease ÷ cases × 100. Life expectancy summarises the whole set of age-specific death rates (Unit 10b).
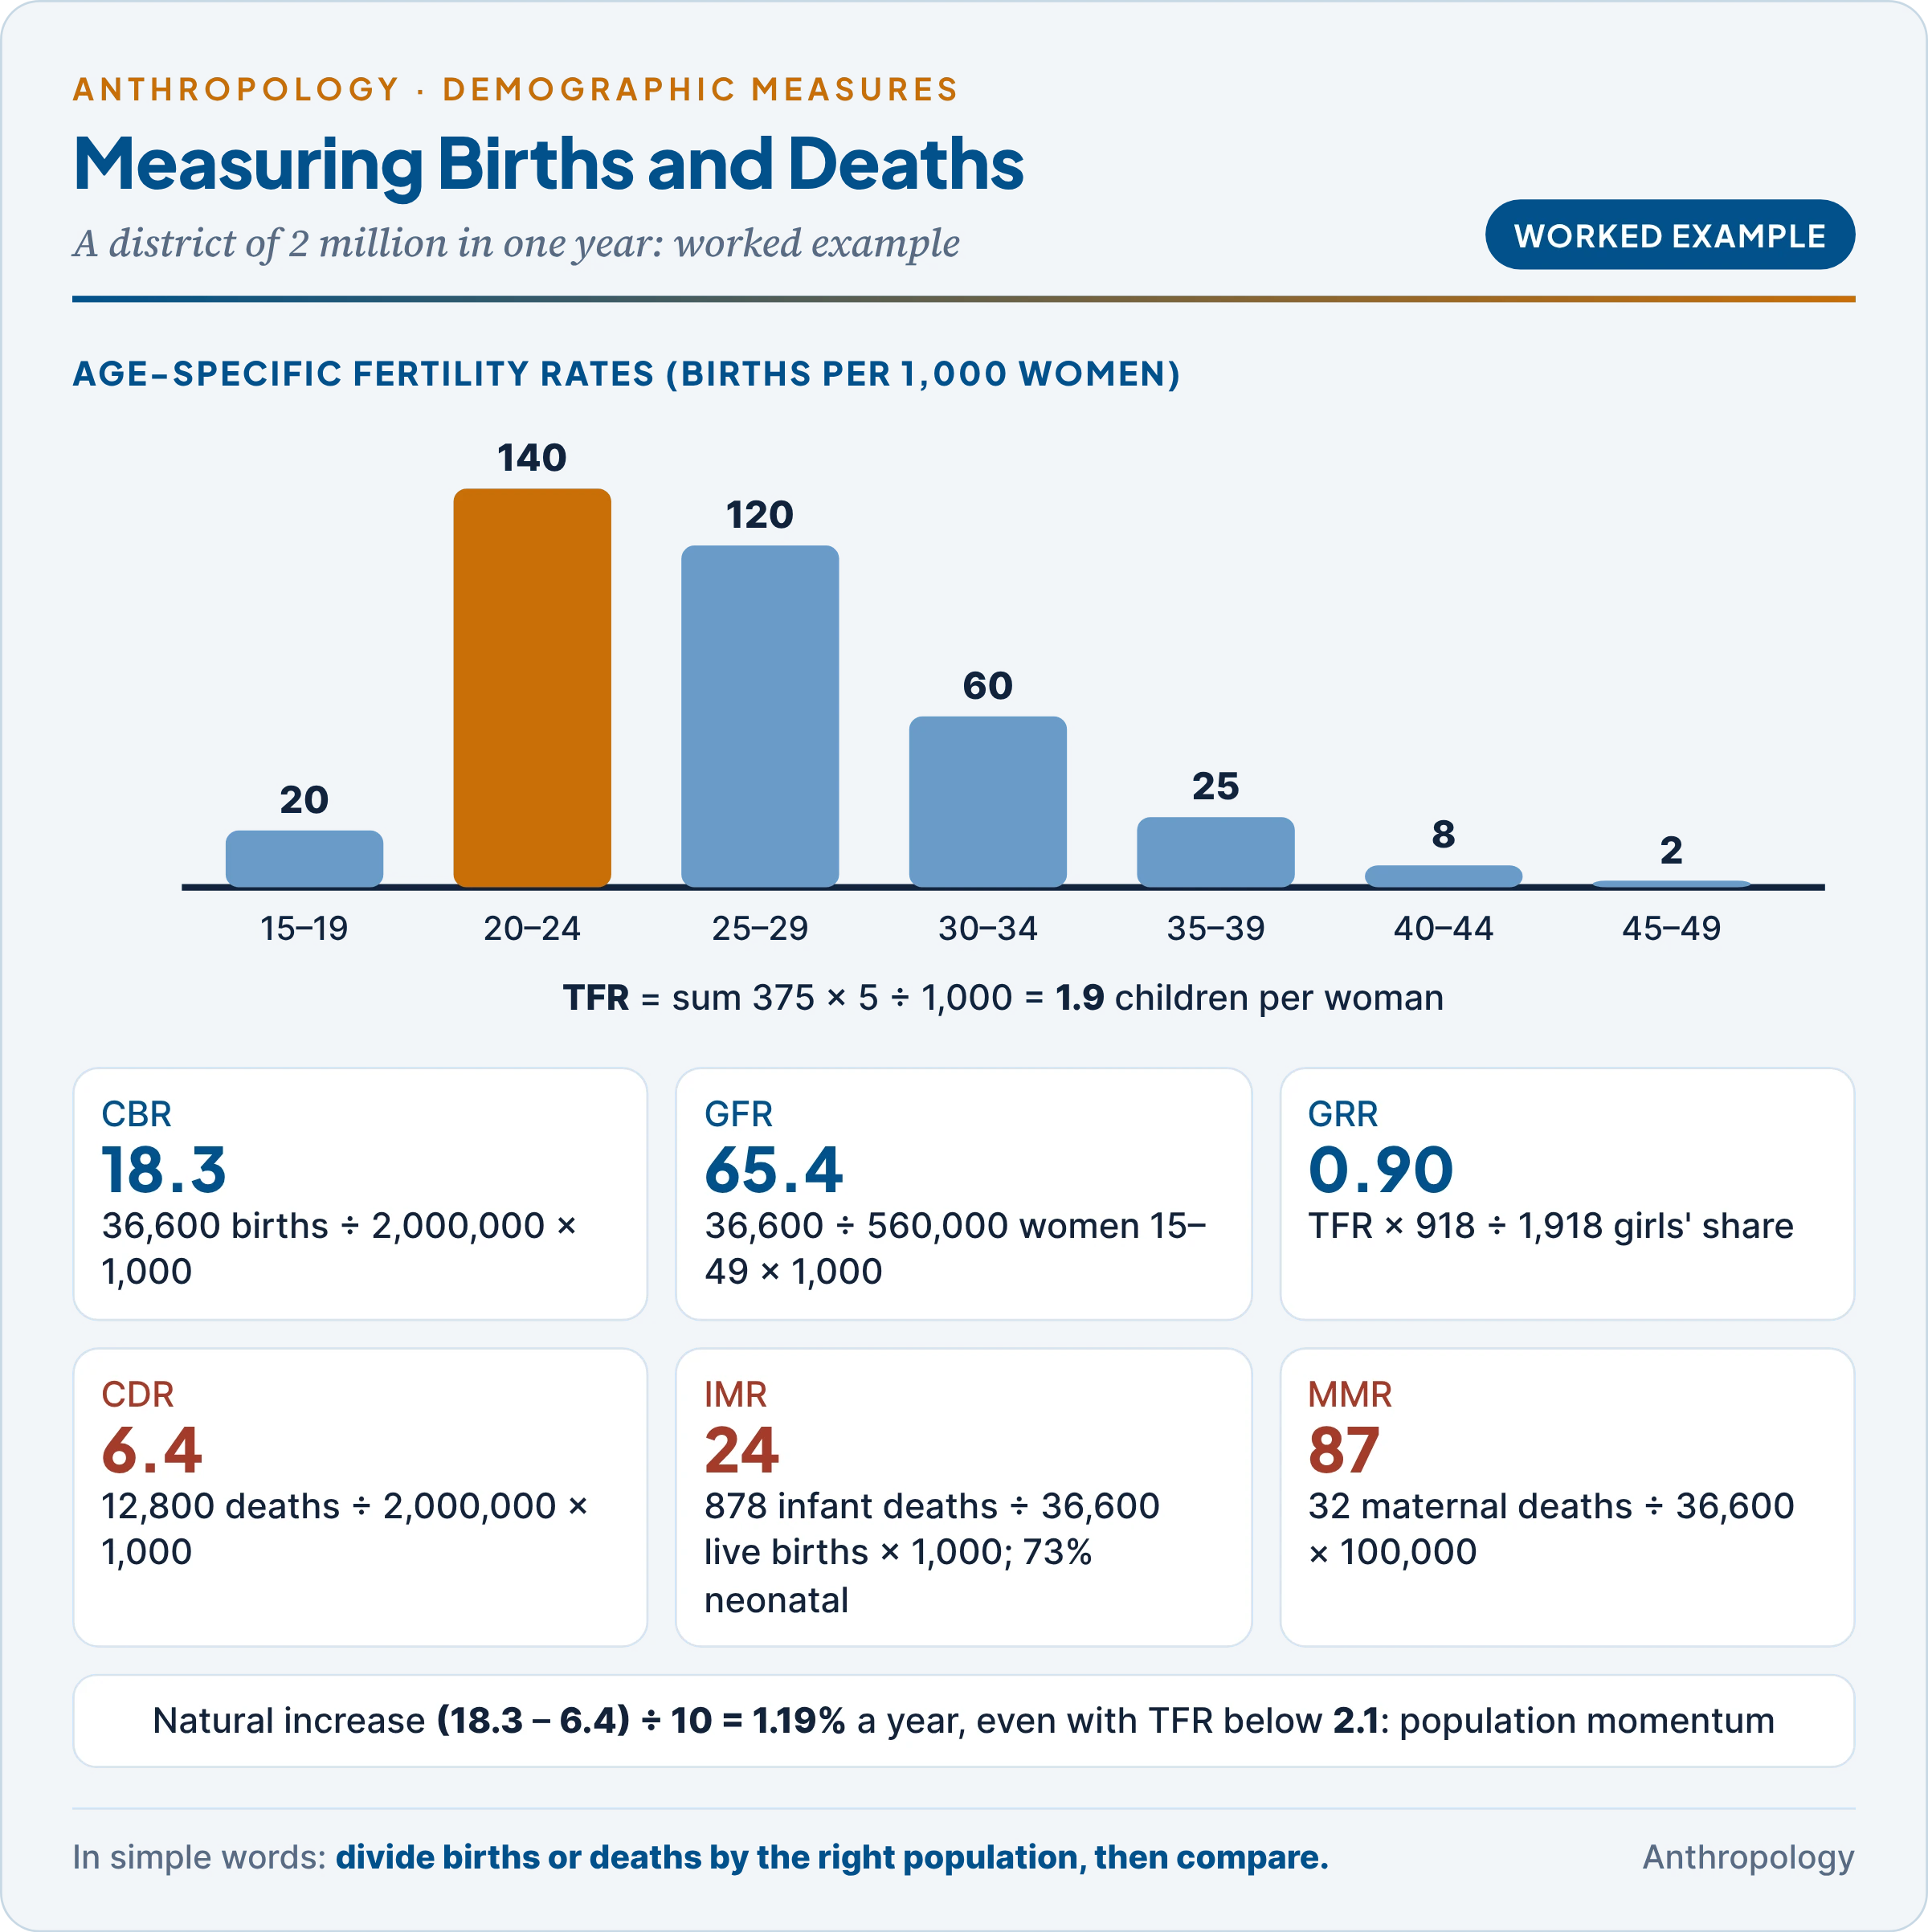
Worked example. A district has a mid-year population of 2,000,000, of whom 560,000 are women aged 15–49. In one year it records 36,600 live births, 12,800 deaths, 878 infant deaths (of which 640 in the first 28 days) and 32 maternal deaths. The age-specific fertility rates per 1,000 women are: 15–19: 20; 20–24: 140; 25–29: 120; 30–34: 60; 35–39: 25; 40–44: 8; 45–49: 2. The sex ratio at birth is 918 girls per 1,000 boys.
The table works out each measure; notice how the results echo India’s current national figures.
| Measure | Calculation | Result |
|---|---|---|
| CBR | 36,600 ÷ 2,000,000 × 1,000 | 18.3 per 1,000 |
| GFR | 36,600 ÷ 560,000 × 1,000 | 65.4 per 1,000 women |
| TFR | (20 + 140 + 120 + 60 + 25 + 8 + 2) × 5 ÷ 1,000 = 375 × 5 ÷ 1,000 | 1.9 children per woman |
| GRR | 1.875 × 918 ÷ 1,918 | 0.90 daughters per woman |
| CDR | 12,800 ÷ 2,000,000 × 1,000 | 6.4 per 1,000 |
| Natural increase | (18.3 − 6.4) ÷ 10 | 1.19% a year |
| IMR | 878 ÷ 36,600 × 1,000 | 24 per 1,000 live births |
| Neonatal mortality | 640 ÷ 36,600 × 1,000 | 17.5; neonatal share 640 ÷ 878 = 73% |
| MMR | 32 ÷ 36,600 × 100,000 | 87 per 100,000 live births |
Reading the results. The population still grows by about 1.2% a year even though TFR is below replacement, because a large cohort of young women is in the childbearing ages: demographers call this population momentum. A GRR below 1 shows that, in the long run, each generation of mothers is not fully replaced. The neonatal share of infant deaths (about three-quarters) shows that further gains depend on care at birth, not only on vaccines and clean water.
4. Factors Influencing Fecundity, Fertility and Natality
In simple words
Every influence on births, whether religion, income, schooling or custom, must act through a few direct routes: whether women are in sexual unions, whether they use contraception or abortion, and how long breastfeeding delays the next pregnancy. Biology sets the limits; society decides how close a group comes to them.
An example first. Among the !Kung San foragers of the Kalahari, studied by the American anthropologists Nancy Howell and Melvin Konner, women used no contraception, yet births were spaced about four years apart and women averaged only about four to five children. Konner and Carol Worthman (1980) showed why: babies nursed several times an hour, day and night, for years, and this frequent suckling kept their mothers from ovulating. Culture, through a breastfeeding pattern, regulated fertility through biology. This is how the social and the biological meet in fertility.
4.1 The intermediate variables (Davis and Blake, 1956)
The American sociologists Kingsley Davis and Judith Blake reasoned that a birth requires three steps: intercourse, conception, and successful gestation. Any social or economic factor can affect fertility only by acting through one of eleven “intermediate variables” grouped under these steps. The table lists them with examples.
| Stage | Intermediate variables | Examples |
|---|---|---|
| Exposure to intercourse | 1. Age at entry into sexual unions; 2. permanent celibacy; 3. time spent after or between unions (widowhood, divorce, separation); 4. voluntary abstinence; 5. involuntary abstinence (illness, migration for work); 6. coital frequency | Early marriage in South Asia; late marriage in pre-industrial Europe; the Hindu ban on widow remarriage; postpartum sex taboos; Tibetan monastic celibacy |
| Exposure to conception | 7. Fecundity affected by involuntary causes (disease, hunger); 8. use or non-use of contraception; 9. fecundity affected by voluntary causes (sterilisation, prolonged breastfeeding) | Venereal disease causing sterility; famine amenorrhoea; female sterilisation, India’s main method |
| Gestation and parturition | 10. Foetal mortality from involuntary causes (miscarriage); 11. foetal mortality from voluntary causes (induced abortion) | About 20% of known pregnancies miscarry; abortion as a historical means of control |
Why this framework matters. It turns a confusing list of “causes” into an analysis: religion, income or education never act on births directly. A religion raises fertility only if it encourages early marriage, opposes contraception or forbids abortion. Its limit is that the eleven variables are hard to measure and of very unequal weight.
4.2 Proximate determinants (Bongaarts, 1978)
John Bongaarts showed that four of these variables explain almost all differences in fertility between populations, and expressed them as indices between 0 (complete suppression) and 1 (no effect):
TFR = Cm × Cc × Ca × Ci × TF, where TF ≈ 15.3 is total fecundity and:
- Cm, index of marriage: the proportion of women in sexual unions (1 if all women of childbearing age are in unions).
- Cc, index of contraception = 1 − 1.08 × u × e, where u is the proportion of married women using contraception and e its average effectiveness.
- Ca, index of induced abortion.
- Ci, index of postpartum infecundability = 20 ÷ (18.5 + i), where i is the average months of postpartum infecundability (mostly lengthened by breastfeeding).
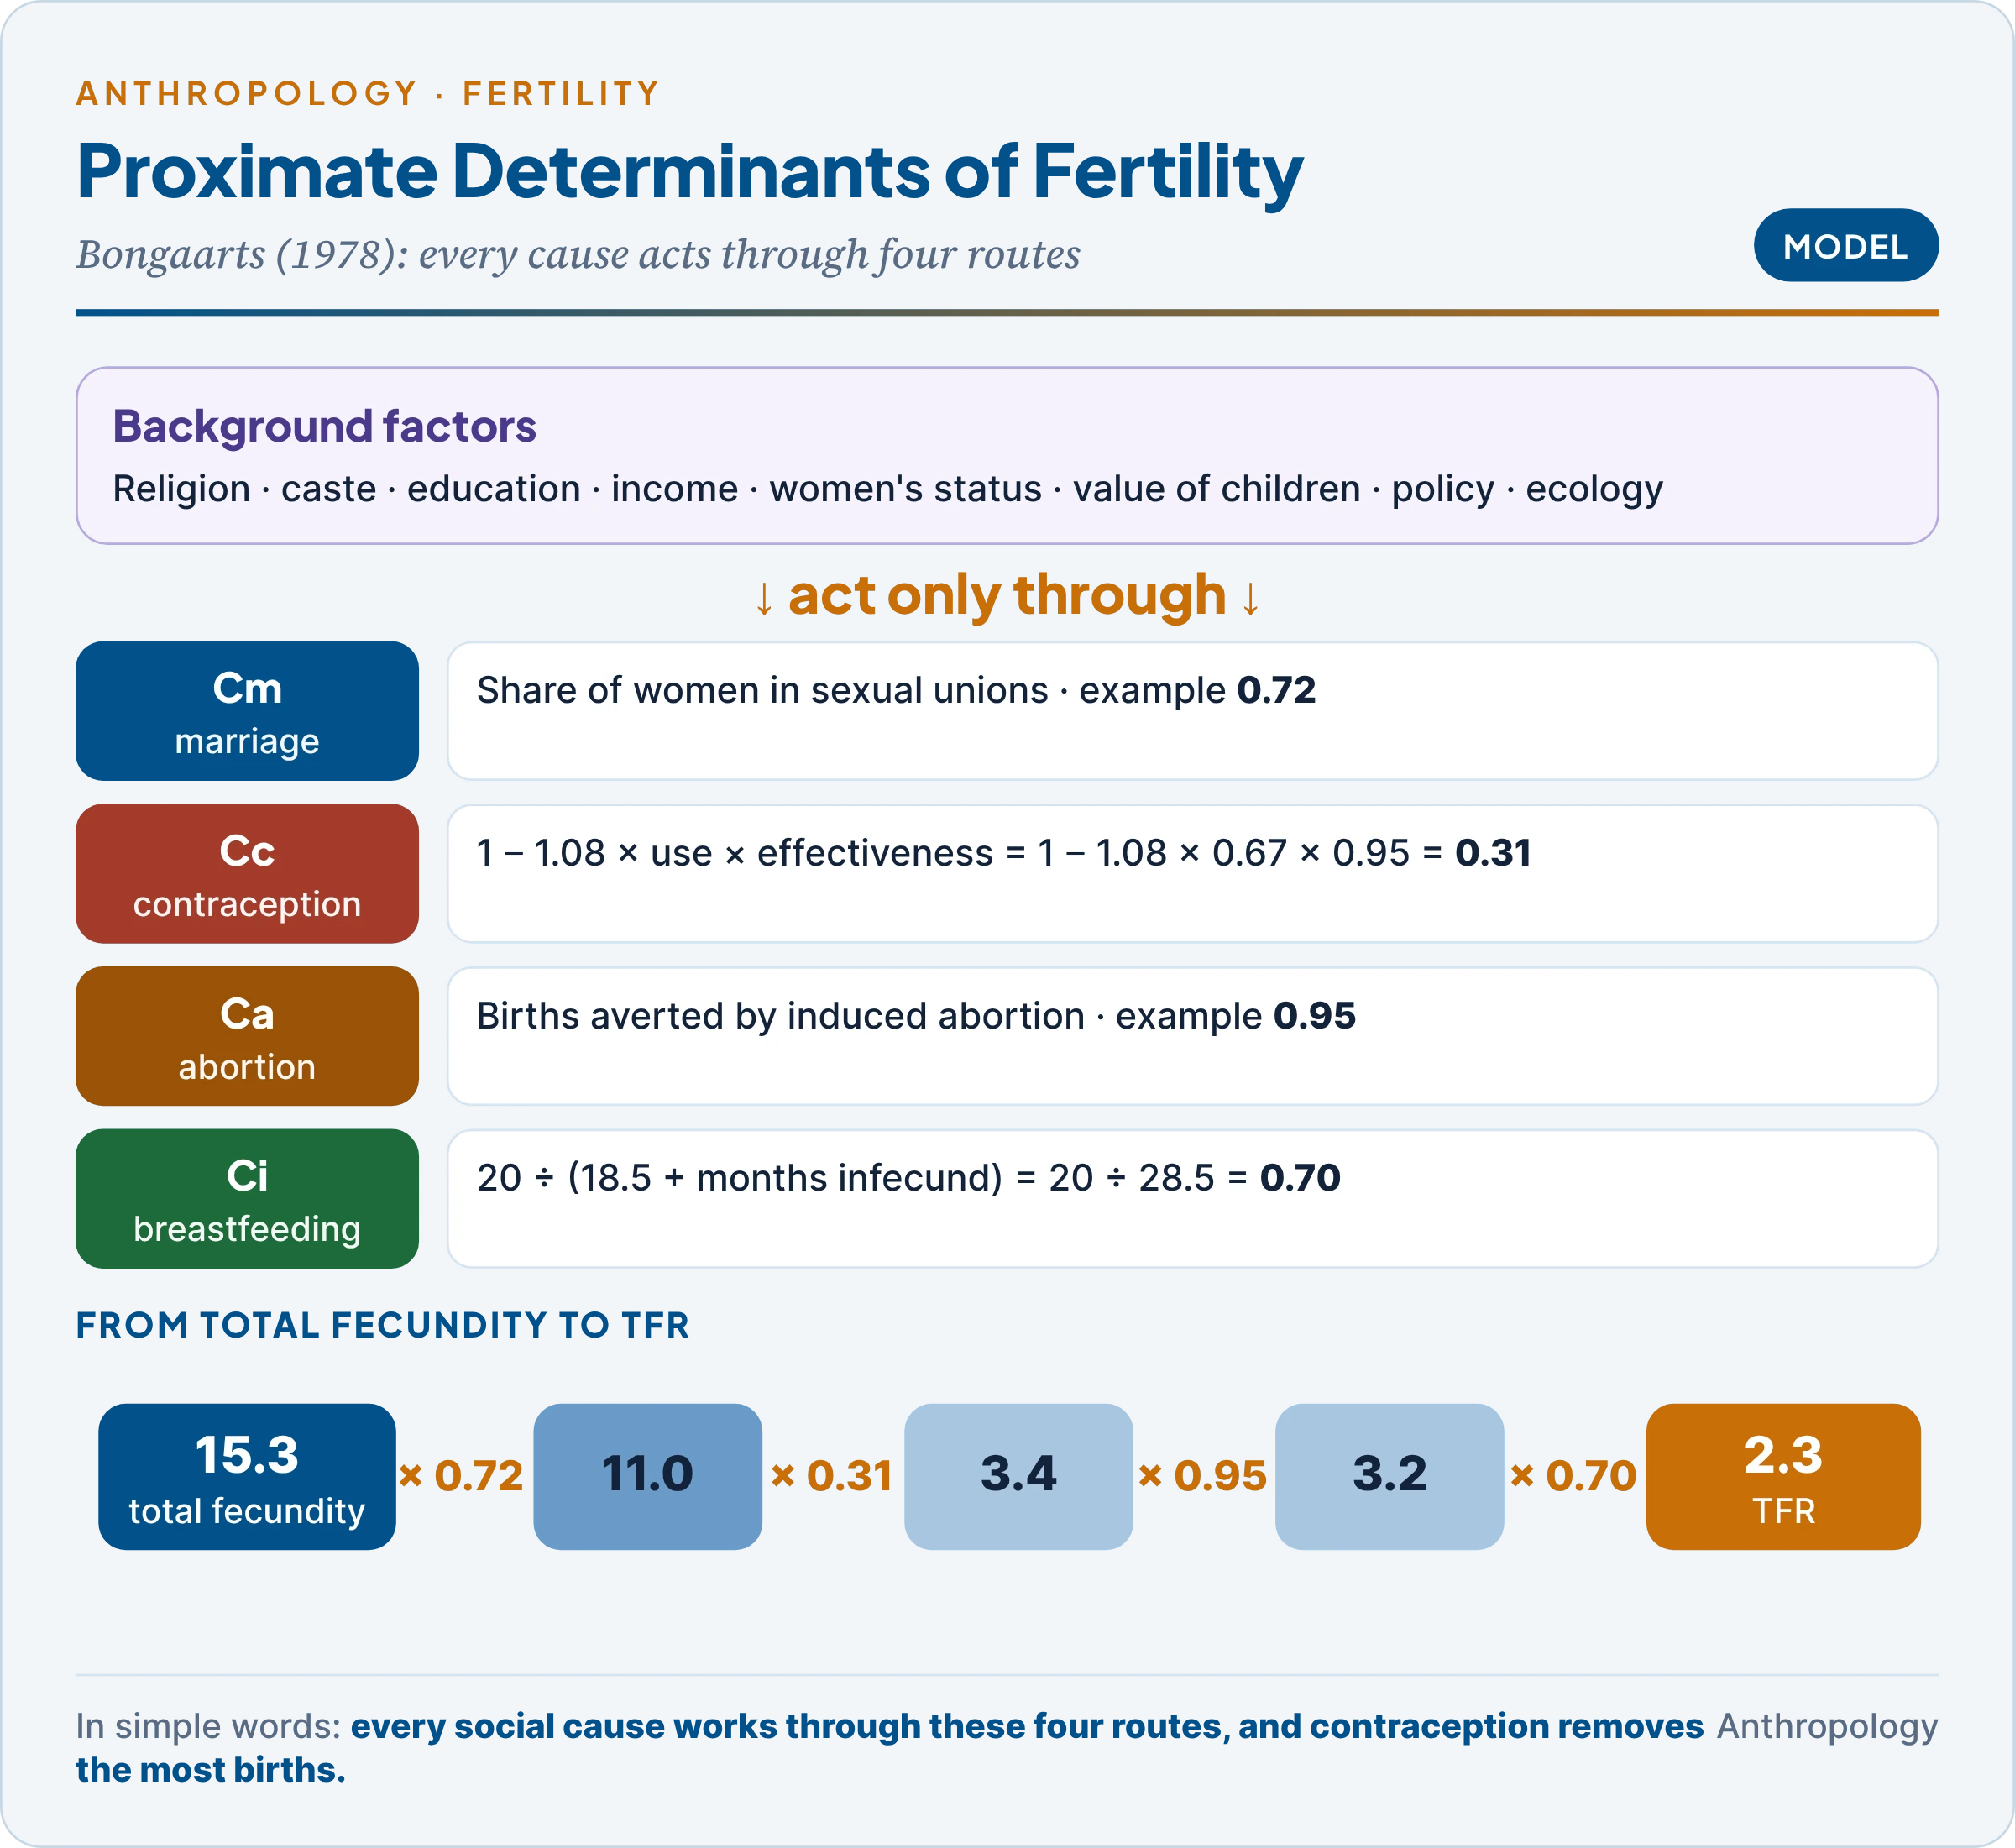
Worked example. Suppose 72% of women of childbearing age are married (Cm = 0.72); 67% of them use contraception with 95% effectiveness (Cc = 1 − 1.08 × 0.67 × 0.95 = 0.31); abortion lowers fertility by 5% (Ca = 0.95); and breastfeeding gives 10 months of postpartum infecundability (Ci = 20 ÷ 28.5 = 0.70). Then TFR = 15.3 × 0.72 × 0.31 × 0.95 × 0.70 ≈ 2.3. The calculation shows that contraception here removes about two-thirds of potential births, more than any other determinant, which fits India, where female sterilisation is the dominant method (37.9% of married women in NFHS-5).
What breastfeeding alone does. With no breastfeeding (i about 2 months) Ci = 20 ÷ 20.5 = 0.98; with 18 months, Ci = 20 ÷ 36.5 = 0.55. Long breastfeeding can therefore cut fertility by almost half, which is why fertility in non-contracepting populations varies so much.
4.3 Natural fertility (Louis Henry, 1961)
- Meaning: the French demographer Louis Henry defined natural fertility as fertility in the absence of deliberate, parity-specific control: couples do not stop having children after reaching a desired number.
- Variation within natural fertility: natural fertility is not one level. It ranges from about 4–5 children (the !Kung) to about 10 (the Hutterites, studied by Joseph Eaton and Albert Mayer, 1953), because of differences in breastfeeding, age at marriage, nutrition, disease and coital frequency.
- How it is recognised: in natural-fertility populations the age pattern of fertility is “convex”, declining slowly with age; under deliberate control, fertility drops sharply at older ages because couples stop once their target is reached.
- Why it matters: it separates biological and customary limits from conscious family limitation, and shows that “traditional” societies were never at the biological maximum.
4.4 Lactational amenorrhoea
- Mechanism: a baby’s suckling sends nerve signals to the hypothalamus; the hormone prolactin rises and the pulsed release of GnRH (gonadotrophin-releasing hormone) and LH is suppressed, so the ovaries do not ovulate.
- Key condition: what matters is frequency and intensity of suckling, especially at night, not just the number of months; adding other foods reduces suckling and lets ovulation return.
- Scale of effect: the American demographer Robert Potter estimated postpartum sterility at about 13 months in populations with prolonged breastfeeding against about 4 months where women do not breastfeed. Indian studies have long found longer postpartum amenorrhoea in rural India than in the West because of prolonged breastfeeding.
- Use as a method: the Lactational Amenorrhoea Method (LAM) gives about 98% protection if three conditions hold: the baby is under six months, fully or nearly fully breastfed, and menstruation has not returned.
- Relevance: campaigns for exclusive breastfeeding (63.7% of Indian infants under six months in NFHS-5) help both child survival and birth spacing.
4.5 Biological factors
- Age: adolescent subfecundity, peak at 20–25, decline after 35, and the age of the man (sperm quality declines slowly).
- Nutrition: severe hunger causes amenorrhoea in women and reduced sperm count in men; during the Dutch “Hunger Winter” of 1944–45 conceptions fell sharply. Chronic moderate undernutrition has a smaller effect than once thought.
- Disease: sexually transmitted infections, genital tuberculosis and other pelvic infections cause secondary sterility; malaria and anaemia raise foetal loss.
- Reproductive wastage: miscarriage, stillbirth, and, in very close consanguineous marriages, a raised risk of recessive disorders and foetal loss (Unit 9.3).
- Genetic and hormonal conditions: chromosomal anomalies (Unit 9.4) and conditions such as polycystic ovary syndrome.
4.6 Socio-ecological factors
- Marriage patterns: age at marriage, proportion never marrying, widow remarriage (historically restricted among upper-caste Hindus, lowering their fertility), divorce and separation.
- Marriage forms: polyandry lowers the number of births per man and the share of women who marry; in Tibet, monastic celibacy did the same, which ecologists interpret as adjustment to scarce land.
- Customs: postpartum sex taboos and prolonged breastfeeding in many African and Indian tribal societies; ritual abstinence.
- Value and cost of children: where children work, care for parents in old age and continue the lineage, fertility is high; the Australian demographer John Caldwell argued that fertility falls when wealth flows reverse, from parents to children (Unit 11b). Son preference keeps couples bearing children until a son is born.
- Women’s status and education: the demographers Tim Dyson and Mick Moore (1983) traced India’s north–south fertility contrast to greater female autonomy in the south (marriage within the region, closer links with natal kin, more freedom of movement).
- Child mortality: where many children die, parents have more births to replace or insure against losses; fertility usually falls a few years after child mortality falls.
- Ecology and subsistence: foragers have long birth intervals (mobility makes carrying several small children hard), while sedentary farming shortened intervals and raised fertility, the Neolithic demographic transition.
- Religion, policy and contraception: pronatalist teachings, India’s national family-planning programme (from 1952), and access to services. Contraception is the largest single determinant in modern populations (§4.2).
- Tribal populations: micro-studies of Indian tribes have reported crude birth rates above 30 and wide variation in TFR, with high fertility often combined with high infant mortality. Small isolated groups such as the Onge of Little Andaman have shown low fertility and high childlessness, a concern for their survival.
Common confusion
Do religion and caste cause fertility differences directly? No. They act only through intermediate variables: age at marriage, contraception, abortion, breastfeeding and the value placed on children. When education and income are held equal, most religious and caste differences in Indian fertility shrink sharply, and they are narrowing in every NFHS round.
5. Mortality: Biological and Socio-ecological Factors
In simple words
Who dies, and at what age, depends on the body (age, sex, birth weight) and on surroundings (food, clean water, health care, income and education). Most of the fall in deaths over the last two centuries came from better living conditions and public health.
An example first. In Kerala only 8 of every 1,000 babies die before their first birthday; in Chhattisgarh 36 do (SRS 2024). Babies in both states share the same biology. The difference comes from mothers’ education, health services, sanitation and nutrition: the socio-ecological factors of mortality.
5.1 Patterns of mortality
- Age pattern: the age-specific death rate curve is U-shaped (or J-shaped): high in infancy, lowest around 10–14, then rising steadily with age (the Gompertz pattern, Unit 10b). In low-mortality countries the infant arm almost disappears.
- Sex differences: at almost every age males die at higher rates, and female life expectancy exceeds male in nearly all countries (India 2019–23: 72.5 against 68.5). The English statistician John Graunt, often called the father of demography, noted in his Observations upon the Bills of Mortality (1662) that more men than women die. The causes are both biological (hormonal protection of the heart in women, a second X chromosome) and social (men’s riskier work, smoking, alcohol, violence). In India, son preference historically produced excess female child mortality, through neglect of girls’ nutrition and care.
- Infant mortality, two components:
- Neonatal deaths (first 28 days) are mainly endogenous: low birth weight, prematurity, birth injury, congenital defects, maternal age (under 19 or over 35), short birth intervals and high birth order.
- Post-neonatal deaths (28 days to one year) are mainly exogenous: diarrhoea, pneumonia and other infections, poor feeding, unsafe water and crowding.
- As IMR falls, the neonatal share rises: in India, 72.8% of infant deaths now occur in the first 28 days and 52.7% in the first week (SRS 2024).
5.2 Biological and socio-ecological factors
The table brings together the main factors of mortality, with Indian evidence.
| Factor | How it acts | Indian evidence |
|---|---|---|
| Age and sex | Infants and the old most vulnerable; males higher | Female e₀ about 4 years higher |
| Birth weight and maternal factors | Low birth weight, teenage or older mothers, short spacing | Neonatal share of infant deaths about 73% |
| Mother’s education | Better feeding, hygiene, use of services | Infant deaths highest for children of mothers with no schooling in every NFHS round |
| Residence | Rural areas have fewer services | SRS 2024 IMR: rural 27, urban 17; U5MR 32 and 19 |
| Region | Health systems and poverty differ | IMR Kerala 8, Chhattisgarh 36; U5MR 41 in Madhya Pradesh and Uttar Pradesh, 9 in Kerala |
| Income and occupation | Diet, housing, hazardous work | Mortality rose steadily from professional to unskilled classes in England and Wales from 1921 |
| Marital status | Married adults have lower mortality (selection and support) | Widely observed |
| Tribe | Remote, forested, malaria-prone areas; poverty | NFHS-5: ST IMR 41.6, U5MR 50.3, against 34.5 and 40.9 for others |
Reading the table. The biological factors set who is vulnerable; the socio-ecological factors decide whether the vulnerable survive. This is why the same low birth weight is far more often fatal in a remote village than in a city hospital.
5.3 Maternal mortality
- India’s MMR fell from 327 per 100,000 live births in 1999–2001 to 88 in 2021–23 (SRS Special Bulletin, September 2025). The SDG target is below 70 by 2030.
- Regional gap: Kerala and Andhra Pradesh 30, Tamil Nadu 35 and Maharashtra 36, against Odisha 153, Chhattisgarh 146, Madhya Pradesh 142 and Uttar Pradesh 141.
- Causes: haemorrhage, hypertensive disorders, sepsis and obstructed labour, worsened by anaemia (over half of Indian women) and delays in reaching care. Studies among the Kutia Kondh of Odisha described unassisted deliveries at home, which raise both maternal and newborn deaths when labour is complicated.
- Why it fell: institutional and medically attended delivery (about 95% of births in SRS 2024), cash incentives under Janani Suraksha Yojana (2005), free care and transport, and maternal-death reviews.
5.4 Why mortality fell
- In the past, death rates were high and fluctuating because of famine, epidemics, war and poor sanitation; the American epidemiologist Hans Zinsser argued that disease shaped history more than generals did.
- In developed countries mortality fell from the eighteenth century with more and better food (the agricultural revolution, transport to famine areas), sanitation and clean water (nineteenth-century public-health reforms, chlorination), then vaccines, asepsis, antibiotics and insecticides. The British physician Thomas McKeown (1976) argued that better nutrition, not medicine, caused most of the early decline, since deaths from tuberculosis were falling long before effective drugs; critics answered that sanitation and public-health action mattered as much.
- In developing countries after 1945, mortality fell fast and largely independent of economic growth, because DDT, antibiotics, vaccines and WHO campaigns were imported cheaply. This is why death rates fell long before birth rates, producing rapid population growth.
- The changing causes of death from infection to chronic disease, the epidemiological transition, are treated in Unit 9.8.
Social consequences of falling mortality. Lower mortality changes society as well as population. The English anthropologist Geoffrey Gorer (Death, Grief and Mourning, 1965) observed that mourning customs weakened as death became rarer; families can live as independent nuclear units because early widowhood and orphanhood are rare; parents invest more emotion and money in each child; and long joint lives may change expectations of marriage.
6. India Today: Fertility and Mortality at a Glance
In simple words
India now has fewer births than needed to replace each generation, and far fewer infant and maternal deaths than a generation ago. But large gaps remain between states, between village and city, and between tribal and other communities.
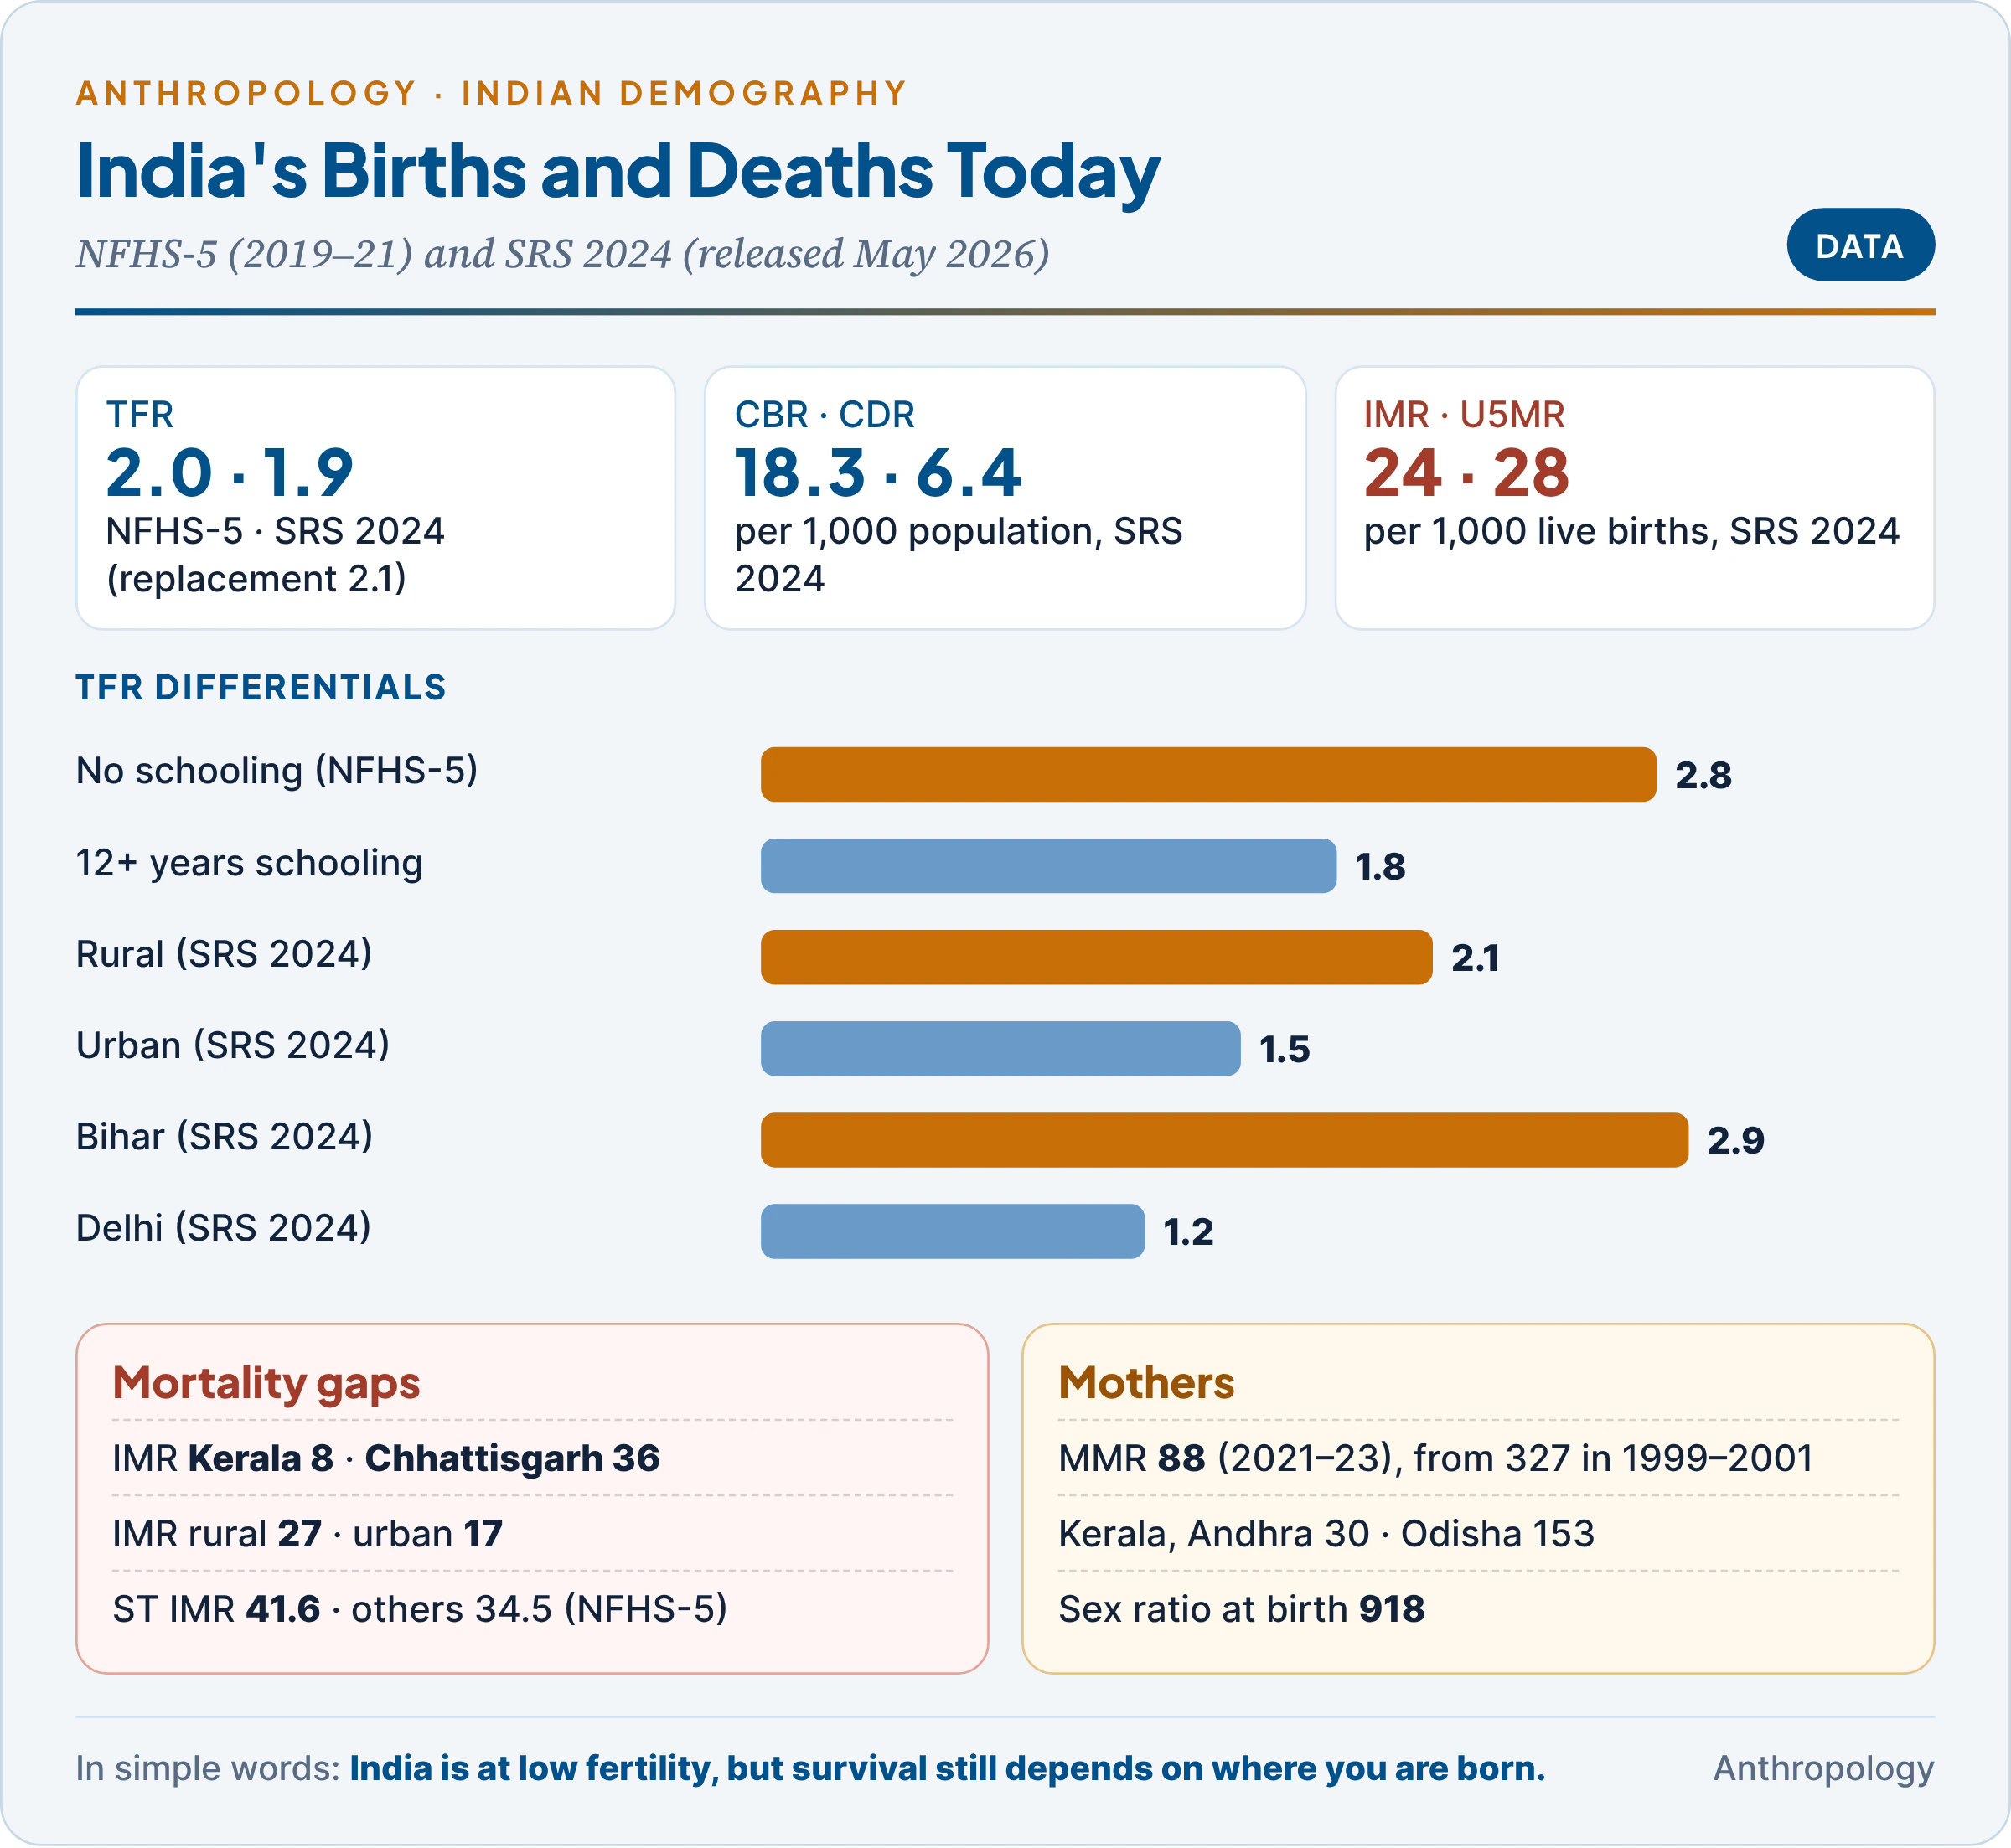
- Fertility: NFHS-5 (2019–21): TFR 2.0 (urban 1.6, rural 2.1), down from 3.4 in 1992–93; India reached replacement level in this round. SRS 2024 (May 2026) puts TFR at 1.9, below replacement for the fifth year, with CBR 18.3 and GFR 64.6 (2022–24).
- Mortality: SRS 2024: CDR 6.4, IMR 24 (down from 30 in 2019), U5MR 28; MMR 88 (2021–23).
- Sex ratio at birth: 918 girls per 1,000 boys (2022–24), still below the natural level of about 950, showing continued sex-selective practices.
- Tribal India: NFHS-5 shows ST fertility (about 2.1) close to the national level, but ST infant and child mortality remain about a fifth higher; ST elderly and children carry a heavy burden of undernutrition (Units 9.8, 10b).
- Meaning for the future: with low fertility and rising survival, India is moving into population ageing (Unit 10b) while some states remain young: the demographic theories that explain this transition are taken up in Unit 11b.
Key Terms
| Term | Meaning in simple words |
|---|---|
| Fecundity | The biological ability to have children |
| Fertility | The number of children actually born |
| Natality | The birth rate of a population |
| Sterility | Inability to reproduce: primary if never, secondary if lost later |
| Menarche | A girl’s first menstrual period |
| Adolescent subfecundity | Low ability to conceive in the first years after menarche |
| Menopause | The permanent end of menstruation |
| Grandmother hypothesis | Menopause evolved so older women could help raise grandchildren |
| Postpartum amenorrhoea | Absence of periods after childbirth, lengthened by breastfeeding |
| Lactational amenorrhoea | Breastfeeding-induced pause in ovulation |
| Natural fertility | Fertility without deliberate stopping at a target number |
| Intermediate variables | The eleven direct routes through which all factors affect births |
| Proximate determinants | Bongaarts’ four main routes: marriage, contraception, abortion, breastfeeding |
| TFR | Average children per woman at current age-specific rates |
| Replacement level | A TFR of about 2.1, at which each generation replaces itself |
| IMR | Infant deaths per 1,000 live births |
| MMR | Maternal deaths per 100,000 live births |
| Fertility differential | A difference in fertility between groups in one population |
| Population momentum | Continued growth after TFR falls, because many young women remain |
Contemporary Developments
- SRS Statistical Report 2024 (May 2026): TFR 1.9 (rural 2.1, urban 1.5), CBR 18.3, CDR 6.4, IMR 24, U5MR 28; Bihar TFR 2.9 and Delhi 1.2; mean age at effective marriage of women 23.1.
- Maternal mortality: the SRS Special Bulletin (September 2025) gives MMR 88 for 2021–23, unchanged from 2020–22, with Kerala and Andhra Pradesh at 30 and Odisha at 153.
- Convergence of group fertility: NFHS-5 shows Hindu–Muslim and caste–tribe differences in fertility narrowing to fractions of a child, with education and wealth the dominant gradients.
- Menopause research in India: analyses of LASI Wave 1 put the mean age at natural menopause at about 46–47 and premature menopause at about 7%, prompting calls for midlife women’s health services.
- Menopause beyond humans (2023): hormonal and demographic evidence of menopause in wild Ngogo chimpanzees reopened the debate on its evolution.
Diagrams to Master
- Topic map: concepts → bioevents → differentials → measures → proximate determinants → mortality → India’s data.
- Female reproductive life course: menarche, adolescent subfecundity, peak fecundity, decline after 35, menopause (46–47 India, 51 West); a birth interval split into pregnancy, postpartum amenorrhoea and waiting time.
- Measures: ASFR bars by age group summing to TFR; CBR, GFR, IMR, MMR formulas with the worked district.
- Bongaarts’ model: background factors → four proximate determinants → TFR, starting from total fecundity of 15.3.
- India at a glance: TFR, IMR, MMR and their rural–urban, regional, educational and tribal gaps.
Revision Grid
| Scholar | Work (year) | Key idea |
|---|---|---|
| John Graunt | Bills of Mortality (1662) | More men than women die; founding of demography |
| Eaton and Mayer | Hutterite study (1953) | Very high fertility without contraception |
| Davis and Blake | 1956 | Eleven intermediate variables of fertility |
| George Williams | 1957 | Mother hypothesis of menopause |
| Louis Henry | 1961 | Natural fertility: no parity-specific control |
| Frisch and McArthur | 1974 | Critical body fat for menarche |
| Marcha Flint | 1975 | Rajput women and menopause as release |
| Thomas McKeown | The Modern Rise of Population (1976) | Nutrition behind mortality decline |
| John Caldwell | 1976 | Wealth flows and fertility |
| John Bongaarts | 1978 | Four proximate determinants; TF 15.3 |
| Nancy Howell | Demography of the Dobe !Kung (1979) | Low natural fertility of foragers |
| Konner and Worthman | 1980 | Nursing frequency suppresses ovulation |
| Dyson and Moore | 1983 | Female autonomy and India’s north–south fertility contrast |
| Margaret Lock | Encounters with Aging (1993) | Kōnenki: culture shapes menopause |
| Kristen Hawkes | 1998 | Grandmother hypothesis among the Hadza |
| Wood and colleagues | Science (2023) | Menopause in wild chimpanzees |
Previous Year Questions
Unit 11.1: Menarche, menopause and other bioevents; fertility patterns and differentials
- 2025Write notes on: Evolutionary significance of menopause.
- 2023Write notes on: Menopausal symptoms.
- 2022Critically evaluate the reasons of reduction in age at menarche in human females over the successive generations.
- 2017Write a note in 150 words on Age at menarche.
- 2015Write a note in 150 words on Menopause and its impact.
- 2014Discuss the relevance of menarche, menopause and other bio-events to fertility.
- 2008Write a note on Bioevent of fertility.
- 2001Write a note on Menarche and Menopause.
Unit 11.3: Biological and socio-ecological factors influencing fecundity, fertility, natality and mortality
- 2026What do you understand by fertility and mortality? How are these influenced by biological and socio-ecological factors?
- 2021Discuss the bio-social determinants of fertility and fecundity.
- 2019Discuss the bio-cultural factors influencing fertility in light of the relationship between fecundity and fertility.
- 2018Define fecundity and explain major factors affecting fecundity in Indian populations.
- 2017Describe the biological and socio- ecological factors affecting fertility and mortality.
- 2016Write a note in 150 words on Fertility and Fecundity.
- 2014Write a note in 150 words on Fertility and Fecundity.
- 2010Distinguish between the terms ‘fecundity’ and ‘fertility’. Are the factors influencing them distinguishable? Discuss.
- 2005Discuss the biological and socioecological factors influencing fertility and mortality.
Related questions from other units
- 2022Unit 11.2: Discuss the contemporary population problems in the light of various socio-cultural demographic theories.
- 2020Unit 9.8: Critically examine the demographic and epidemiological consequences with rise in food production and sedentism.
- 2013Unit 11.2: Write a note in 150 words on Demographic transition.
- 2012Unit 9.3: What are the genetic effects of consanguinity? Give examples.
- 2007Unit 11.2: Write a note on Demographic Transition.