

9.1 Human Genetics – Methods and Application: Methods for study of genetic principles in man-family study (pedigree analysis, twin study, foster child, co-twin method, cytogenetic method, chromosomal and karyo-type analysis), biochemical methods, immunological methods, D.N.A technology and recombinant technologies
Official Syllabus: Paper I, Unit 9.1
Unit 1.7 explained the cell, DNA, genes, mutation and chromosomes: in short, genes are stretches of DNA carried on 46 chromosomes, copied at each cell division and passed half from each parent. This unit asks a different question: how do we find out whether, and how, a human trait is inherited? Mendel’s laws as applied to man are in Unit 9.2, gene frequencies in Unit 9.3, and chromosomal disorders in Unit 9.4.
1. Why Human Genetics Needs Special Methods
In simple words
Scientists study inheritance in peas and fruit flies by breeding them in large numbers. Humans cannot be bred for experiments, have few children and live long. So geneticists use families, twins, adopted children and laboratory tests of blood and DNA instead.
In Gadchiroli district of Maharashtra, sickle-cell screening up to July 2026 tested about 4.9 lakh people and found about 24,000 carriers and 2,654 patients (Ministry of Health and Family Welfare). To tell a family whether a child will inherit the disease, a geneticist must know how the trait passes from parents to children. Breeding experiments are impossible; the answer has to come from families that already exist and from tests on blood and DNA.
1.1 The obstacles
- No controlled matings: a geneticist cannot choose who marries whom.
- Small families (too few children for reliable ratios) and long generations (25–30 years).
- Heterozygosity: most people carry two different versions (alleles) of many genes, so pure lines do not exist.
- Uncontrolled environment: diet, disease and culture vary between homes, blurring the effect of genes; and ethics forbid experimental exposure.
1.2 The solution: “experiments of nature” and the laboratory
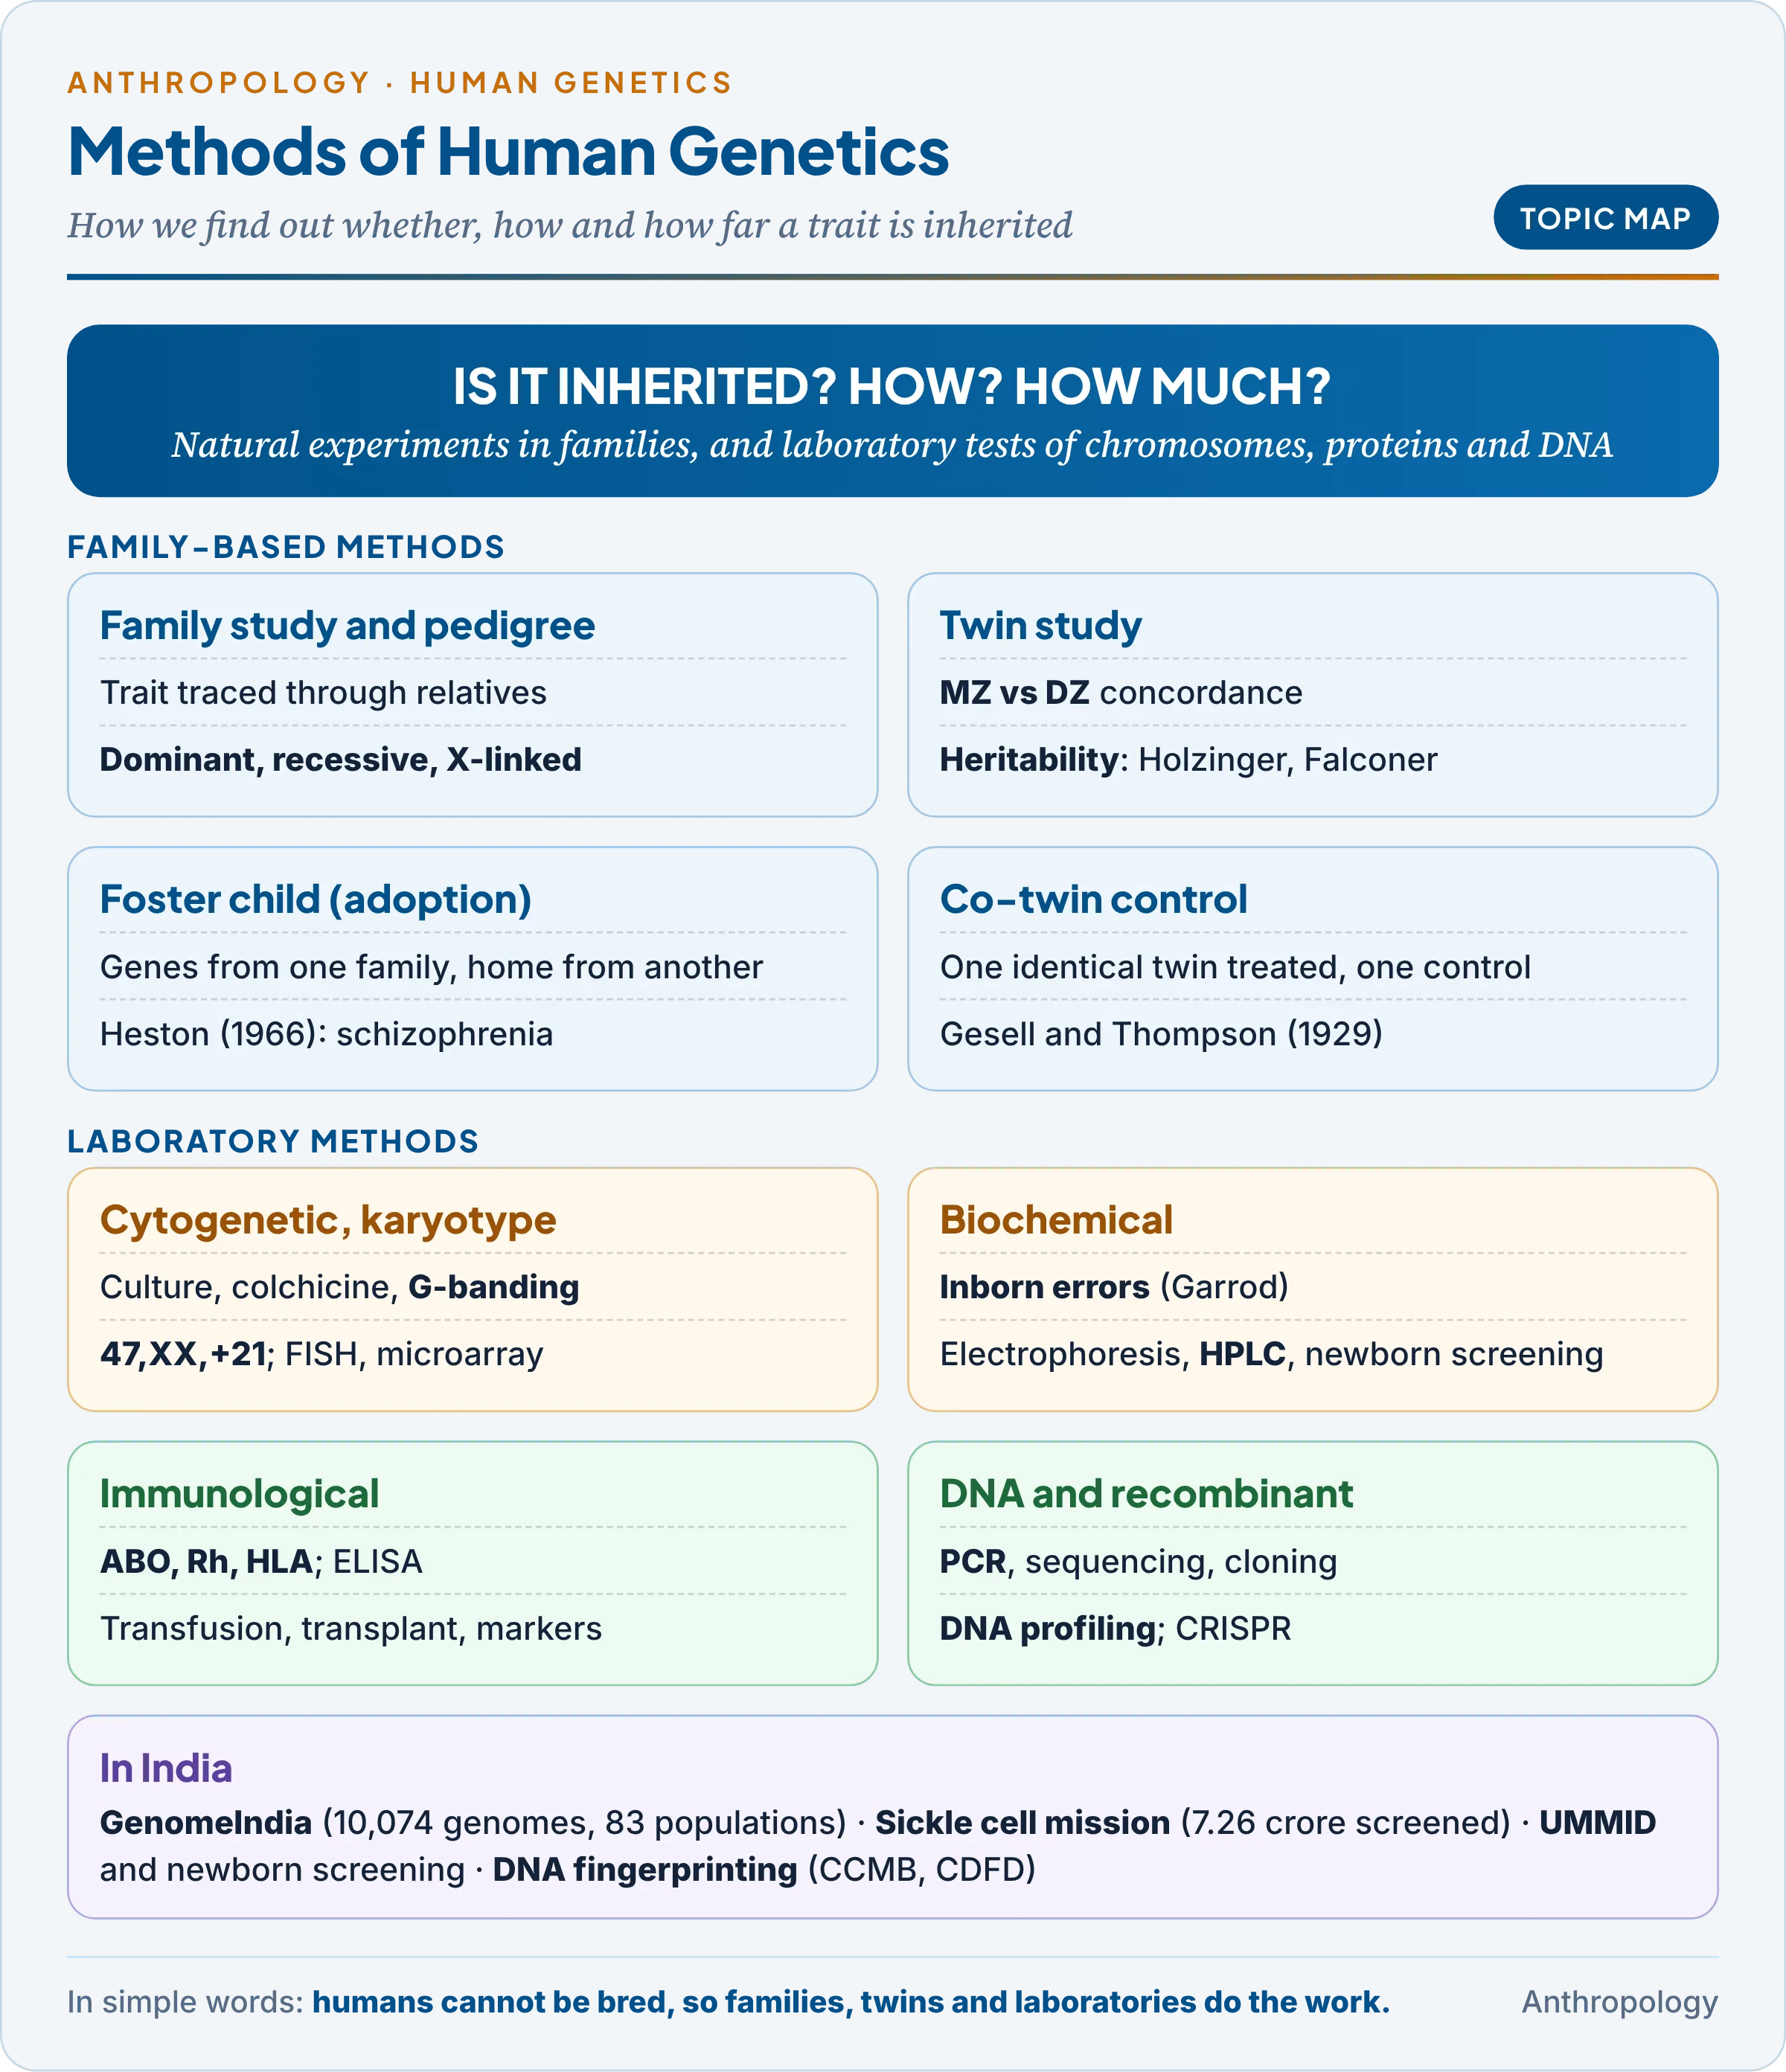
Since experiments cannot be made, geneticists use situations that nature and society have already created, and laboratory methods that read the genetic material directly. The table matches each method to the question it answers; the rest of the unit explains each.
| Method | Question it answers | Key idea |
|---|---|---|
| Family study, pedigree | Is the trait inherited, and in which pattern? | Trace the trait through relatives |
| Twin study | How much of the variation is genetic? | Compare identical with fraternal twins |
| Foster child (adoption) | Genes or home environment? | Compare adoptees with biological and adoptive parents |
| Co-twin control | What does one factor do, genes held equal? | Treat one identical twin; use the other as control |
| Cytogenetic, karyotype | Is a chromosome missing, extra or broken? | Stain and arrange chromosomes |
| Biochemical | Which protein or enzyme is faulty? | Measure gene products |
| Immunological | Which antigens does a person carry? | Antigen–antibody reactions |
| DNA and recombinant | What is the exact DNA difference? | Cut, copy, read and transfer DNA |
The first four are statistical, whole-person methods that infer genes from resemblance among relatives; the last four are laboratory methods that read the genes or their products. The history of human genetics is a move from the first group to the second, but the family methods remain the starting point in every clinic.
- Heredity and environment: the English polymath Francis Galton (cousin of Darwin) coined the pairing “nature and nurture” (1874). Every method in this unit tries to separate the two, yet most traits depend on both and on their interaction (G × E): a tall genotype grows tall only with enough food.
- Variation within and between groups: the American geneticist Richard Lewontin (1972) found that about 85 per cent of human genetic variation lies within populations and only a small share between so-called races. This is the basis of the view that genetic similarities far outweigh racial differences (Unit 9.5).
2. Family Study and Pedigree Analysis
In simple words
A pedigree is a family tree drawn with special symbols to show who has a trait or disease. By looking at who is affected in each generation, a geneticist can tell whether the trait follows a dominant, recessive or sex-linked pattern, and can estimate the risk for future children.
2.1 Family study
A family study compares how often a trait appears among relatives of affected persons with how often it appears in the general population. Relatives share genes in known proportions (a parent and child share half: the coefficient of relationship is ½), so familial clustering that rises with closeness of kinship suggests a genetic cause.
- Galton‘s Hereditary Genius (1869) traced eminence through families, confusing inherited ability with inherited advantage.
- The English physician Archibald Garrod (1902) noticed that alkaptonuria (urine turning black) appeared in brothers and sisters whose parents were often first cousins: the first human trait shown to follow Mendelian recessive inheritance.
- Limit: families share homes as well as genes, so clustering alone cannot separate heredity from environment; twin and adoption studies are needed for that.
2.2 Pedigree symbols
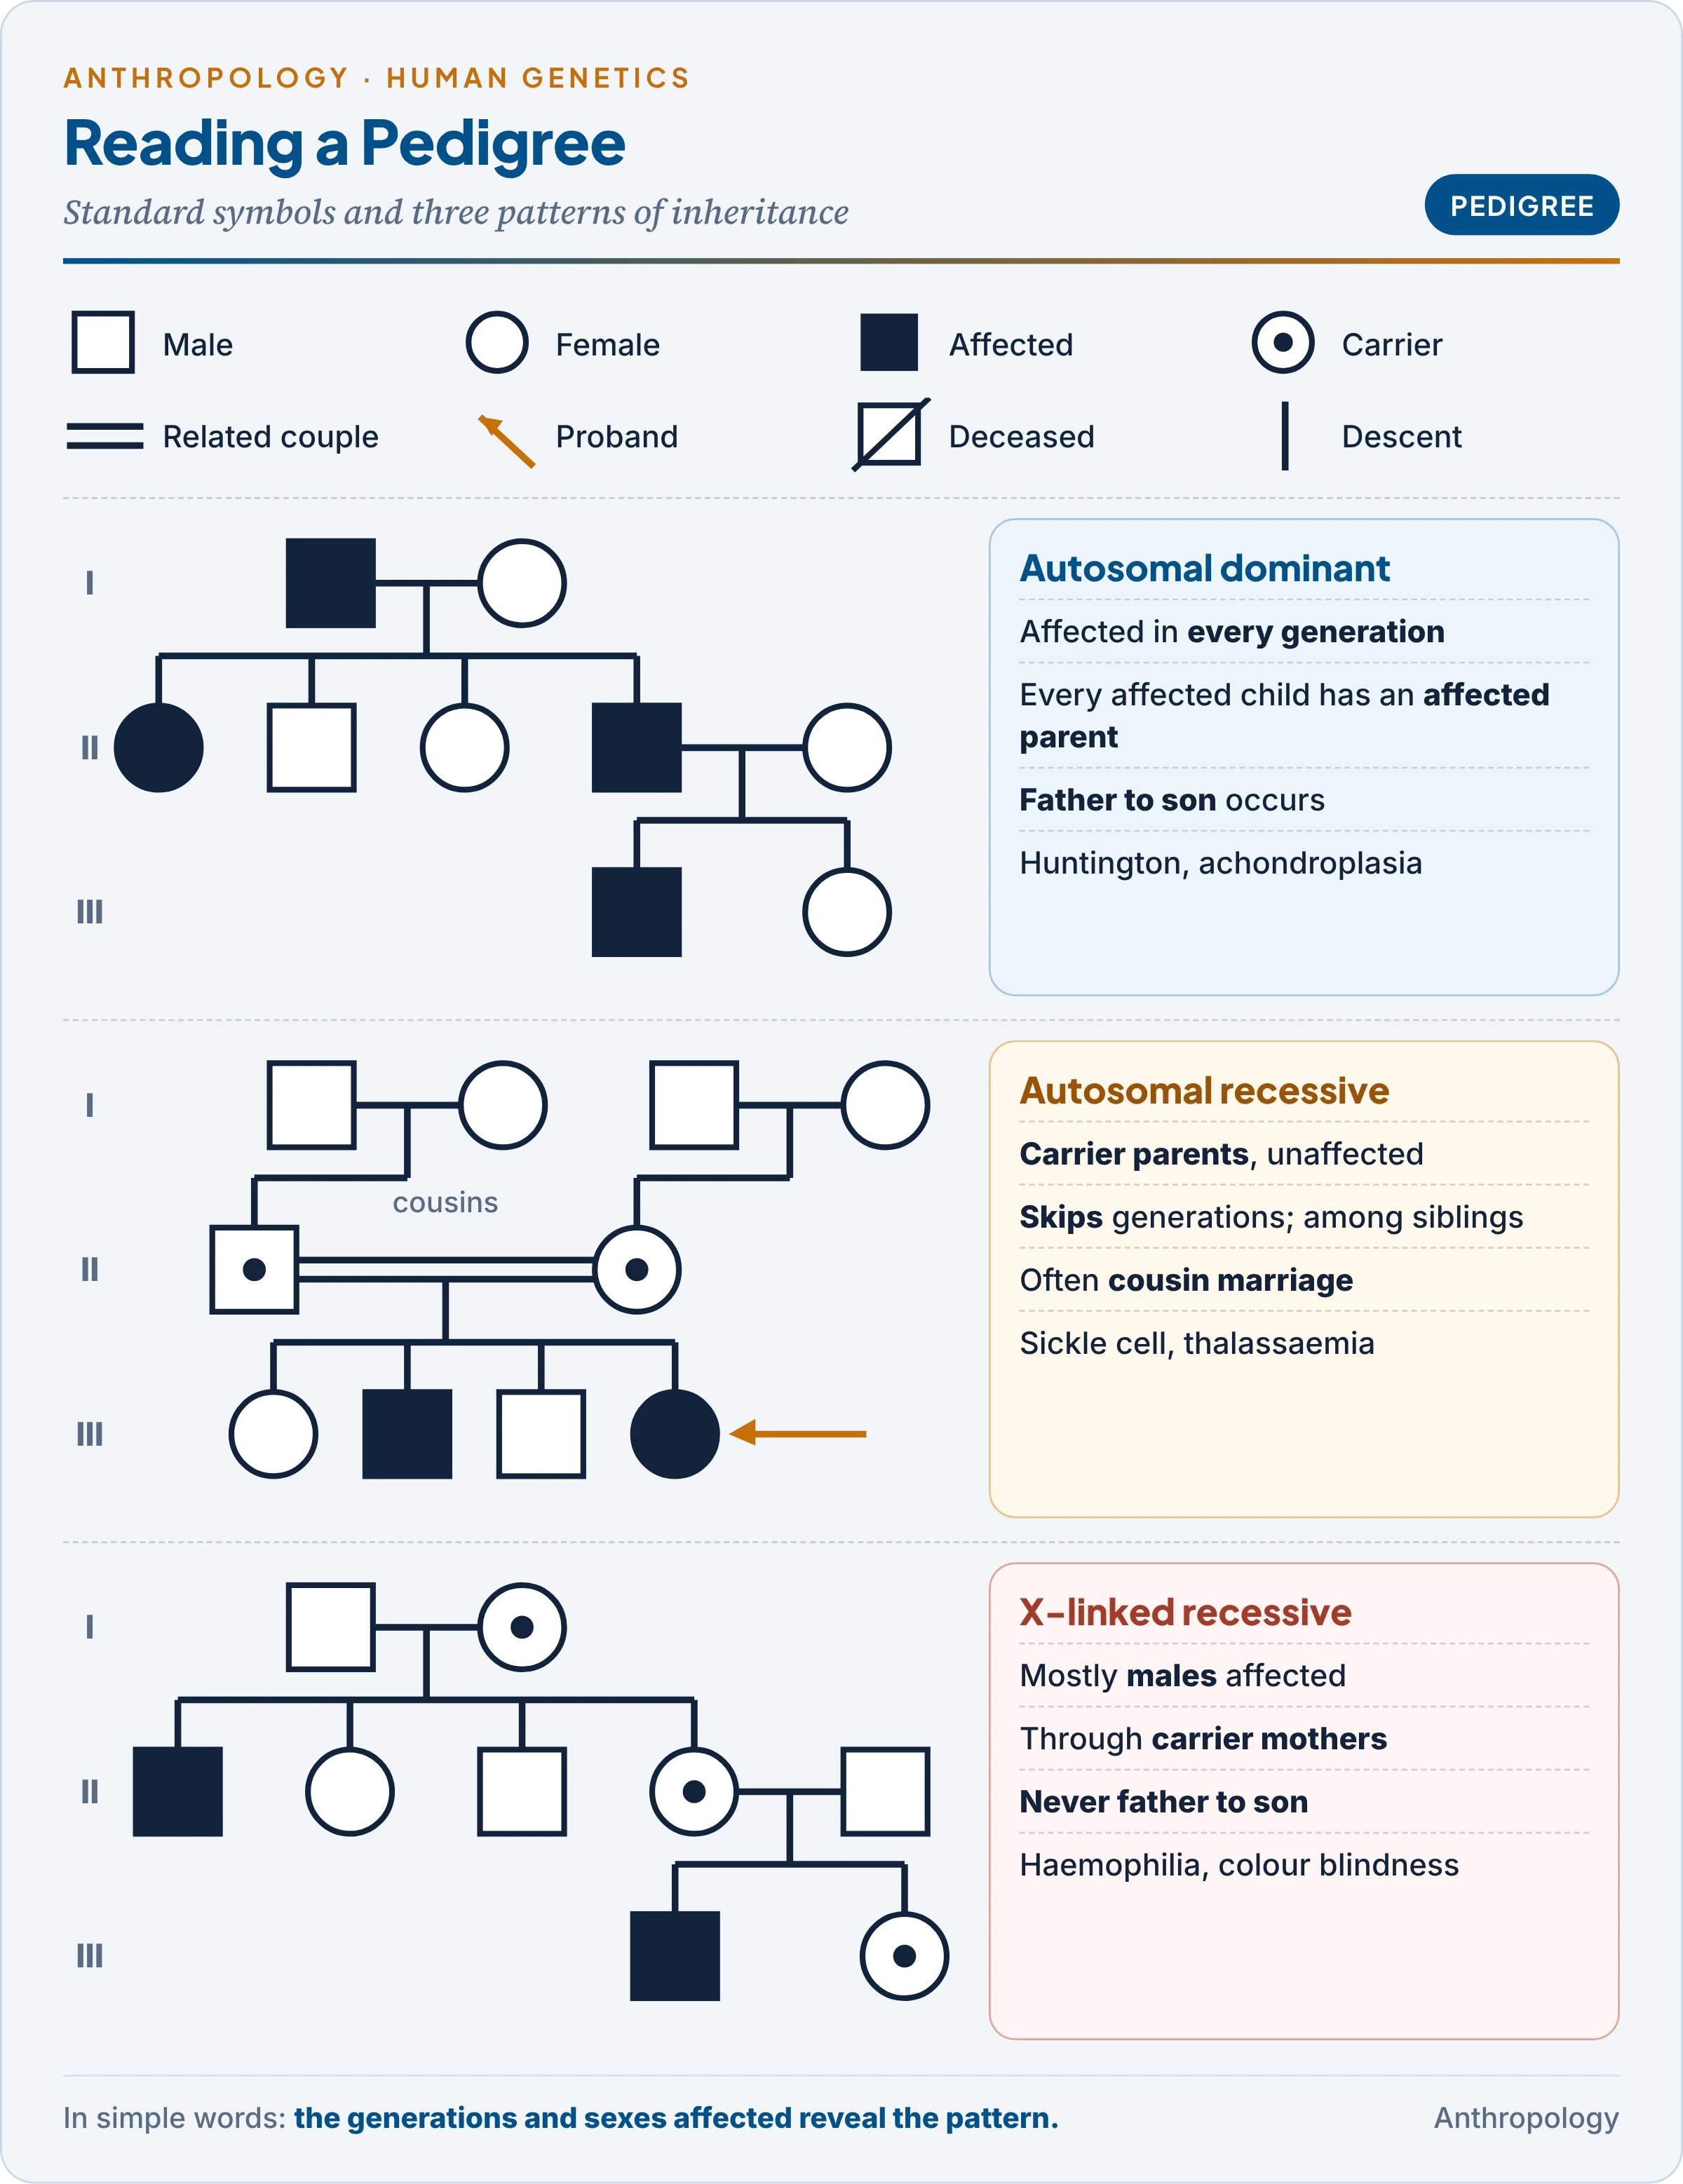
A pedigree is a chart of a family showing the transmission of a trait across generations. Standard symbols were set out by the American National Society of Genetic Counselors (Bennett and colleagues, 1995; revised 2008 and 2022):
- Square male, circle female, diamond sex unknown; filled symbol = affected; half-filled or central dot = carrier.
- Horizontal line = mating; double line = consanguineous mating (between relatives); vertical line to a horizontal sibship line = children.
- Diagonal slash = deceased; arrow = proband (the person through whom the family came to notice; propositus if male, proposita if female).
- Twins: two lines from one point; a short bar joining them marks identical twins.
- Roman numerals number generations (I, II, III); Arabic numerals number individuals within a generation (II-3).
2.3 Reading the pattern
The power of a pedigree lies in a few rules. Each pattern leaves a recognisable signature; the table lists them, and the diagram shows three side by side.
| Pattern | Signature in the pedigree | Examples |
|---|---|---|
| Autosomal dominant | Every affected person has an affected parent; appears in every generation (vertical); both sexes equally; father to son possible; unaffected members do not pass it on | Huntington disease, achondroplasia, brachydactyly, polydactyly |
| Autosomal recessive | Usually born to unaffected carrier parents; skips generations (horizontal, among siblings); both sexes; consanguinity common | Sickle-cell disease, β-thalassaemia, albinism, phenylketonuria |
| X-linked recessive | Mostly males; passed through carrier mothers; never father to son; affected men’s daughters are all carriers | Haemophilia (Queen Victoria’s descendants), red-green colour blindness, Duchenne muscular dystrophy, G6PD deficiency |
| X-linked dominant | Affected father → all daughters, no sons; affected mother → half of all children | Hypophosphataemic (vitamin D-resistant) rickets |
| Y-linked (holandric) | Father to all sons only | SRY (male determination), some male-infertility genes |
| Mitochondrial | Mother to all children; never through fathers | Leber hereditary optic neuropathy |
The three questions that decide most pedigrees follow from the table: Does it skip generations? (recessive). Are males mostly affected, with no father-to-son transmission? (X-linked recessive). Does it pass from father to son? (rules out X-linkage). Older textbooks also list hairy ear rims and webbed toes as Y-linked; these claims rest on doubtful pedigrees and are not accepted today.
2.4 Uses and limits
- Genetic counselling: a pedigree is the first step in counselling. It identifies the pattern, the carriers and the risk to a future child (§10), and guides who should be tested. India’s sickle-cell mission issues genetic status cards so that carriers can use this information before marriage.
- Proving inheritance: to show that a disorder is inherited and how, a geneticist moves step by step: familial clustering → pedigree pattern → twin concordance (§3) → adoption comparison (§4) → segregation ratios (do 1 in 4 children of carrier parents get it?) → linkage and DNA testing (§8).
- Limits: small families; missing or wrong information (an adoption or non-paternity hidden); incomplete penetrance (a carrier of a dominant gene who shows no sign) and variable expressivity; new mutations; and phenocopies (the same symptoms from a non-genetic cause).
- Pedigree and genealogy: the anthropologist’s genealogical method (Rivers, 1900) records social kinship; the pedigree is its biological use, following a trait (Unit 8b).
3. Twin Study
In simple words
Identical twins share all their genes; non-identical twins share about half, like ordinary brothers and sisters. If identical twins resemble each other much more than non-identical twins for a trait, genes must matter for that trait. This comparison lets us estimate how much of the difference between people is due to genes.
If one identical twin has schizophrenia, the other has it in roughly 48 per cent of cases; for non-identical twins the figure is about 17 per cent (the American psychologist Irving Gottesman, 1991). Since both kinds of twins share a womb, a home and an age, the much higher concordance of identical twins points to genes. Yet it is not 100 per cent, so genes are not the whole story.
3.1 How twins form
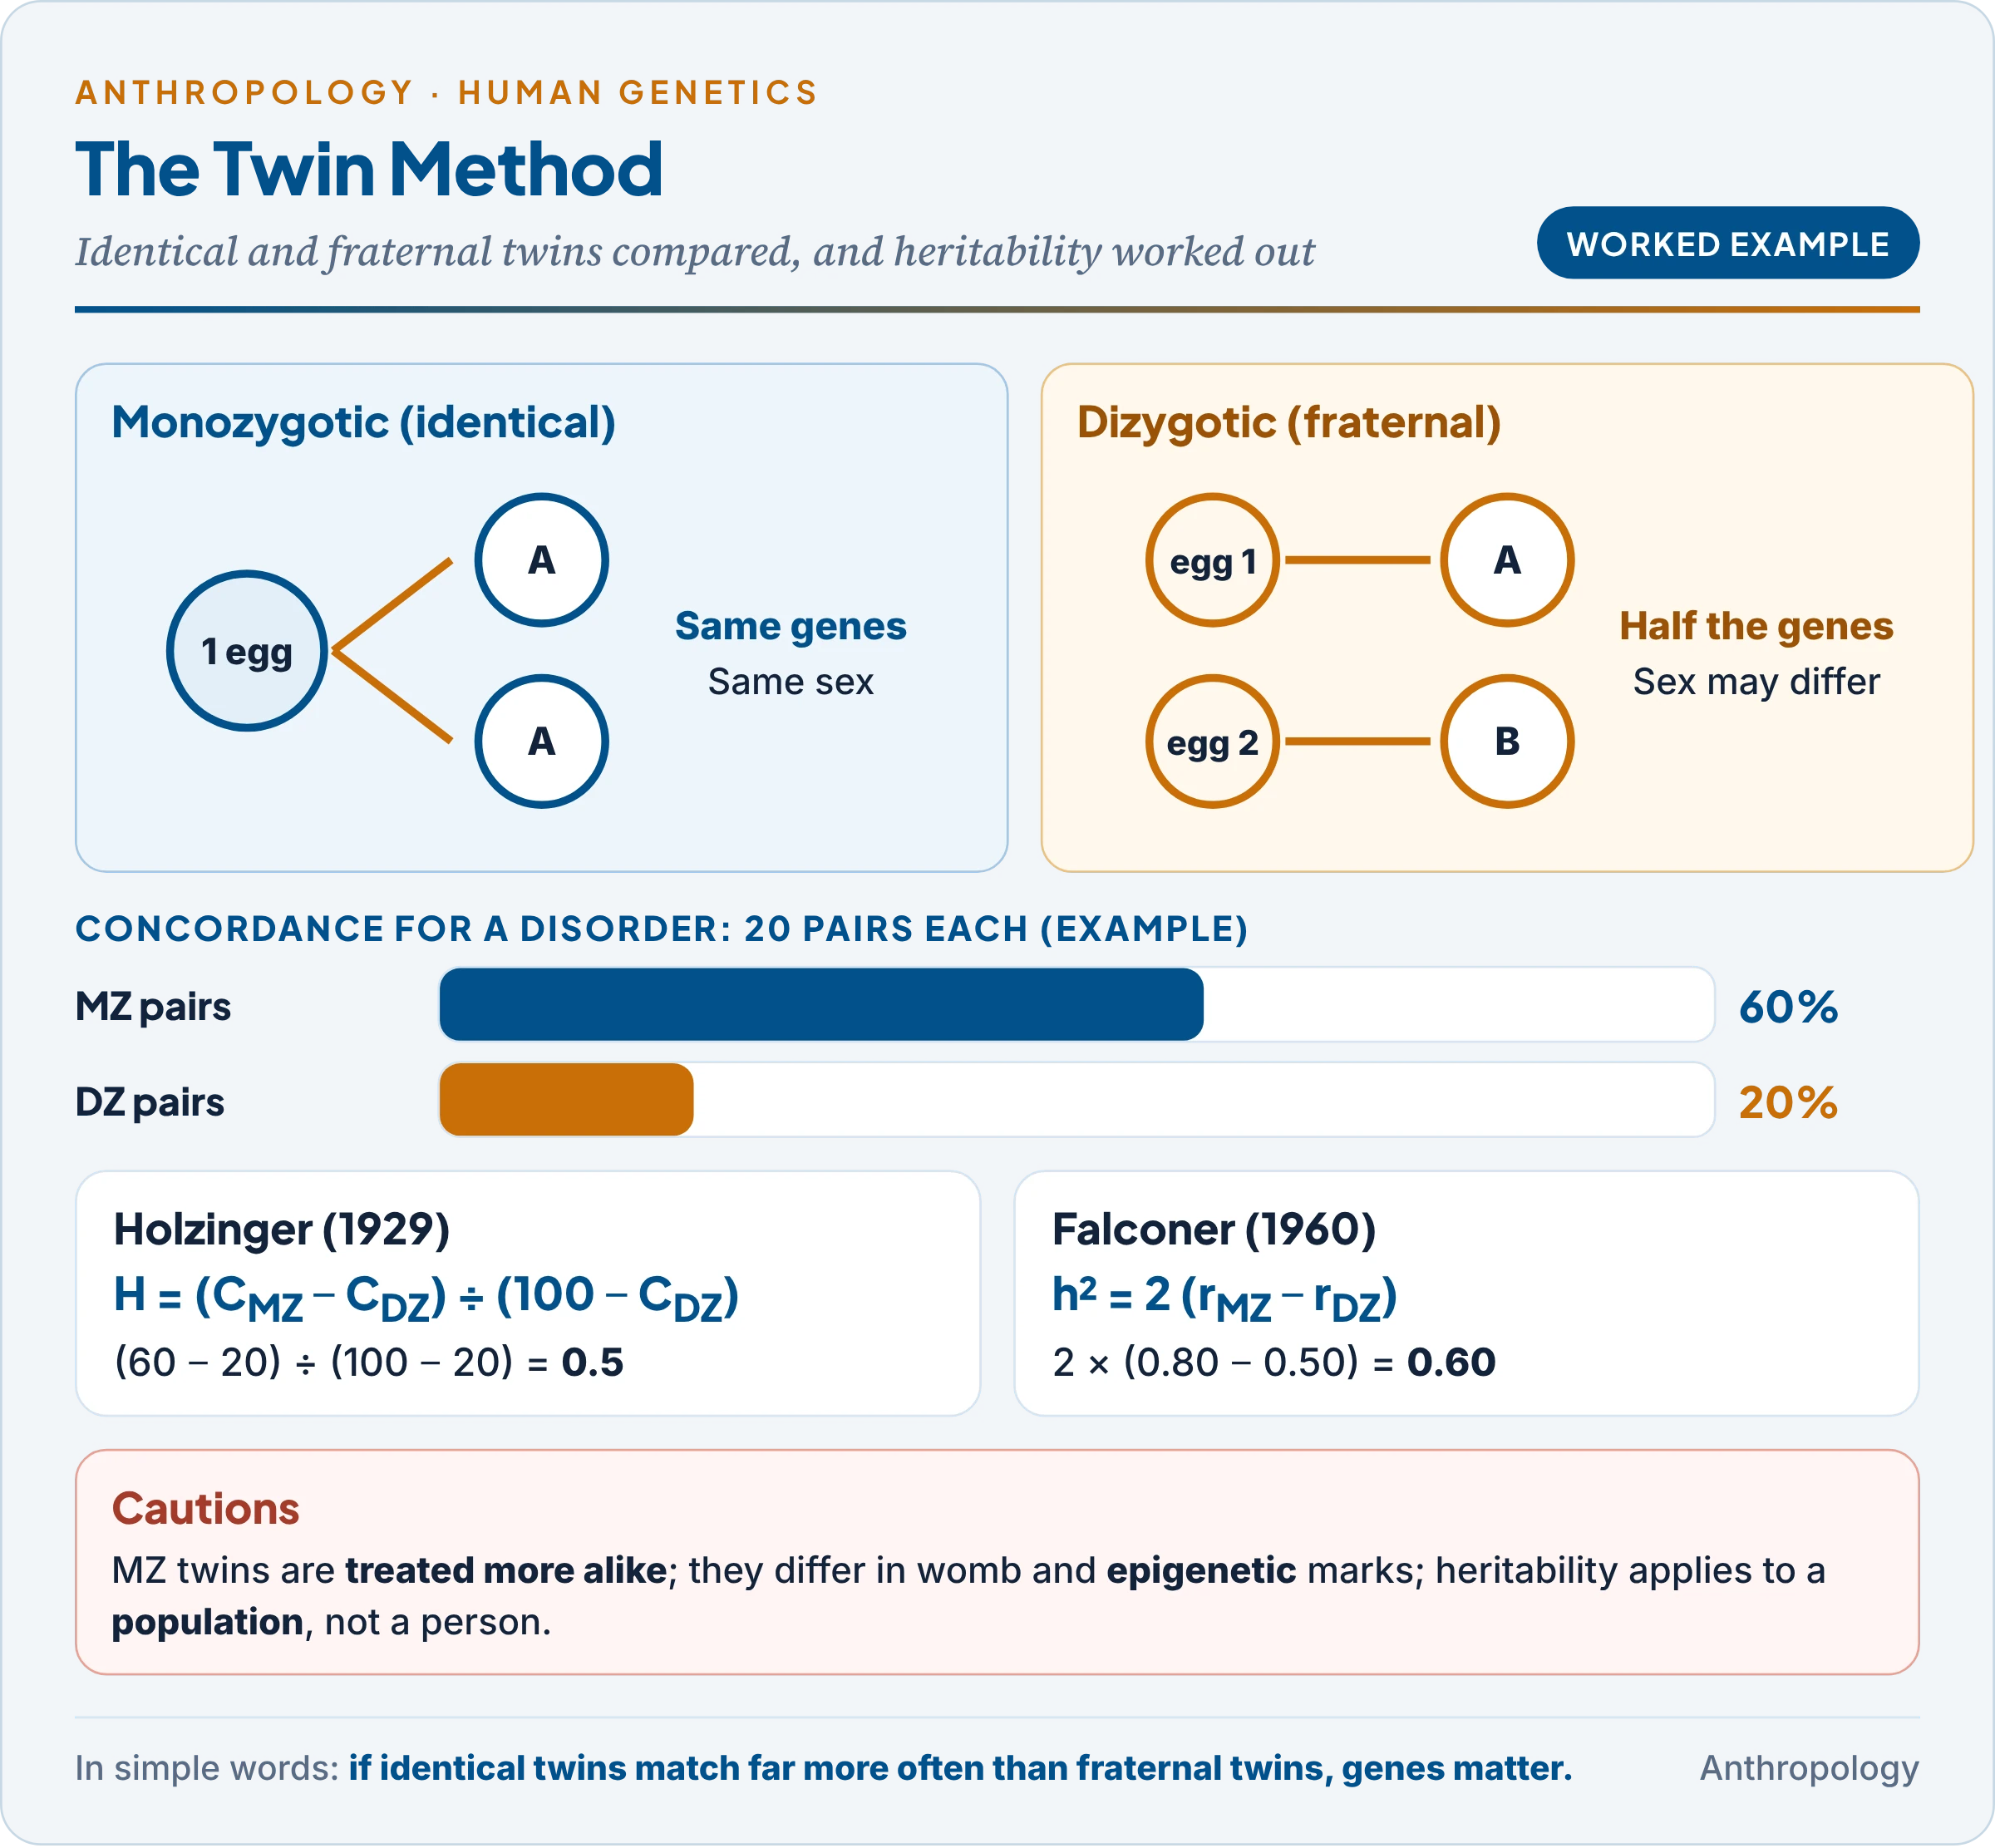
- Monozygotic (MZ, identical) twins: one fertilised egg splits into two embryos. They carry the same genes and are always of the same sex. The timing of the split decides the membranes: within about 3 days, two chorions and two amnions (dichorionic diamniotic); days 4–8 (the commonest), one chorion, two amnions (monochorionic diamniotic); days 8–13, one chorion, one amnion (monochorionic monoamniotic); later, conjoined twins.
- Dizygotic (DZ, fraternal) twins: two eggs fertilised by two sperm. They share on average half their genes, like siblings, and may be of different sexes.
- Frequency: MZ twinning is about 3.5–4 per 1,000 births everywhere; DZ twinning varies: about 2 per 1,000 in Japan and China, 6–9 in India and Europe, and about 40 among the Yoruba of Nigeria (the British geneticist Michael Bulmer, The Biology of Twinning in Man, 1970). DZ twinning runs in families on the mother’s side and rises with maternal age; MZ twinning does not.
3.2 History of the method
- Galton (1875, “The History of Twins”) first used twins to weigh nature against nurture, though he did not clearly separate the two kinds.
- The German dermatologist Hermann Werner Siemens (1924) and the American psychologist Curtis Merriman (1924) made the formal comparison of MZ with DZ twins: the classical twin method. Siemens’s “twin rule of pathology”: a heritable condition is more concordant in MZ than in DZ twins.
- The American statistician Karl Holzinger (1929) gave the first heritability index; with Horatio Newman and Frank Freeman he studied 19 pairs of identical twins reared apart (Twins: A Study of Heredity and Environment, 1937).
3.3 Diagnosing zygosity
- Placenta and membranes: a single chorion proves MZ twins; two chorions occur in both kinds, so this test is decisive only one way.
- Similarity method: comparing sex, blood groups and other genetic markers, dermatoglyphics (finger-ridge patterns) and physical traits; any genetic difference proves DZ. Historically, a skin graft accepted between twins indicated MZ.
- DNA markers: today DNA profiling at many short tandem repeat loci (§8.4) settles zygosity with near certainty.
3.4 Concordance and heritability
- Concordant pair: both twins have the trait (or both lack it); discordant: only one has it. For an all-or-none trait (a disease), compare concordance in MZ and DZ pairs; for a measurable trait (height, IQ), compare correlations.
- Pairwise concordance = concordant pairs ÷ all pairs. Probandwise concordance counts each affected twin who brought a pair to notice, and is the proportion of co-twins of affected persons who are also affected; it is the better guide to risk (§10).
- Heritability is the proportion of the variation in a trait, in a given population and environment, that is due to genetic differences. In broad sense (H² = genetic variance ÷ total variance) it includes all gene effects; in narrow sense (h²) only the additive effects that make offspring resemble parents.
- Holzinger’s index: from concordance, H = (C_MZ − C_DZ) ÷ (100 − C_DZ); from within-pair variance, H = (V_DZ − V_MZ) ÷ V_DZ, where V is the variance of the differences between twins of a pair. If genes count for much, MZ pairs differ little (V_MZ small) and H approaches 1.
- Falconer’s formula (the British geneticist Douglas Falconer, 1960): h² = 2(r_MZ − r_DZ), because MZ twins share twice the genetic resemblance of DZ twins. The part of the MZ correlation not explained by genes is the shared family environment (c² = r_MZ − h²).
- Twins reared apart: the Minnesota Study of Twins Reared Apart (the American psychologist Thomas Bouchard and colleagues, Science, 1990) found that MZ twins raised in different homes were nearly as alike in IQ as those raised together, attributing about 70 per cent of IQ variance in that sample to genes.
3.5 Uses and criticism
- Uses: the genetic share of diseases (diabetes, schizophrenia), physical traits (stature: heritability around 0.8 in well-fed populations) and behaviour; and the environmental causes that make identical twins differ.
- Equal environments assumption: the method assumes MZ and DZ twins share environments equally. In fact MZ twins are treated more alike, which may inflate heritability.
- MZ twins are not perfectly identical: they differ through chorion type, placental blood supply, epigenetic marks (chemical tags on DNA that change gene activity) and rare new mutations.
- Heritability is often misread: it refers to a population in a particular environment, not to individuals, and says nothing about differences between groups. A trait can be highly heritable yet strongly changed by environment: average height rose sharply in the twentieth century.
Common confusion
Does a heritability of 0.8 for height mean that 80 per cent of my height comes from my genes? No. Heritability describes variation among people in a population, not the make-up of one person. A value of 0.8 means that, in that population and environment, 80 per cent of the differences in height between people are linked to genetic differences. Change the environment (improve nutrition for some) and the heritability changes too.
4. Foster Child (Adoption) and Co-Twin Methods
In simple words
Adopted children get their genes from one set of parents and their upbringing from another. If they resemble their birth parents more, genes matter; if they resemble their adoptive parents, upbringing matters. In the co-twin method, one identical twin is given a training or treatment and the other is not, so any difference must be due to that factor.
4.1 Foster child (adoption) method
An adopted child receives genes from the biological parents and environment from the adoptive parents. Comparing the child with both separates the two influences more cleanly than family studies, where the same parents supply both.
- Early studies: Frank Freeman, Karl Holzinger and Blythe Mitchell (Chicago, 1928) found foster children’s IQ related to the quality of the foster home; Marie Skodak and Harold Skeels (Iowa, 1949) found adopted children scoring well above their birth mothers, yet still correlated with them: evidence for both environment and heredity.
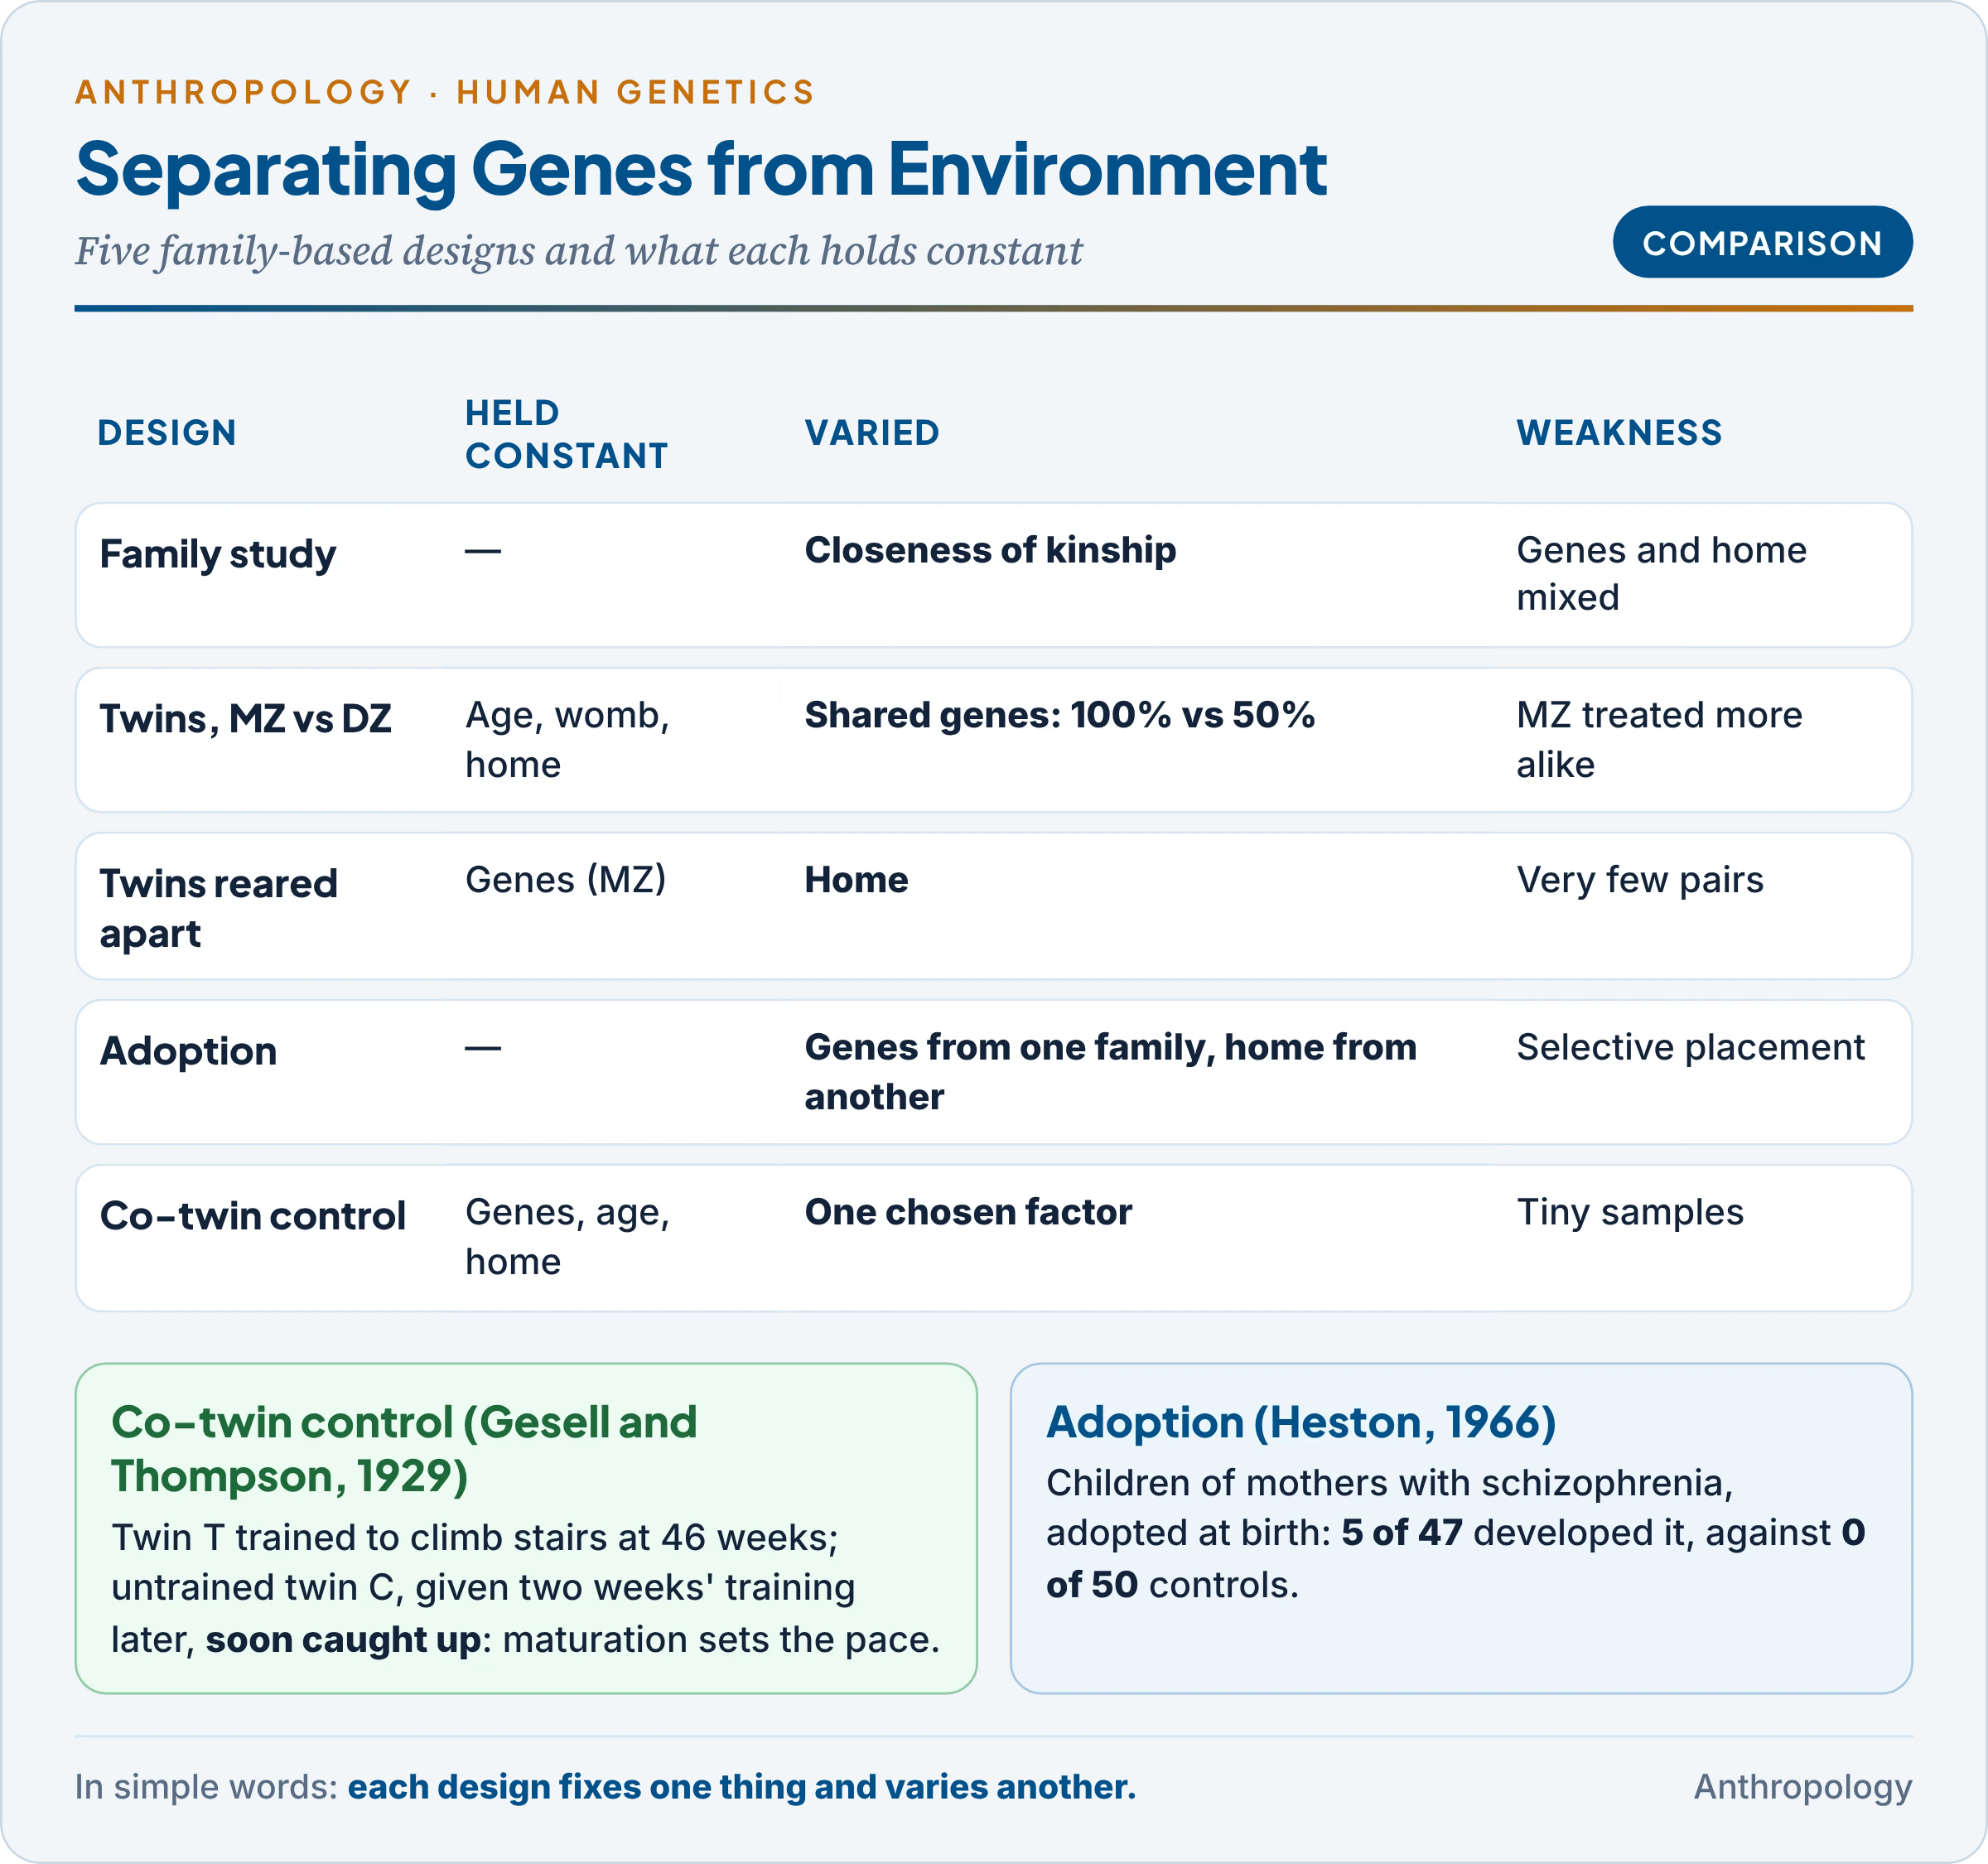
- Schizophrenia: the American psychiatrist Leonard Heston (1966) followed 47 children of mothers with schizophrenia who had been adopted away at birth: five developed the illness, against none of 50 control adoptees. The Danish adoption studies (Seymour Kety, David Rosenthal and Paul Wender, from 1968) confirmed that risk follows biological, not adoptive, relatives.
- Requirements for a valid study: placement early, before the original home can influence the child; no selective placement (agencies often match children to similar homes, which mixes genes and environment); an adequate sample across social levels; and children from one population, so that ethnic differences do not confound results.
- Limits: prenatal environment comes from the birth mother; adoptive homes are usually better-off than average, narrowing the range of environments; records of birth fathers are often missing.
4.2 Co-twin control method
The co-twin control method uses a pair of identical twins as a natural experiment: one twin receives a training, diet or treatment; the other serves as the control. Since genes, age and home are the same, a difference can be credited to the factor tested.
- Classic study: the American psychologists Arnold Gesell and Helena Thompson (1929) trained one identical infant twin girl to climb stairs for six weeks from the age of 46 weeks; her untrained sister, given just two weeks of training later, soon caught up and climbed faster. Maturation, not early training, set the pace of learning.
- Today: the same logic is applied to discordant MZ pairs in observational data: one twin smokes, the other does not; one was exposed to a disease, the other was not. Any difference in outcome cannot be due to genes or family background.
- Limits: few twin pairs are available; results from a few pairs are hard to generalise; ethical limits on what can be imposed.
| Design | What is held constant | What varies | Main weakness |
|---|---|---|---|
| Family study | Nothing cleanly | Degree of kinship | Genes and home mixed |
| Twin (MZ vs DZ) | Age, womb, home | Genetic similarity (100% vs 50%) | Equal environments assumption |
| Twins reared apart | Genes (MZ) | Home | Few pairs; similar placements |
| Adoption | — | Genes from one family, home from another | Selective placement; prenatal environment |
| Co-twin control | Genes, age, home | One chosen factor | Very small samples |
The table shows that each design holds a different thing constant, and each has a different weakness. Conclusions are strongest when several designs agree, as they do for schizophrenia: family, twin and adoption evidence all point to a substantial genetic component.
5. Cytogenetic Methods: Chromosome and Karyotype Analysis
In simple words
Cytogenetics studies chromosomes under the microscope. Cells are grown, stopped at the moment chromosomes are most compact, stained to show bands, photographed and arranged in pairs. This picture, the karyotype, reveals missing, extra or broken chromosomes.
5.1 Milestones
- 1956: Joe Hin Tjio and Albert Levan established the human number as 46 (Unit 1.7).
- 1959: Jérôme Lejeune and colleagues found an extra chromosome 21 in Down syndrome; the same year Charles Ford described 45,X in Turner syndrome and Patricia Jacobs and John Strong 47,XXY in Klinefelter syndrome (Unit 9.4).
- 1960: Peter Nowell found that phytohaemagglutinin (a bean extract) makes lymphocytes divide in culture, and with David Hungerford described the Philadelphia chromosome of chronic myeloid leukaemia, the first chromosome change linked to a cancer. Banding followed in 1970 (Torbjörn Caspersson).
5.2 Preparing a karyotype
- Sample: usually peripheral blood (lymphocytes); also bone marrow, skin fibroblasts, amniotic fluid or chorionic villi for prenatal diagnosis.
- Culture about 72 hours with phytohaemagglutinin to stimulate division.
- Arrest at metaphase with colchicine (or colcemid), which blocks the spindle when chromosomes are most condensed.
- Hypotonic salt solution swells the cells and spreads the chromosomes; fixation in methanol and acetic acid.
- Spreading on slides and banding: commonly G-banding (trypsin, then Giemsa stain).
- Analysis: count at least 15–20 cells (more to detect mosaicism, the presence of two cell lines in one person); photograph; arrange the 22 pairs of autosomes by size and centromere position, then the sex chromosomes.
- Report in the international shorthand (ISCN): 46,XY (normal male), 47,XX,+21 (female with Down syndrome), 45,X (Turner), 47,XXY (Klinefelter), 46,XX/45,X (a mosaic).
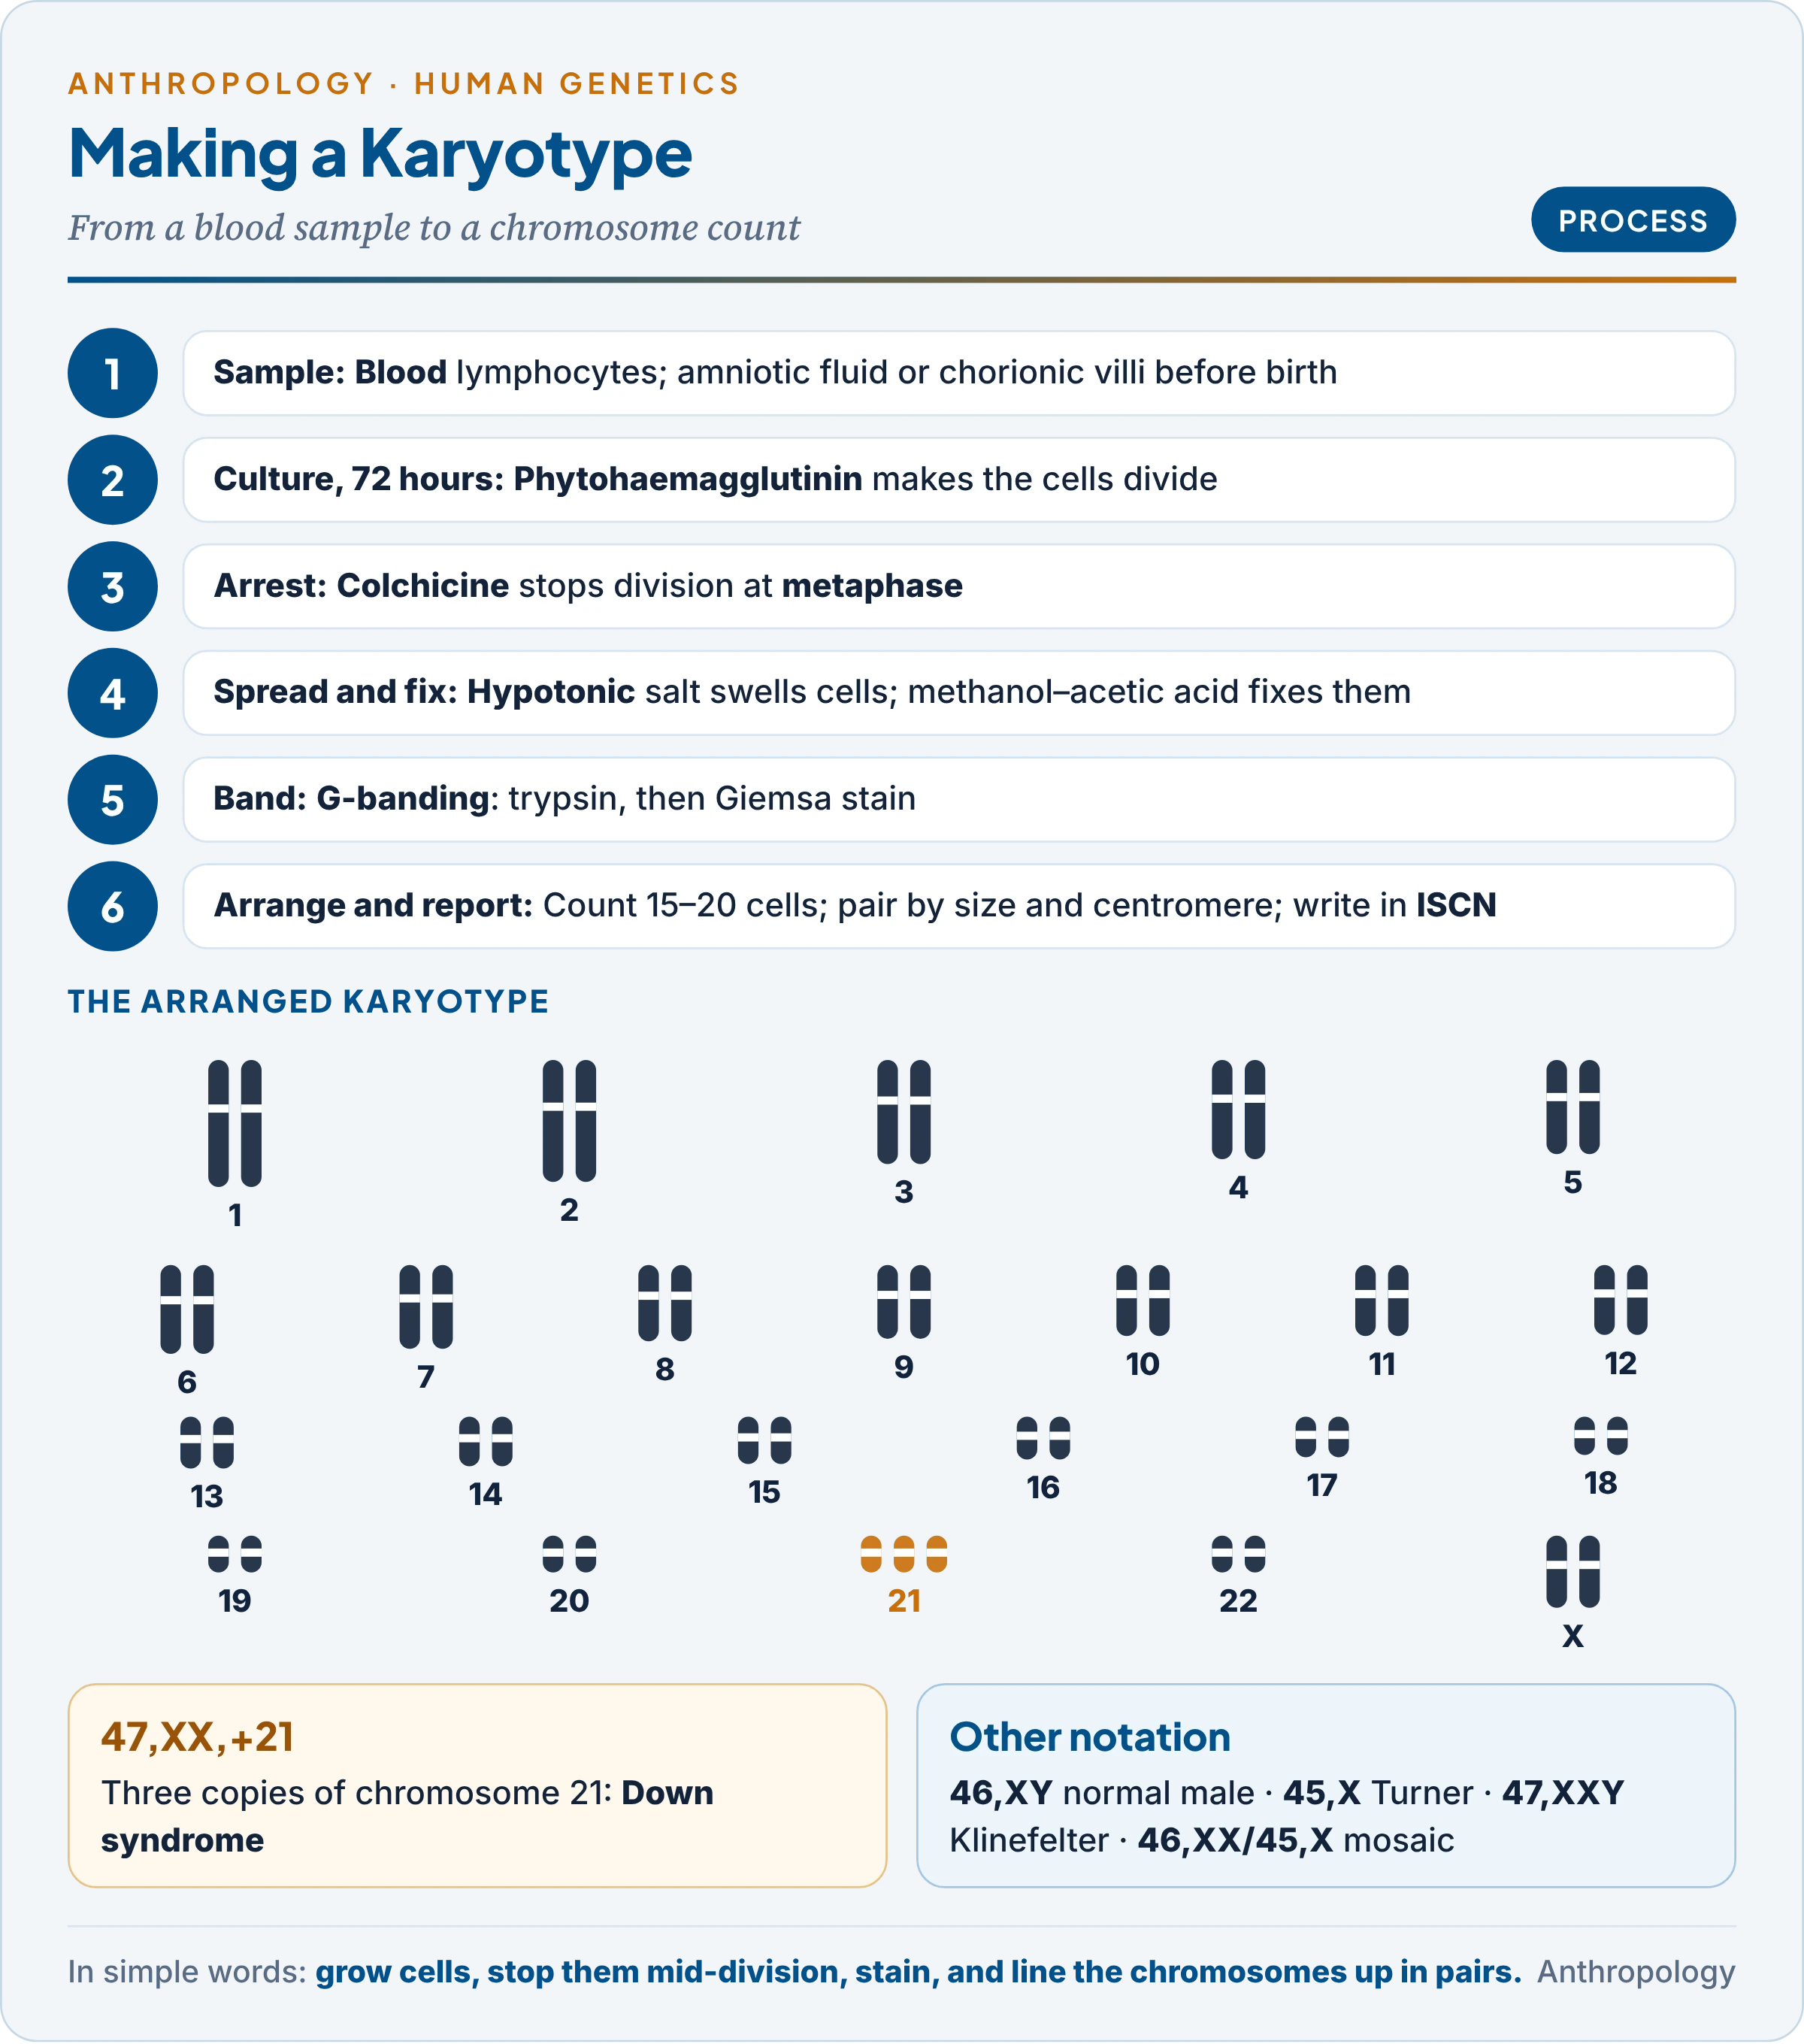
- Banding types: Q (quinacrine, fluorescent; Y chromosome bright), G (Giemsa; dark bands rich in A–T), R (reverse of G), C (constitutive heterochromatin near centromeres).
- An ideogram is a standard diagram of the banded chromosomes, drawn from measurements of many cells; a karyotype is the arranged picture of one cell.
5.3 Molecular cytogenetics
- FISH (fluorescence in situ hybridisation): a fluorescent DNA probe binds to one chromosome region, showing microdeletions too small for the microscope (DiGeorge syndrome, 22q11) or counting chromosomes in non-dividing cells.
- Chromosomal microarray (array CGH): compares a patient’s DNA with a reference across the whole genome, detecting small gains and losses; now the first test for unexplained developmental delay.
- Non-invasive prenatal testing: fragments of fetal DNA in the mother’s blood screen for trisomies without needle sampling.
5.4 Applications
- Diagnosis of numerical and structural aberrations, including sex-chromosome anomalies and their mosaic forms (45,X/46,XX; 46,XY/47,XXY), which are usually milder (Unit 9.4).
- Prenatal diagnosis and reproductive counselling (repeated miscarriage often traces to a parent’s balanced translocation).
- Cancer cytogenetics (Philadelphia chromosome).
- Evolution: humans have 46 chromosomes and the great apes 48; banding shows that human chromosome 2 arose by the fusion of two ape chromosomes.
6. Biochemical Methods
In simple words
Genes work by making proteins, many of which are enzymes that run the body’s chemistry. Biochemical methods measure these proteins and the substances they make or break down. A missing enzyme, or an unusual form of a protein, reveals a faulty gene.
6.1 From inborn errors to molecular disease
- Garrod called alkaptonuria, albinism, cystinuria and pentosuria “inborn errors of metabolism” (Croonian lectures, 1908): each a block in a chemical pathway caused by a recessive gene.
- George Beadle and Edward Tatum (1941), working on bread mould, proposed “one gene, one enzyme”: each step in a pathway is catalysed by an enzyme made under one gene. (It is now “one gene, one polypeptide”, since some proteins are not enzymes and some have several chains.)
- Linus Pauling and colleagues (1949) showed that sickle-cell haemoglobin moves differently in an electric field: sickle-cell anaemia is a “molecular disease”. Vernon Ingram (1956–57) found the cause: one amino acid, glutamic acid replaced by valine at position 6 of the β chain.
6.2 The phenylalanine–tyrosine pathway
One pathway shows how enzyme blocks produce different diseases. Each arrow is an enzyme; a recessive mutation that removes it causes the disorder named.
- Phenylalanine → tyrosine (blocked: phenylketonuria, PKU; phenylalanine builds up and damages the brain unless a low-phenylalanine diet starts early).
- Tyrosine → melanin (blocked: albinism).
- Tyrosine → homogentisic acid → further breakdown (blocked: alkaptonuria, black urine and arthritis; earlier block: tyrosinosis).
- Tyrosine → thyroid hormones (blocked: one form of goitrous cretinism).
6.3 Techniques
- Electrophoresis separates proteins by electric charge (Oliver Smithies‘ starch gel, 1955, revealed many variants); HPLC (high-performance liquid chromatography) is the standard confirmatory test for haemoglobin variants such as HbS; enzyme assays measure one enzyme’s activity (for example G6PD).
- Newborn screening: the American microbiologist Robert Guthrie (1963) devised a test for PKU on a dried blood spot from a heel prick; tandem mass spectrometry now screens one spot for dozens of disorders.
6.4 Applications
- Diagnosis and carrier detection (sickle cell, thalassaemia, Tay-Sachs).
- Newborn screening for treatable conditions: in India, regional programmes (Kerala, Goa, Chandigarh) screen for congenital hypothyroidism, G6PD deficiency, congenital adrenal hyperplasia and others, but there is still no universal national programme.
- Population genetics: frequencies of protein and enzyme polymorphisms (haemoglobin, G6PD, haptoglobin, transferrin) map variation and selection, as in the link between sickle cell, G6PD deficiency and malaria in central India’s tribal belt (Units 9.3 and 9.6).
7. Immunological Methods
In simple words
The immune system recognises foreign substances, called antigens, and makes antibodies against them. Because people inherit different antigens on their blood cells and tissues, antigen–antibody tests can show which gene versions a person carries. Blood grouping and tissue typing are the best-known uses.
- Antigen and antibody: an antigen provokes an immune response; an antibody (immunoglobulin) is the protein made against it. Their reaction can agglutinate (clump) cells, precipitate dissolved antigens or lyse (burst) cells; cell-mediated immunity, by lymphocytes, causes transplant rejection.
- Blood groups: the Austrian-American physician Karl Landsteiner discovered the ABO groups (1901) by mixing serum and red cells: type A people carry anti-B antibodies, type B anti-A, O both and AB neither. Rh followed in 1940 (Landsteiner and Alexander Wiener); an Rh-negative mother carrying an Rh-positive baby can develop antibodies that destroy fetal red cells (haemolytic disease of the newborn).
- First population study: Ludwik and Hanka Hirszfeld (1919) typed soldiers of many nationalities on the Salonika front and found that ABO frequencies varied between populations, founding serological anthropology.
- HLA system: the French immunologist Jean Dausset (1958) found the first human leucocyte antigen; the HLA genes, on chromosome 6, are the most polymorphic in the genome and decide transplant compatibility.
- Techniques: haemagglutination typing; the Coombs test (1945) for antibodies coating red cells; ELISA (1971), which detects antigens or antibodies by a colour change; and monoclonal antibodies (Georges Köhler and César Milstein, 1975), identical antibodies from one cell clone used as precise reagents.
- Applications: safe transfusion and transplantation; prevention of Rh disease (anti-D injection); paternity exclusion before DNA tests (a child with a blood group neither parent could give); disease association (about nine in ten patients with ankylosing spondylitis carry HLA-B27); and population studies of genetic markers: ABO, Rh, HLA and the Gm immunoglobulin types (Unit 9.6).
8. DNA Technology and Recombinant Technologies
In simple words
DNA technology lets scientists cut DNA at chosen points, copy tiny amounts millions of times, read the order of its letters and move a gene from one organism into another. These tools diagnose disease, identify people, make medicines such as insulin and trace human history.
In 1988, at the Centre for Cellular and Molecular Biology in Hyderabad, the Indian geneticist Lalji Singh, using a probe developed from a snake (banded krait) DNA sequence, settled a parentage dispute with DNA fingerprinting; in 1991 such evidence was first accepted by an Indian court, in a Kerala paternity case. The Centre for DNA Fingerprinting and Diagnostics followed in Hyderabad (1996). The same tools now serve forensic science, medicine and anthropology.
8.1 The toolkit
- Restriction enzymes: bacterial “molecular scissors” that cut DNA at specific short sequences (Werner Arber, Hamilton Smith and Daniel Nathans; Nobel Prize 1978). DNA ligase is the “glue” that joins fragments.
- Gel electrophoresis separates DNA fragments by size; Southern blotting (Edwin Southern, 1975) transfers them to a membrane where a labelled probe finds one sequence.
- Vectors: plasmids (small circular bacterial DNA) and viruses that carry foreign DNA into a host cell.
8.2 Recombinant DNA technology
Recombinant DNA is DNA joined from two different sources. Stanley Cohen and Herbert Boyer (1973) first inserted foreign DNA into a plasmid and grew it in bacteria.
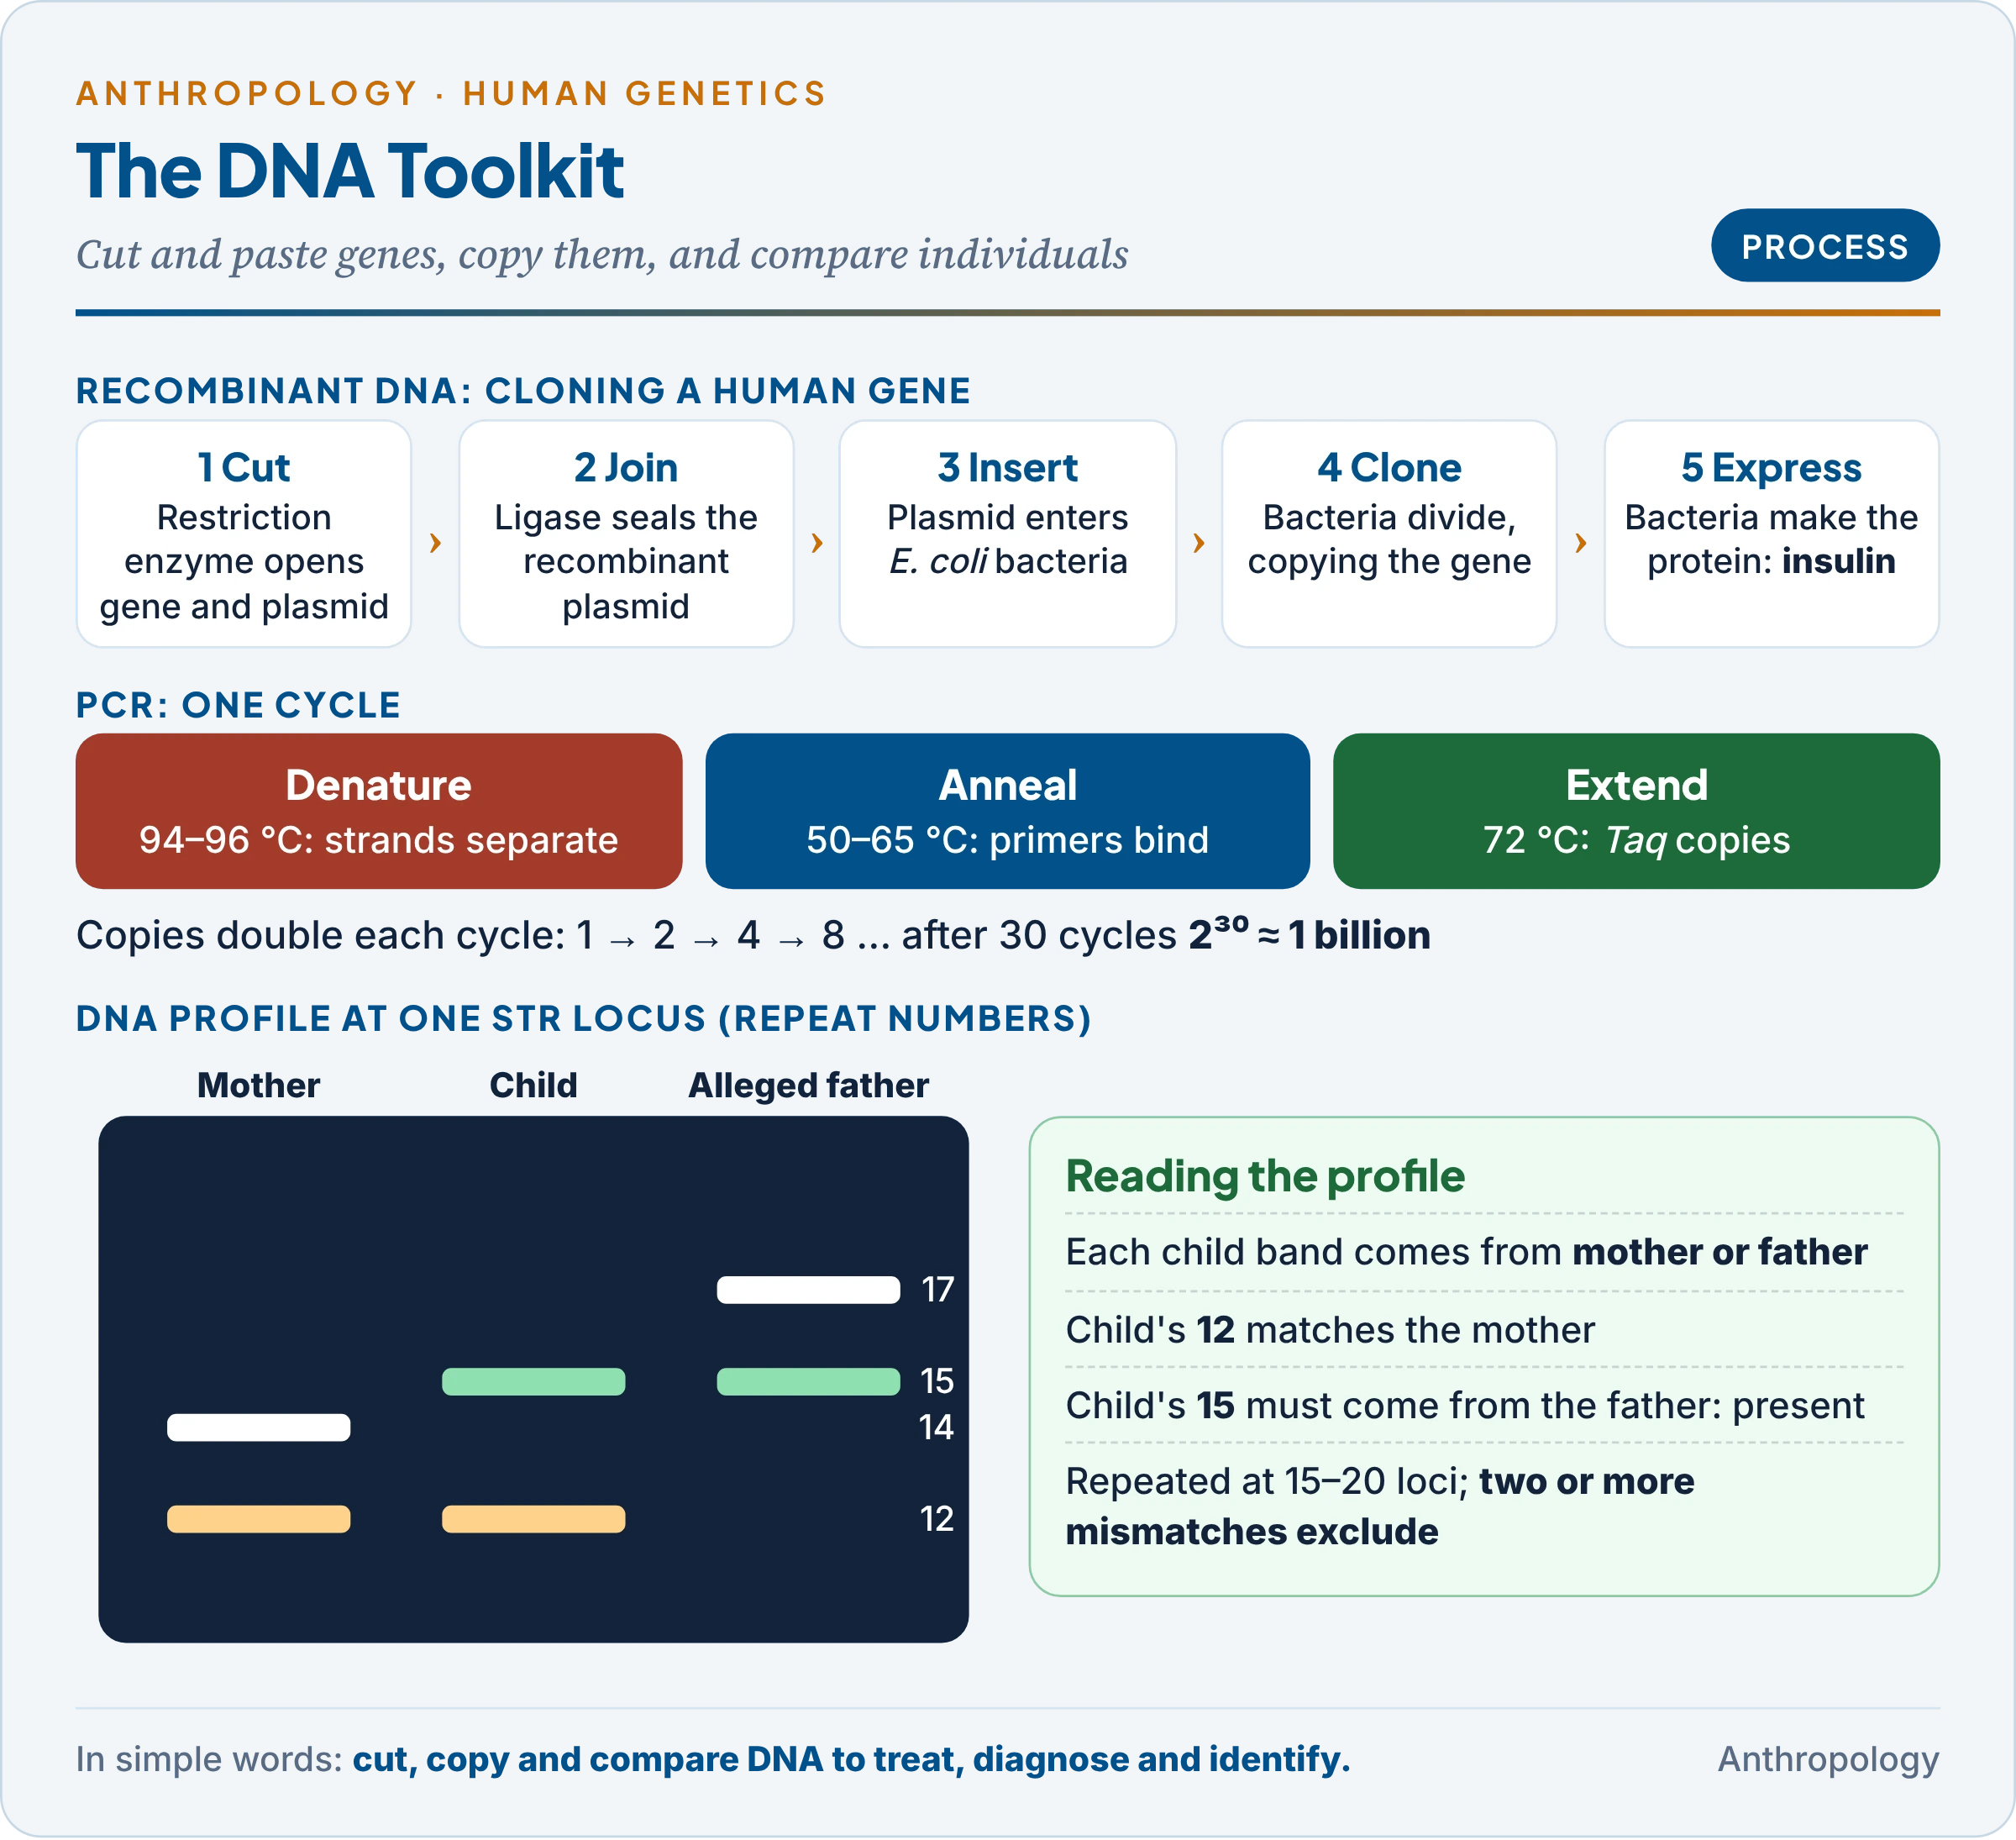
- Cut the human gene (for example, for insulin) and the plasmid with the same restriction enzyme, leaving matching “sticky ends”.
- Join them with ligase to make a recombinant plasmid.
- Insert it into Escherichia coli; each bacterium copies the plasmid as it divides (gene cloning).
- Select the bacteria carrying the gene and grow them; they make the human protein.
- Products: human insulin (made in bacteria from 1978; approved for patients in 1982), growth hormone, clotting factors, hepatitis B vaccine, interferons.
- Gene therapy: adding a working gene, or (with CRISPR–Cas9, Jennifer Doudna and Emmanuelle Charpentier, 2012; Nobel Prize 2020) editing a faulty one. Sickle-cell disease was among the first conditions treated by approved gene editing (2023).
8.3 PCR and sequencing
- Polymerase chain reaction (PCR): devised by the American chemist Kary Mullis (1983; Nobel Prize 1993). Each cycle has three steps: denaturation (about 94–96 °C: the two strands separate), annealing (about 50–65 °C: short primers bind on either side of the target) and extension (72 °C: the heat-stable Taq polymerase, from a hot-spring bacterium, copies the strand). Each cycle doubles the target, so 30 cycles give about a billion copies from a single molecule (§10).
- Sequencing: reading the order of bases. Frederick Sanger‘s chain-termination method (1977) uses modified bases that stop copying at A, T, G or C; Allan Maxam and Walter Gilbert (1977) used base-specific chemical cleavage (not restriction enzymes). The Human Genome Project (1990–2003) used Sanger sequencing; next-generation sequencing (from the mid-2000s) reads millions of fragments at once, making whole genomes cheap.
8.4 DNA fingerprinting and profiling
- Invented by the British geneticist Alec Jeffreys (Leicester, 1984) using minisatellites (VNTRs: short sequences repeated a variable number of times), whose band patterns are unique to each person except identical twins.
- Today: PCR-based profiling of short tandem repeats (STRs) at a standard set of loci (20 core loci in the US database) works on tiny or degraded samples.
- Logic of paternity: a child inherits one allele at each locus from each parent. If the child’s paternal allele is absent in the alleged father at several loci, he is excluded; if present at all loci, the probability of paternity is calculated (§10).
- Uses: crime investigation, paternity and immigration disputes, identification of disaster victims, wildlife forensics, and zygosity of twins.
8.5 DNA technology in anthropology and medicine
- Population history: genome-wide data showed that most Indians descend from a mixture of two ancestral groups, “Ancestral North Indians” and “Ancestral South Indians” (David Reich, Kumarasamy Thangaraj, Lalji Singh and colleagues, Nature, 2009); mitochondrial and Y-chromosome DNA trace migrations (Unit 1.7); ancient DNA revealed Neanderthal and Denisovan ancestry (Unit 1.6c).
- Medicine: carrier and prenatal diagnosis (thalassaemia, sickle cell), genome-wide association studies (GWAS: scanning the genomes of thousands of people for variants linked to a disease; Unit 9.4), pharmacogenomics (drug choice by genotype).
- Ethics: privacy of genetic data, informed consent, discrimination, and the misuse of prenatal tests for sex selection, which India’s PCPNDT Act, 1994 (Pre-Conception and Pre-Natal Diagnostic Techniques Act) prohibits.
Common confusion
Is DNA fingerprinting the same as sequencing a person’s genome? No. Sequencing reads the bases of DNA, potentially all three billion. DNA fingerprinting (profiling) looks at only a few highly variable spots (repeat lengths at about 15–20 loci) to tell individuals apart. A profile identifies a person but says almost nothing about health or ancestry; a genome sequence says a great deal, which is why it raises stronger privacy concerns.
9. Applications in India
In simple words
India uses these methods on a very large scale: mapping the genetic diversity of its many communities, screening millions of people in tribal areas for sickle-cell disease, testing newborns and pregnant women, and solving crimes and family disputes with DNA.
The table links each method to an Indian programme, showing that the syllabus methods are working tools of public policy.
| Programme (year) | Methods used | What it does |
|---|---|---|
| GenomeIndia (launched 2020; data released January 2025) | Whole-genome sequencing, biobank | 10,074 genomes from 83 populations (30 tribal, 53 non-tribal); about 2.7 crore rare variants, 70 lakh not seen in other databases; data at the Indian Biological Data Centre, Faridabad |
| National Sickle Cell Anaemia Elimination Mission (launched 1 July 2023, Shahdol) | Screening (solubility and point-of-care tests, confirmed by HPLC or electrophoresis), pedigree-based family screening, counselling | Ages 0–40 in 17 states; over 7.26 crore screened, about 2.48 lakh patients and 20.4 lakh carriers found (July 2026); genetic status cards; target of elimination by 2047 |
| UMMID initiative (DBT, 2019) | Biochemical, cytogenetic and molecular diagnosis, counselling | NIDAN Kendras in government hospitals; training clinicians; screening pregnant women and newborns in aspirational districts |
| Newborn screening (regional) | Biochemical tests on dried blood spots | Congenital hypothyroidism, G6PD deficiency and others in Kerala, Goa, Chandigarh |
| DNA fingerprinting (CCMB 1988; CDFD 1996) | DNA profiling | Paternity, crime and identification cases |
The pattern is that India’s genetic burden is shaped by its social structure: endogamy and consanguinity concentrate recessive disorders in particular communities, which is why GenomeIndia sampled by population group and the sickle-cell mission targets tribal districts.
10. Worked Examples
In simple words
These examples show the formulas of this unit at work with simple numbers: twin concordance and heritability, pedigree risks, PCR copying and a DNA paternity test.
1. Concordance and Holzinger’s index. In a study, 20 MZ and 20 DZ twin pairs are checked for a disorder; 12 MZ pairs and 4 DZ pairs are concordant.
- C_MZ = 12/20 = 60 per cent; C_DZ = 4/20 = 20 per cent.
- H = (60 − 20) ÷ (100 − 20) = 40/80 = 0.5. Half of the liability is attributed to genes. Discordance is 40 per cent in MZ and 80 per cent in DZ pairs: genetic dissimilarity doubles the chance that twins differ.
2. Holzinger from variances. For a measurement, the within-pair variance is V_DZ = 40 and V_MZ = 10. H = (40 − 10) ÷ 40 = 0.75: three-quarters of the variation is genetic.
3. Falconer’s formula. Twin correlations for a trait are r_MZ = 0.80 and r_DZ = 0.50.
- h² = 2 × (0.80 − 0.50) = 0.60 (genes).
- Shared environment c² = r_MZ − h² = 0.80 − 0.60 = 0.20.
- Unique environment and error e² = 1 − r_MZ = 0.20. Check: 0.60 + 0.20 + 0.20 = 1.
4. Pairwise vs probandwise concordance. Among twin pairs with at least one affected member, 10 pairs are concordant and 20 discordant.
- Pairwise = 10 ÷ 30 = 33 per cent.
- Probandwise = (2 × 10) ÷ (2 × 10 + 20) = 20/40 = 50 per cent: half the co-twins of affected persons are affected.
5. Pedigree risks.
- Autosomal recessive (sickle cell): carrier × carrier (AS × AS) → 1 AA : 2 AS : 1 SS. Risk of an affected child = 1/4 in each pregnancy; an unaffected sibling is a carrier with probability 2/3.
- X-linked recessive (haemophilia): carrier mother × normal father → 1/2 of sons affected, 1/2 of daughters carriers, no affected daughters.
- Autosomal dominant (Huntington): affected heterozygote × normal → 1/2 of children affected.
6. PCR. Starting from one target molecule, copies after n cycles = 2ⁿ. After 10 cycles: 1,024; after 30 cycles: 2³⁰ ≈ 1.07 × 10⁹ (about a billion).
7. A DNA paternity test at three STR loci (numbers are repeat counts):
| Locus | Mother | Child | Alleged father | Paternal allele present? |
|---|---|---|---|---|
| A | 12, 14 | 12, 15 | 15, 17 | Yes (15) |
| B | 8, 9 | 9, 11 | 10, 11 | Yes (11) |
| C | 6, 7 | 7, 10 | 6, 9 | No (10 absent) |
At locus C the child’s paternal allele (10) is missing from the alleged father. A single mismatch can be a mutation, so laboratories look at many loci; two or more mismatches normally exclude paternity.
Key Terms
| Term | Meaning in simple words |
|---|---|
| Pedigree | A family chart showing who has a trait across generations |
| Proband | The first family member brought to the geneticist’s notice |
| Carrier | A person with one copy of a recessive allele, usually healthy |
| Consanguineous mating | Marriage between blood relatives, such as cousins |
| Penetrance | How often a gene actually shows its effect in those who carry it |
| Monozygotic / dizygotic twins | Twins from one egg (identical) / from two eggs (fraternal) |
| Concordance | Both twins of a pair share the trait |
| Heritability | The share of differences between people in a population due to genetic differences |
| Co-twin control | Treating one identical twin and comparing with the other |
| Selective placement | Adoption agencies matching children to similar homes |
| Karyotype | A cell’s chromosomes photographed and arranged in pairs |
| Banding | Staining that gives each chromosome a pattern of stripes |
| Mosaicism | Two genetically different cell lines in one person |
| FISH | Using a glowing DNA probe to find one spot on a chromosome |
| Inborn error of metabolism | An inherited block in the body’s chemistry |
| Electrophoresis | Separating proteins or DNA in an electric field |
| HLA | Inherited tissue antigens that decide transplant matching |
| Restriction enzyme | A protein that cuts DNA at a specific sequence |
| PCR | A method that copies a piece of DNA millions of times |
| DNA profiling | Identifying a person from repeat lengths at many DNA spots |
Contemporary Developments
- GenomeIndia (2025): the genomes of 10,074 Indians from 83 populations were opened to researchers through the Indian Biological Data Centre in January 2025 and described in Nature Genetics (April 2025); populations are coded numerically, not named, to protect communities (Department of Biotechnology).
- Sickle-cell screening milestone (2026): the mission’s target of 7 crore screenings was reached ahead of schedule; by 26 July 2026 over 7.26 crore people had been screened, about 2.48 lakh patients and 20.4 lakh carriers identified, and 17 Centres of Excellence approved in 15 states (Lok Sabha replies, 31 July 2026).
- Genetic status cards and pre-marital counselling (2026): over 10.49 lakh cards had been distributed in Gujarat’s Valsad district alone, a large-scale use of carrier information in marriage decisions in tribal communities.
- NFHS-6 biomarkers (2026): the survey collected dried blood spots and finger-prick samples for laboratory tests alongside its schedules, showing how biochemical methods now sit inside national household surveys (International Institute for Population Sciences).
Diagrams to Master
- Topic map: the eight methods, grouped into family-based and laboratory methods.
- Pedigree patterns: symbols (square, circle, filled, dot, double line, arrow); AD (vertical), AR (horizontal, consanguinity), XR (males, carrier mothers, no father-to-son).
- Twin method: MZ vs DZ formation; concordance bars; H = (C_MZ − C_DZ)/(100 − C_DZ); h² = 2(r_MZ − r_DZ).
- Study designs: family, twin, reared apart, adoption, co-twin: held constant / varied / weakness.
- Karyotype workflow: PHA culture → colchicine → hypotonic → fix → G-band → arrange; ISCN 47,XX,+21.
- DNA toolkit: cut–join–insert–clone; PCR 94 / 55 / 72 °C, 2ⁿ; STR paternity check.
Revision Grid
| Scholar | Work (year) | Key idea |
|---|---|---|
| Francis Galton | Hereditary Genius (1869); “The History of Twins” (1875) | Family and twin methods; “nature and nurture” |
| Karl Landsteiner | 1901; Rh 1940 (with Wiener) | ABO and Rh blood groups |
| Archibald Garrod | 1902; Croonian lectures (1908) | Alkaptonuria; inborn errors of metabolism |
| Hirszfeld and Hirszfeld | 1919 | Blood groups vary between populations |
| Siemens; Merriman | 1924 | Classical MZ–DZ twin method |
| Gesell and Thompson | 1929 | Co-twin control: maturation and learning |
| Karl Holzinger | 1929; Twins (1937, with Newman and Freeman) | Heritability index; twins reared apart |
| Beadle and Tatum | 1941 | One gene, one enzyme |
| Linus Pauling; Vernon Ingram | 1949; 1956–57 | Sickle cell as a molecular disease; Glu → Val |
| Tjio and Levan | 1956 | 46 chromosomes |
| Jean Dausset | 1958 | HLA antigens |
| Leonard Heston | 1966 | Adoption study of schizophrenia |
| Cohen and Boyer | 1973 | Recombinant DNA |
| Frederick Sanger | 1977 | Chain-termination sequencing |
| Kary Mullis | 1983 | Polymerase chain reaction |
| Alec Jeffreys | 1984 | DNA fingerprinting |
| Lalji Singh | 1988 | DNA fingerprinting in India |
| Bouchard and colleagues | Science (1990) | Minnesota study of twins reared apart |
Previous Year Questions
Unit 9.1: Human genetics: methods and application
- 2026How would you find out that a particular disease/disorder is inherited and, if so, in which manner? Elaborate with suitable examples.
- 2025Differentiate between pedigree and genealogical analyses. Discuss the history and application of these methods in anthropological studies.
- 2025What are genetic markers? Discuss their applications in understanding population variation, disease association and forensics.
- 2024Write notes on: Heritability and its estimation.
- 2022Write notes on: Pedigree analysis in genetic counselling.
- 2017Briefly describe the various methods used in the genetic study of man.
- 2013Write a note in 150 words on Twin method in human genetics.
- 2007Write a note on Pedigree Analysis.
- 2001Write a note on Recombinant DNA technology.
- 2000What do you understand by recombinant DNA technology ? Discuss its application and limitations in improving human health.
- 1999Discuss the role of twins in naturenurture problems and illustrate your answer with suitable examples.
- 1998Define twins. Describe the method of diagnosis of twins. In what ways are twins useful in the study of human genetics.
- 1997Discuss the recent developments in genetic techniques and comment upon their potential social significance.
- 1996Why are gender studies gaining importance these days ? Assess the contribution of anthropology to gender studies.
- 1995Discuss the genetical and clinical aspects of the anomalies of sex chromosomes in man with special reference to the associated mosaic constitutions.
- 1988Write a note on Heredity and environment.
- 1981“Genetic similarities far outweigh the racial differences among men.” Discuss.
Related questions from other units
- 2025Unit 9.4: ‘Genome-wide Disease Association Studies (GWAS) advanced our understanding of health and disease.’ Discuss.
- 2024Unit 9.4: What is meant by karyotype? How does its analysis help in diagnosis of the chromosomal aberrations in man?
- 2023Unit 9.4: Describe the practical applications of DNA technology in the current scenario.
- 2021Unit 12: How are the cases of disputed paternity solved ? Discuss the recent techniques.
- 2020Unit 9.4: What are the applications of human genomic research in human welfare?
- 2019Unit 12: “Applied human genetics has come to touch every sphere of human life.” Discuss in light of recent advances in molecular anthropology.
- 2015Unit 12: Write a note in 150 words on DNA technology in Medicine.
- 2007Unit 9.4: Write a note on Genome Study.
- 2001Unit 9.4: Discuss the relevance of human DNA Profiling and Gene Mapping in the prevention and cure of diseases.
- 1999Unit 12: Discuss the application of the human genetics in the field of forensic science and diagnosis and treatment of genetic disorders.