

- Economic development is the sustained improvement in the well-being of a society.
- It covers economic growth together with social progress, institutional change and environmental sustainability.
- Measuring development tells us how far a country or region has progressed and where development is concentrated or lacking.
- Mapping these measures shows the uneven geography of development: the gaps between North and South, core and periphery, and leading and lagging regions within countries.
- In recent decades economic geography has been mainly concerned with uneven development across the globe.
- Its focus has moved from the geography of resource exploitation to the geography of human welfare in all parts of the world.
Growth and Development

Economic Development as a Concept
- Development is multidimensional. It includes:
- growth of income and output;
- human capital: health, education and skills;
- social inclusion, safety and freedom;
- structural change from agriculture to industry and services;
- environmental sustainability.
- It includes the economic growth of people and their social emancipation, based on natural rights and the right to the full growth of the human personality.
- Thinking about development has moved through stages:
- 1950s–60s: development as growth of GNP, as in Rostow’s stages of growth;
- 1970s: basic needs and redistribution with growth;
- 1990 onwards: human development and capabilities (Mahbub ul Haq, Amartya Sen);
- 2015 onwards: sustainable development under the 17 Sustainable Development Goals (SDGs).
Economic Growth vs Economic Development
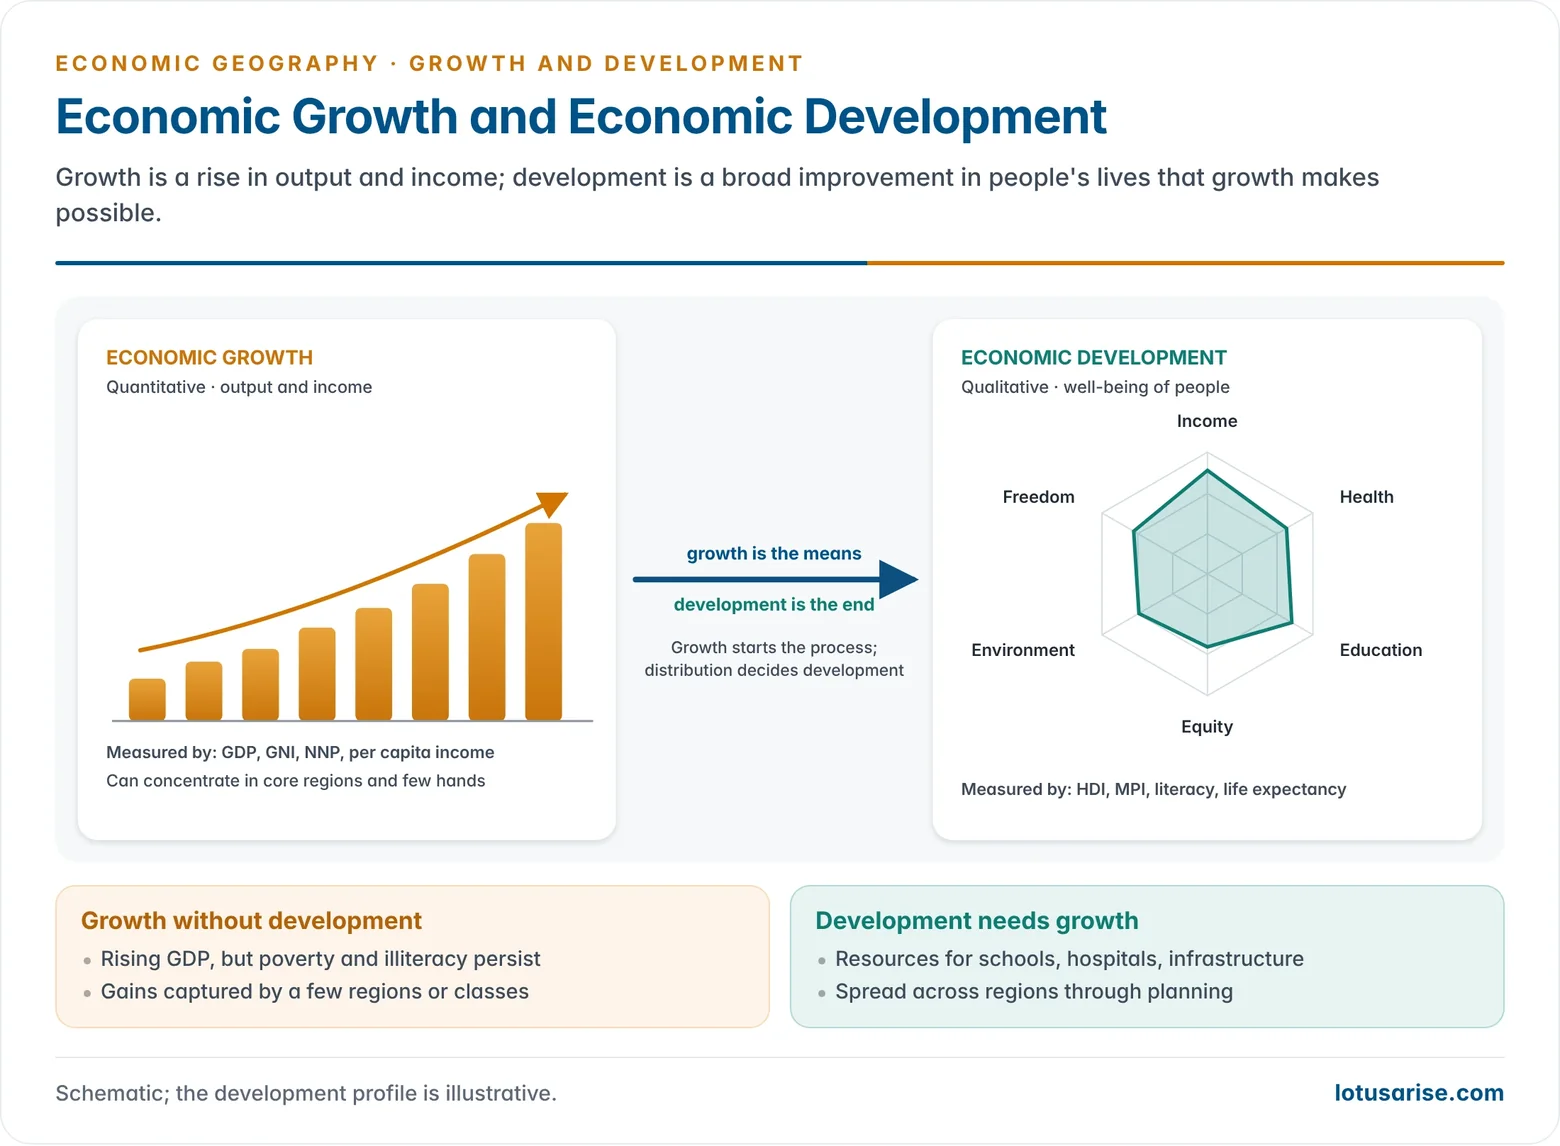
- Economic growth is a quantitative idea with a materialistic connotation.
- It is measured by GDP, GNP, NNP and similar indices, built from production, input, output, trade and other money values.
- Left to itself it can concentrate wealth in a few hands and in favoured regions, widening regional and interpersonal disparities. The growth impulse tends to flow towards already prosperous regions.
- It is often analysed vertically, across social sections, classes and castes.
- Economic development is a qualitative idea with a humanistic connotation.
- It is measured by social and human indicators: per capita consumption, literacy, life expectancy, infant mortality, sex ratio, standard of living and the HDI.
- It aims at a welfare society based on distributive justice, spreading gains to poorer regions and bringing balance across the landscape.
- It is a spatial concept, studied across regions and through history.
- Growth and development cannot be separated. Growth is the means and development the end.
- Without growth, development is a misnomer: economic impulses are needed to set development in motion.
- Sustained growth, spread across the landscape, can reduce disparities. Growth starts the process; development is the goal.
| Basis | Economic growth | Economic development |
|---|---|---|
| Nature | Quantitative | Qualitative and quantitative |
| Measures | GDP, GNI, per capita income | HDI, literacy, health, poverty, equity |
| Scope | Output and income | Output plus social, institutional and environmental change |
| Spatial outcome | May concentrate in core regions | Seeks balanced spread |
| Time | Can be short-term | Long-term and sustained |
Measuring Economic Development
Income-Based Measures
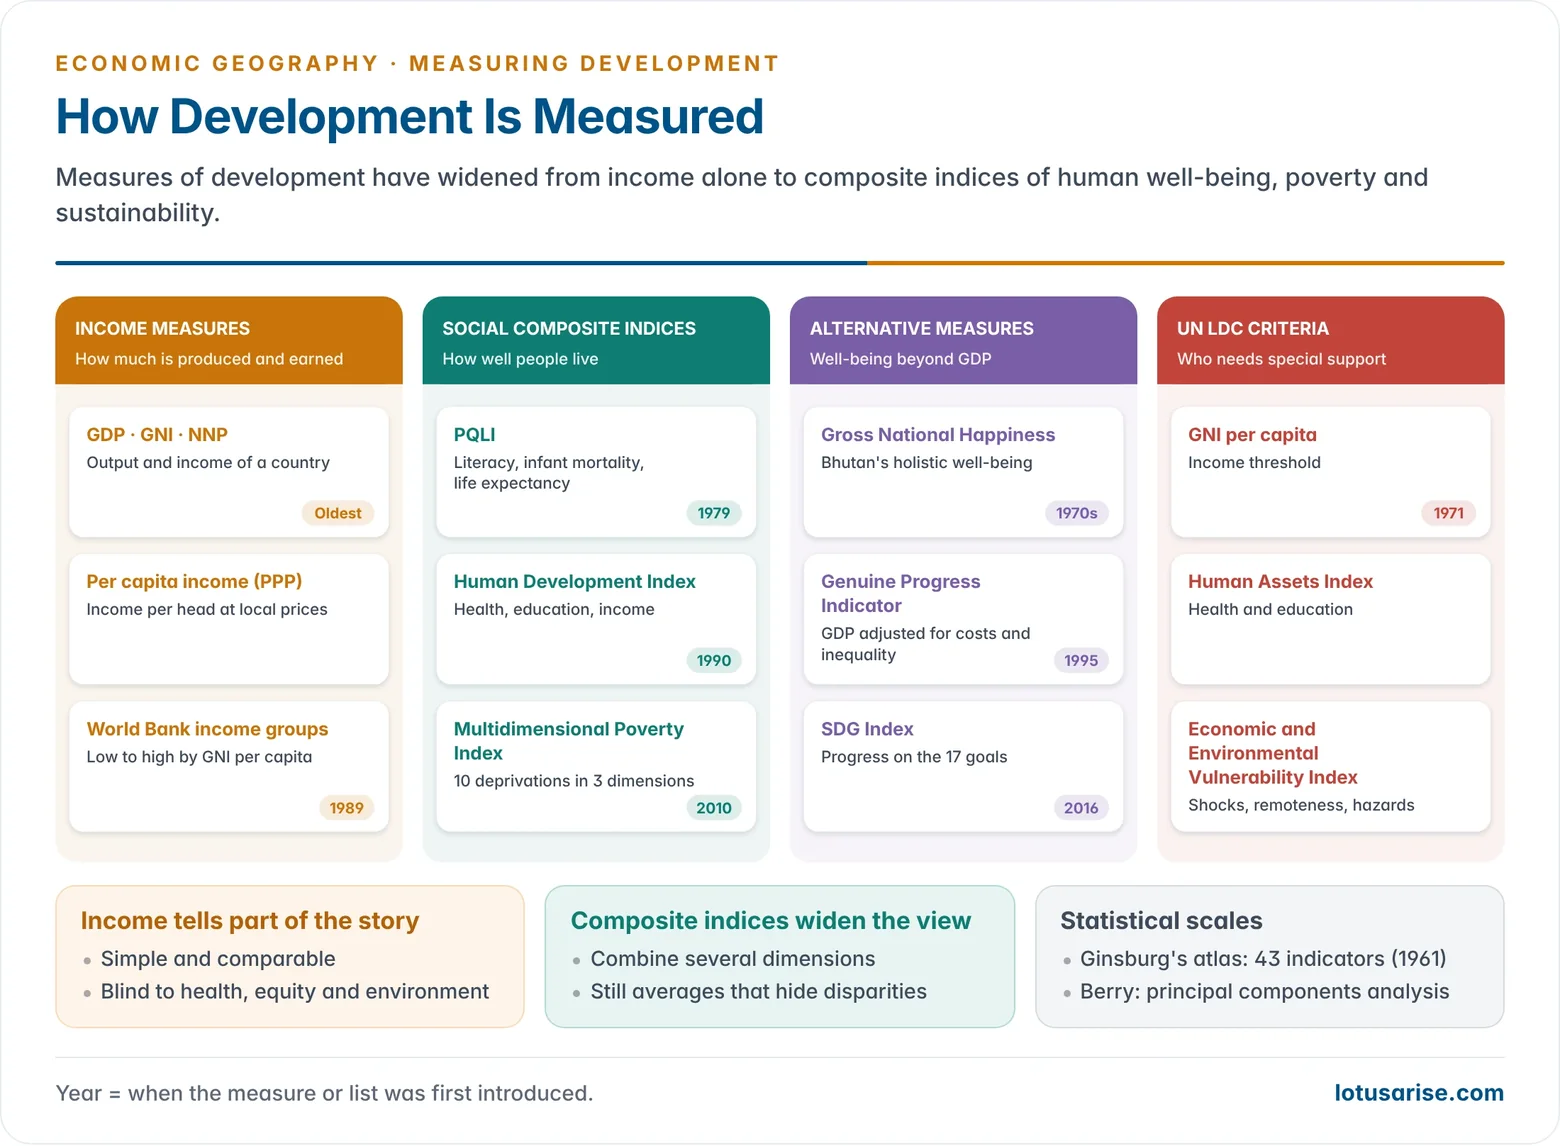
- Gross Domestic Product (GDP): the value of all final goods and services produced within a country in a year.
- Gross National Product (GNP), now called Gross National Income (GNI): GDP plus net income from abroad. It measures what a country’s residents earn.
- Net National Product (NNP): GNP minus depreciation of capital.
- Per capita income: GNI divided by population. It is the most common single index of a country’s level of development.
- Purchasing power parity (PPP): converts incomes using what money actually buys in each country, not market exchange rates. It raises the measured income of poorer countries, where prices are lower.
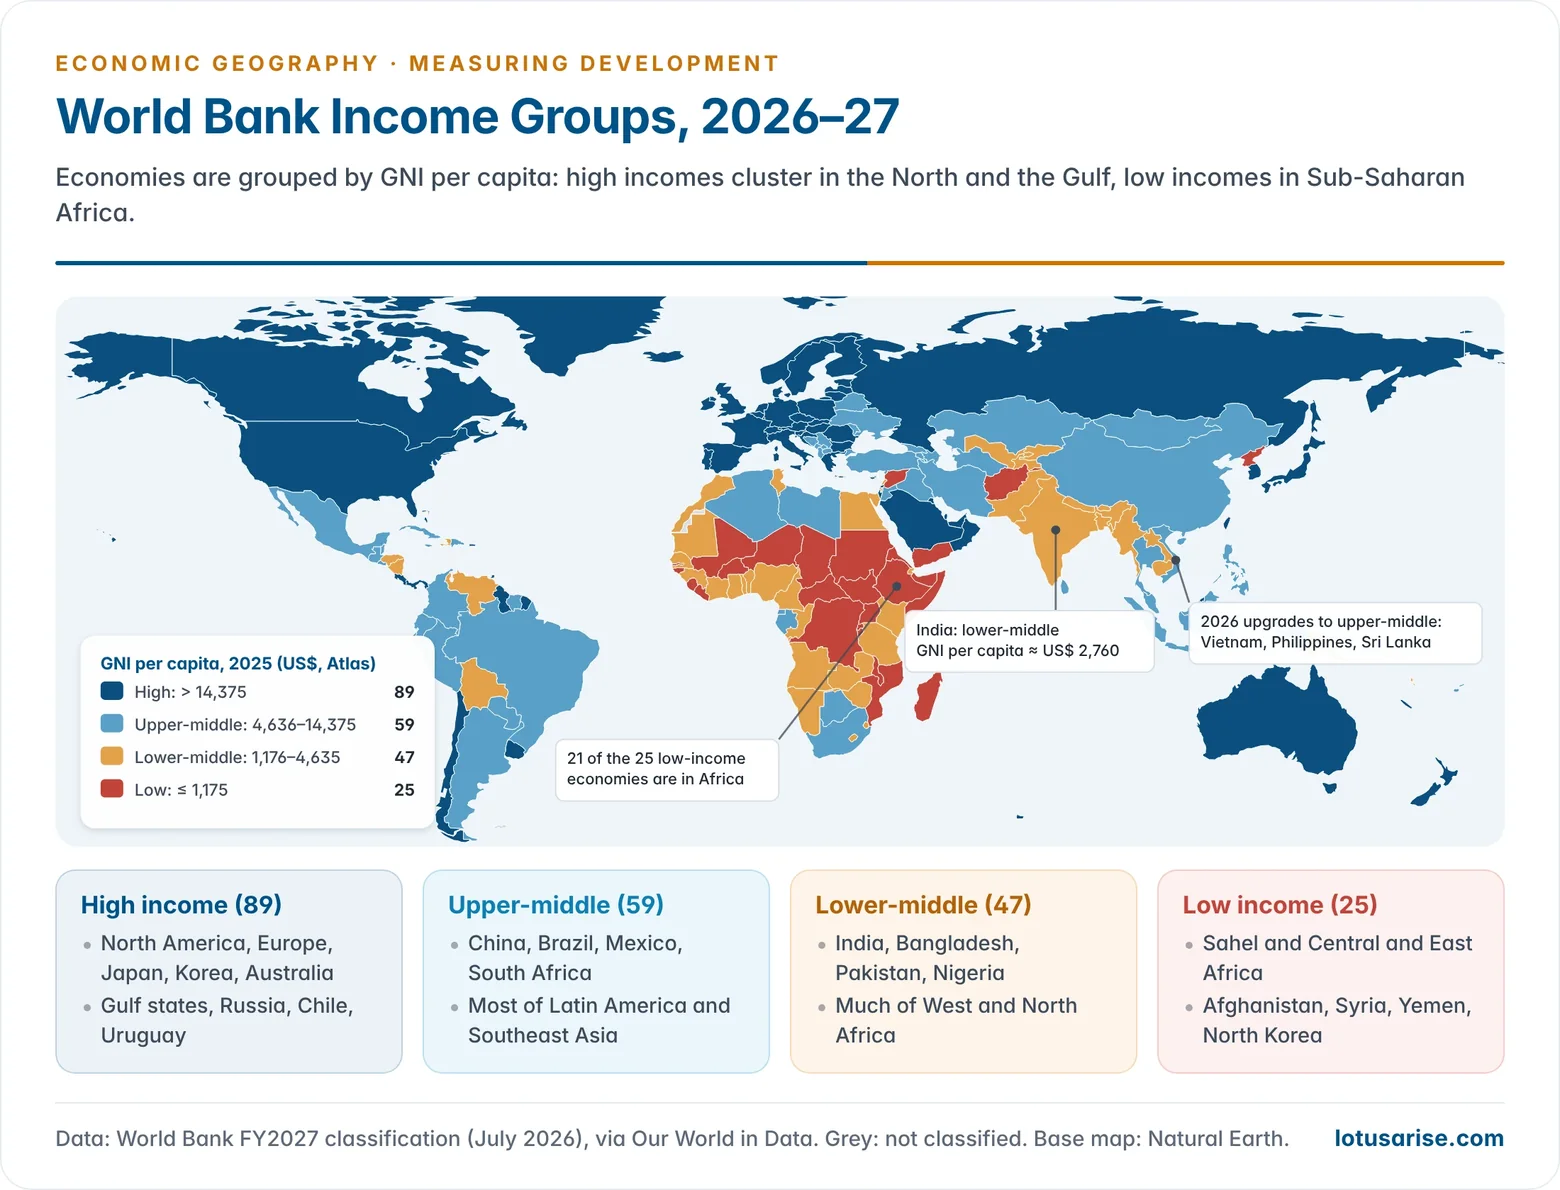
- World Bank income groups: the World Bank classifies economies each July by GNI per capita (Atlas method).
- The FY2027 thresholds, based on 2025 incomes, were set in July 2026.
- Of the 220 economies classified, 25 are low-income, 47 lower-middle, 59 upper-middle and 89 high-income.
- In 2026 Sri Lanka, Vietnam, the Philippines, Jordan and Micronesia moved up to upper-middle income and Togo to lower-middle income.
- India, with a GNI per capita of about US$ 2,760 (2025), remains lower-middle income, as it has been since 2009.
| Income group (FY2027) | GNI per capita, 2025 (US$) | Examples |
|---|---|---|
| Low income | 1,175 or less | Ethiopia, Niger, Afghanistan |
| Lower-middle income | 1,176–4,635 | India, Bangladesh, Nigeria |
| Upper-middle income | 4,636–14,375 | China, Brazil, Vietnam, Sri Lanka |
| High income | above 14,375 | USA, Germany, Japan, Saudi Arabia |
Composite and Social Indices
- Income alone cannot show health, education, equity or freedom. Composite indices were developed for this purpose.
- Physical Quality of Life Index (PQLI): devised by Morris David Morris (1979). It combines literacy, infant mortality and life expectancy at age one.
- Human Development Index (HDI): UNDP, since 1990. It combines a long and healthy life, knowledge, and a decent standard of living (GNI per capita, PPP).
- In the HDR 2025 (2023 data), India scored 0.685 and ranked 130th of 193 countries. Its full method is explained under the Human Development Index.
- Companion indices include the Inequality-adjusted HDI (IHDI), the Gender Development and Gender Inequality indices, and the Planetary pressures-adjusted HDI.
- Multidimensional Poverty Index (MPI): UNDP and the Oxford Poverty and Human Development Initiative (OPHI), since 2010. It covers 10 indicators across health, education and living standards.
- The 2026 Global MPI (October 2026) counted about 1.2 billion poor people in 108 countries. This was the first rise since the index began, and over half of the poor are children.
- Extreme income poverty: in June 2025 the World Bank raised the international poverty line to US$ 3 a day (2021 PPP). About 817 million people lived below it in 2024.
- Gross National Happiness (GNH): Bhutan’s measure of well-being across psychological, cultural, ecological and governance domains.
- Genuine Progress Indicator (GPI): adjusts GDP for income inequality, pollution, resource depletion and unpaid household work.
- SDG Index: published by the UN Sustainable Development Solutions Network.
- In 2026 Finland topped it, and India reached its highest-ever rank of 94th of 167 countries (score 68.3).
- UN criteria for Least Developed Countries (LDCs) combine three measures:
- GNI per capita;
- a Human Assets Index of health and education;
- an Economic and Environmental Vulnerability Index.
- There are 44 LDCs, 32 of them in Africa. Bangladesh, Lao PDR and Nepal were scheduled to graduate in November 2026.
Statistical Methods of Measuring Levels of Development
- Norton Ginsburg’s Atlas of Economic Development (1961) mapped 43 indicators of development for the countries of the world. They covered transport, energy, trade, production, national product, demography and health.
- Brian J. L. Berry (1960–61) used principal components analysis on these indicators. He reduced them to two main dimensions:
- a technological–economic dimension: energy use, transport, trade, income;
- a demographic dimension: birth and death rates, density.
- Ranking countries on these dimensions gave a single scale of development.
- Composite index methods are also used to rank regions and districts within countries. Indian examples are NITI Aayog’s SDG India Index and the Composite Water Management Index. They use:
- z-scores;
- ranking coefficients;
- min–max normalisation (as in the HDI).
Criticism of the Measures
- The criteria are often Western-oriented. They equate development with high consumption and urban–industrial lifestyles.
- Data are not always reliable or recent. Many poor countries lack regular censuses and surveys, so values are imputed or revised.
- They ignore cultural and moral values (the idiographic qualities of societies), along with subjective well-being and freedom.
- National averages hide internal disparities between regions, classes, castes and genders.
- GDP counts environmental damage and defensive spending as growth and ignores unpaid care work and the informal economy.
- Different indices rank countries differently. Income-rich, low-HDI countries and income-poor, high-HDI countries show the gap.
Spatial Pattern of Economic Development in the World
- Development has a marked spatial disparity across the world. It is governed by geographical and human factors:
- physiography, climate and resource endowment;
- population;
- socio-cultural traits;
- political organisation and institutions;
- science and technology;
- historical experience, especially colonialism.
Correspondence of Economic and Human Development
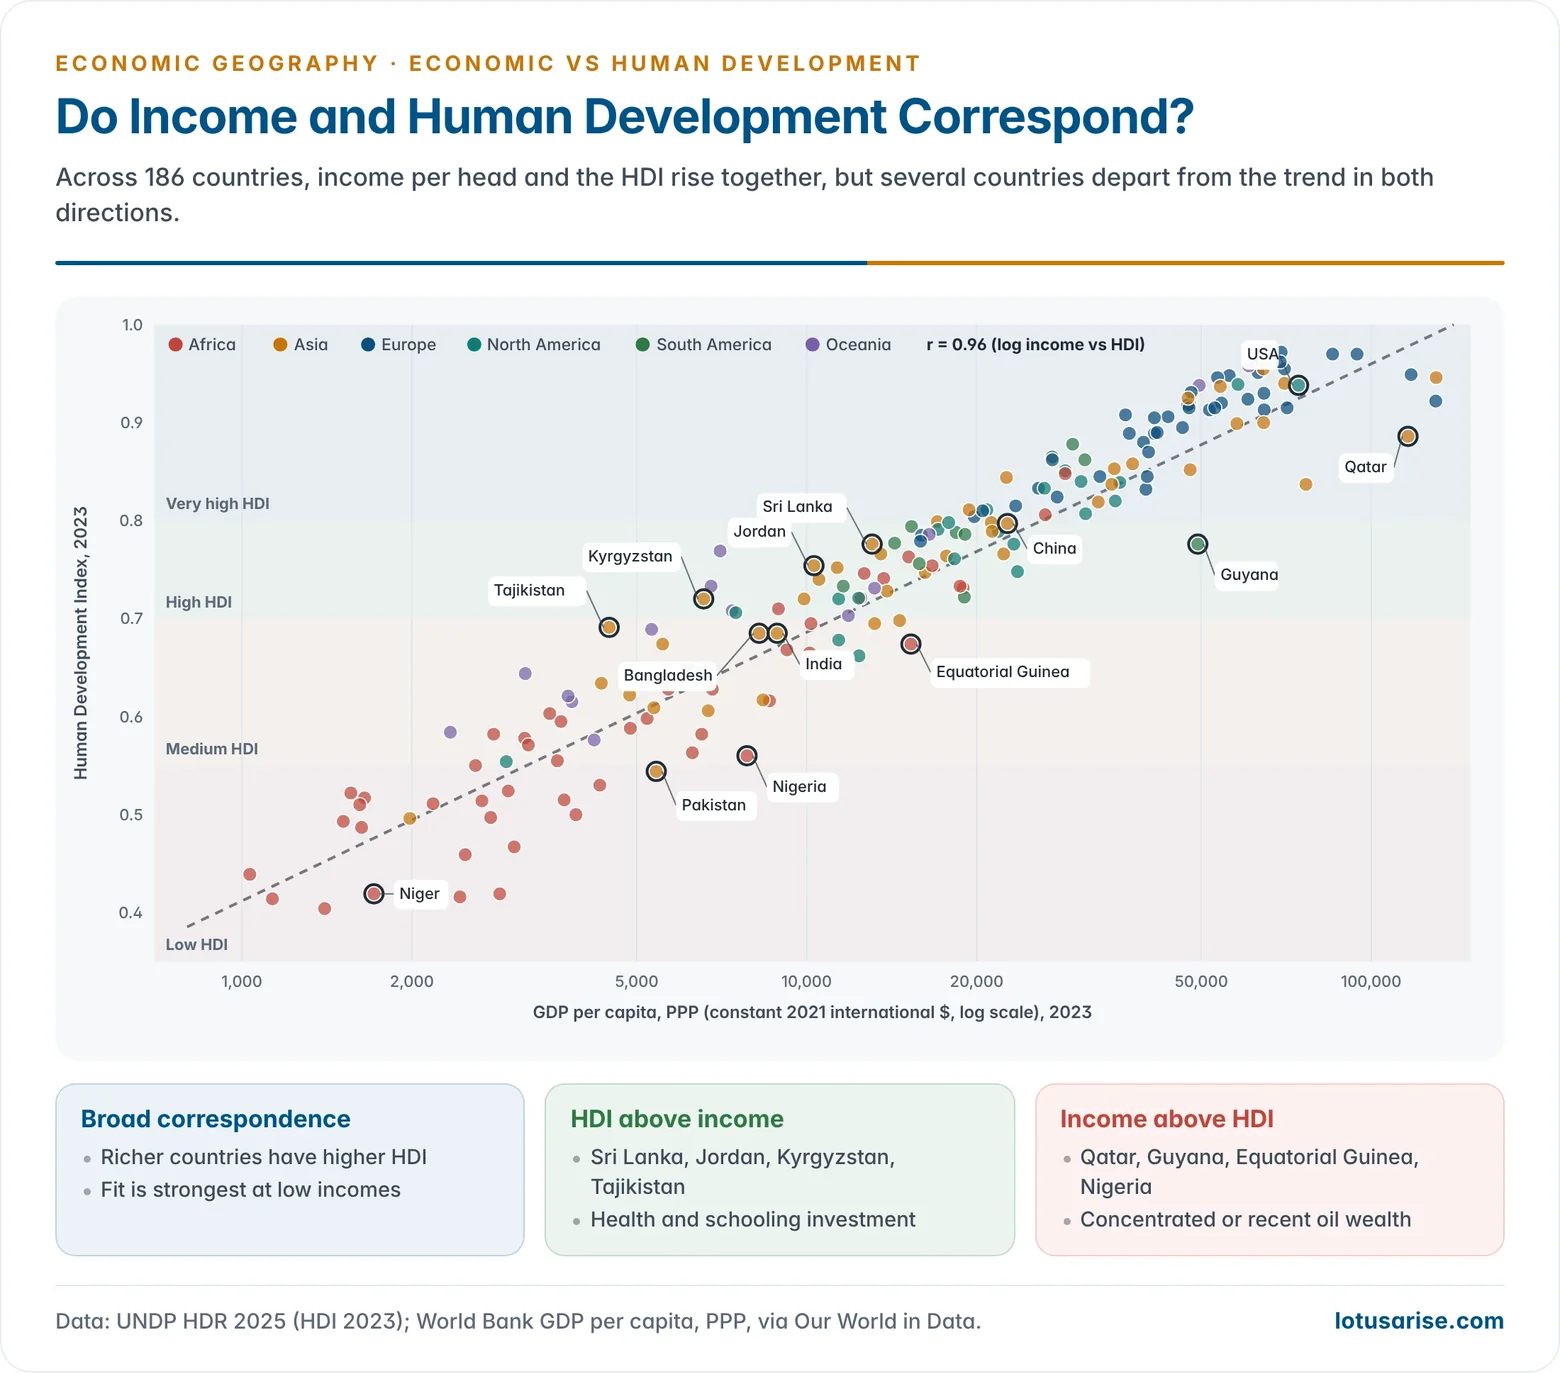
- Broadly, income and human development rise together. The richest countries have the highest HDI, and the poorest countries of Sub-Saharan Africa have the lowest.
- The correspondence is not perfect. There are departures in both directions:
- HDI above income: Sri Lanka, Jordan, Georgia and the Central Asian republics of Kyrgyzstan and Tajikistan, and Kerala within India. Public investment in health and schooling, or the legacy of Soviet-era education, lifted human development above what their incomes would predict.
- Income above HDI: oil- and gas-rich economies such as Qatar, Brunei, Guyana (after its recent oil boom) and Equatorial Guinea, and populous Nigeria and Pakistan. Wealth that is concentrated or recent has not yet turned into health and education for all.
- Same HDI, different income: India and Bangladesh both scored 0.685 in 2023, although India’s income per head was higher.
- Within-country disparities are as sharp as those between countries.
- In India the per capita income of the richest states (Goa, Sikkim, Delhi) is several times that of Bihar, the poorest large state.
- China’s coastal provinces are far richer than its western interior, and Italy’s north far richer than its south (the Mezzogiorno).
- Such contrasts led geographers to the core–periphery and cumulative causation models of uneven development.
Types of Economies
- On the basis of their economic structure, countries can be grouped as:
- Capitalist commercial economies: small, trade- and finance-based economies such as Singapore, Switzerland, the Netherlands and Belgium;
- Industrial–commercial economies: the USA, Japan, Germany and the UK;
- Industrial–agrarian economies: much of Latin America, Southeast Asia, Australia and New Zealand, where industry coexists with commercial agriculture and mining;
- Agrarian–rural economies: most of Sub-Saharan Africa, Cambodia and Laos;
- Socialist or state-led economies: China, Vietnam, Cuba and North Korea, with different degrees of market reform.
- By level of development, countries are grouped as developed, emerging (newly industrialising), developing and least developed.
- Emerging economies include the BRICS and the East Asian tigers: Hong Kong, Singapore, South Korea and Taiwan. They are followed by the “tiger cub” economies of Malaysia, Thailand, Indonesia and Vietnam.
North–South Divide
- The Brandt Report (1980) drew the Brandt Line, which divides the rich North from the poor South.
- North: commercial, technology-based, industrialised and urbanised economies with high incomes. They dominate high-value trade, finance and technology.
- South: suppliers of raw materials and labour, with high population pressure, lower per capita incomes and lower standards of living.
- The line is now blurred: South Korea, Singapore and the Gulf states are high-income, and China is the world’s largest manufacturer and exporter. The term Global South is now used more in a political sense.
- India’s share of world merchandise exports is still under 2%, but it is a much larger exporter of services.
Regional Patterns
| Region | Level and character of development |
|---|---|
| Anglo-America (USA, Canada) | Resource-rich, technologically advanced, very high income and HDI. Pockets of poverty persist (Appalachia, some Indigenous and inner-city areas) |
| Western and Northern Europe | Very high HDI. Welfare states; old industrial regions restructured |
| Latin America and the Caribbean | Mostly upper-middle income, with among the highest income inequality in the world. Mexico, Brazil, Chile and Argentina are industrialised; Haiti is the poorest |
| North Africa and West Asia | Oil-based economies with high incomes in the Gulf. Conflict has set back Syria, Yemen and Libya |
| Sub-Saharan Africa | Rich in natural resources but mostly low and lower-middle income. It holds 21 of the 25 low-income economies. Conflict, weak infrastructure and climate stress hold it back; South Africa, Botswana and Mauritius are relatively developed |
| South Asia | Lower-middle income with large numbers of poor. India is growing fast; Sri Lanka is now upper-middle income |
| Southeast Asia | Export-led industrialisation: Singapore is high-income; Malaysia, Thailand, Vietnam and the Philippines are upper-middle |
| East Asia | Japan, South Korea and Taiwan are high-income. China is upper-middle income and the world’s manufacturing hub |
| Oceania | Australia and New Zealand are high-income; the Pacific island states are vulnerable and aid-dependent |
Factors and Problems of Economic Development
- The level of development of a region is shaped by several groups of factors:
- Physical factors:
- climate: extreme heat, aridity or cold limit farming and settlement;
- relief: mountainous areas lag behind plains;
- soil fertility and land capability: the Prairies against much of the Sahel;
- water: the Nile valley in Egypt depends on the river;
- accessibility and location: ports such as Singapore, Rotterdam and Mumbai prosper;
- natural resources, which bring development only with the technology to use them.
- Environmental hazards: floods, droughts, cyclones and climate change repeatedly set back regions such as coastal Odisha and Bangladesh.
- Demographic factors: mortality, dependency ratio, sex ratio, skills and employment.
- Technology: Japan became developed with few natural resources because of its technology. Resource-rich countries without technology and institutions have lagged.
- Economic and institutional factors: capital, credit, financial institutions, infrastructure, governance and the rule of law.
- Social and cultural factors: literacy and education, gender bias, caste and regional divisions, social taboos, and the work ethos and entrepreneurship of communities (the trading communities of Gujarat and Rajasthan).
- Historical factors: colonial exploitation, and the inertia of early-developed centres such as the colonial port cities of Mumbai, Chennai and Kolkata.
- Dynamic factors: industrialisation, urbanisation, government policy, trade and the role of international institutions.
- Physical factors:
- Where these factors are unfavourable they produce the problems of world economic development: poverty, inequality, debt and dependency, unemployment, demographic pressure and the resource curse.
Previous Year Questions
2002To what extent do regional patterns of economic development in the world correspond with each other? Highlight situations of departure, in particular.1999How far do the patterns of economic development and those of human development correspond with each other in the world? Illustrate your answer with examples.





Thanks sir, it helps me a lot
I am very thankful to you for your untiring efforts to publish such good content in geography optional. God bless you.
Most Welcome
Thank you so much sir
This material is really helpful, even fir GS Geography! Thanks for the effort.
Most Welcome Tanish, Keep reading
It would have been better to add a mock question at the end?
Anyways, your effort is 👌👌
Can’t thank you enough for such a valuable content. May god bless you 🙏
thank u so much …
sir is it enough or we have to read books too
How to download it sir?
Thank you sir 🙏🙏🤸