

- Regional imbalance is a state of disequilibrium in economic and social development between two or more regions. The benefits of growth do not reach all regions, or all classes within them, equally.
- It arises because the earth’s surface is not uniform and because socio-economic processes (colonial history, investment, migration, policy) concentrate growth in some places and drain it from others.
- It is a universal feature of capitalist and socialist economies alike, at every scale from the globe to the district.
- Balanced growth is the planning ideal that answers it: growth spread across sectors and regions so that no region is left behind.
Concept of Regional Imbalance

Meaning
- Regional imbalance is the unequal distribution of resources, output, income, infrastructure and well-being across regions, which shows up as development disparity.
- It is a condition in which the economy fails to extend the benefits of growth equally to all regions and social groups.
- It is measured relative to other regions or to a national average, not in absolute terms.
- The landscape never follows the principle of isomorphism. Natural resources, location and accessibility differ from place to place, so some regions start with advantages and others with constraints.
- Human activity then magnifies these differences.
- A favoured region attracts resources, people, capital and enterprise and grows into a powerful economic centre.
- Its surroundings lose these factors and fall behind. This drain is Gunnar Myrdal’s backwash effect.
- Bhilai grew into a developed steel town while much of its tribal hinterland stayed poor.
- In full, regional imbalance is a disparity in resources, productive capacity and factors of production between regions. It ends in development gaps, regional consciousness, flows towards the developed region, and polarised, agglomerated growth.
Dimensions and Types
- Spatial imbalance: inequality between territorial units.
- Inter-regional: between distinct regions or States, such as Bihar and Maharashtra, or the north-east and western India.
- Intra-regional: within one State or region, such as Vidarbha and western Maharashtra, Rayalaseema and coastal Andhra, or eastern and western Uttar Pradesh.
- Social imbalance: inequality between social groups (caste, class, tribe, gender, religion) within a region.
- It becomes spatial where deprived groups are concentrated in space: Dalit hamlets beside upper-caste villages, and the tribal districts of Jharkhand, Chhattisgarh and Odisha that lag on almost every indicator.
- Gender gaps overlap with regional ones: districts of Bihar and Rajasthan with low female literacy are also economically lagging.
- Sectoral imbalance: a modern industrial or service sector beside a stagnant farm sector, the dual economy of many backward regions.
| Scale | Units compared | Indian or world example | Typical measures |
|---|---|---|---|
| Global | Nations | North and South; Norway and South Sudan; the USA and Haiti; Germany and Ethiopia | GNI per capita, HDI |
| Inter-State | States | Telangana and Bihar; Maharashtra and Bihar; Punjab and Assam | Per capita NSDP, MPI, SDG score, literacy, IMR |
| Intra-State | Districts, sub-regions | Vidarbha and western Maharashtra | District income, consumption and poverty estimates, allocation of resources, quality of governance, agrarian structure, composite indices |
| Rural–urban | Villages and towns | Rural and urban India | Consumption, services, poverty |
| Social | Groups within a region | Tribal and non-tribal blocks | Literacy, health, assets by group |
A Universal Phenomenon
- Imbalance appears in rich and poor countries and under every economic system.
- Italy: the industrial north against the Mezzogiorno.
- France: Paris against the provinces.
- United States: the old north-eastern manufacturing belt against Appalachia and the rural South.
- Russia: Moscow against Siberia and the Far East.
- China: the eastern coast against the western interior.
- Because regions grow at very unequal rates, the gaps they open bring serious social and political problems.
- Global disparity comes from colonialism, terms of trade and the technology gap. Regional imbalance within a country has all these causes, plus internal policy failures, geography and history. A State’s backwardness may reflect either regional diversity or disparity.
Indicators of Imbalance
- Economic: per capita income (per capita NSDP), growth rate, share of manufacturing and services, workforce in agriculture, wage rates, credit and investment per head.
- Social: poverty, literacy, infant mortality, life expectancy, nutrition, sex ratio.
- Infrastructure: road length per 100 sq km, electricity use per head, share of villages electrified (all, since 2018), share of cultivated land under irrigation, bank branches and credit–deposit ratio, hospital beds per 1,000 people, telecom and internet access.
- Functional: the presence of low-, middle- and high-order services in a region’s towns.
- Composite indices combine these:
- the Human Development Index of UNDP;
- NITI Aayog’s National Multidimensional Poverty Index (12 indicators of health, education and living standards) and SDG India Index;
- the Composite Development Index of the Raghuram Rajan Committee (2013), used to rank States for backward area planning.
- Measures of disparity:
- the range or the ratio of the richest to the poorest region;
- the coefficient of variation (standard deviation as a percentage of the mean), whose fall over time is sigma-convergence;
- Williamson’s index, a population-weighted coefficient of variation (1965);
- the Gini and Theil indices.
- A low composite score marks a backward region, and the size of the gap shows its distance from balanced growth.
World Pattern of Development Disparity
Classifications of the World
- Early regionalisation (1911):
- Developed: Anglo-America, Western Europe, Australia, high on all economic measures.
- Quasi-developed: a high resource base, with development intensified only in the 20th century: Eastern Europe, South Africa, Brazil, Argentina.
- Underdeveloped: Africa, India, China.
- North and South: the Brandt Commission report North–South: A Programme for Survival (1980) drew the “Brandt Line” between the rich, industrial North and the poorer South.
- North: secondary and tertiary economies, former colonial powers, net exporters of manufactures and services, importers of raw materials.
- South: primary economies, former colonies, exporters of raw materials, net importers of processed goods.
- Realm scheme, on the physical, social, economic and cultural landscape:
- Developed: the New World (Australia) and the Occidental realm (Europe, North America).
- Less developed: the Old Oriental realm, the South Asian and New Oriental region, and the Meso-African region.
- Income groups: the World Bank groups countries by GNI per capita into low, lower-middle, upper-middle and high income. India is lower-middle income.
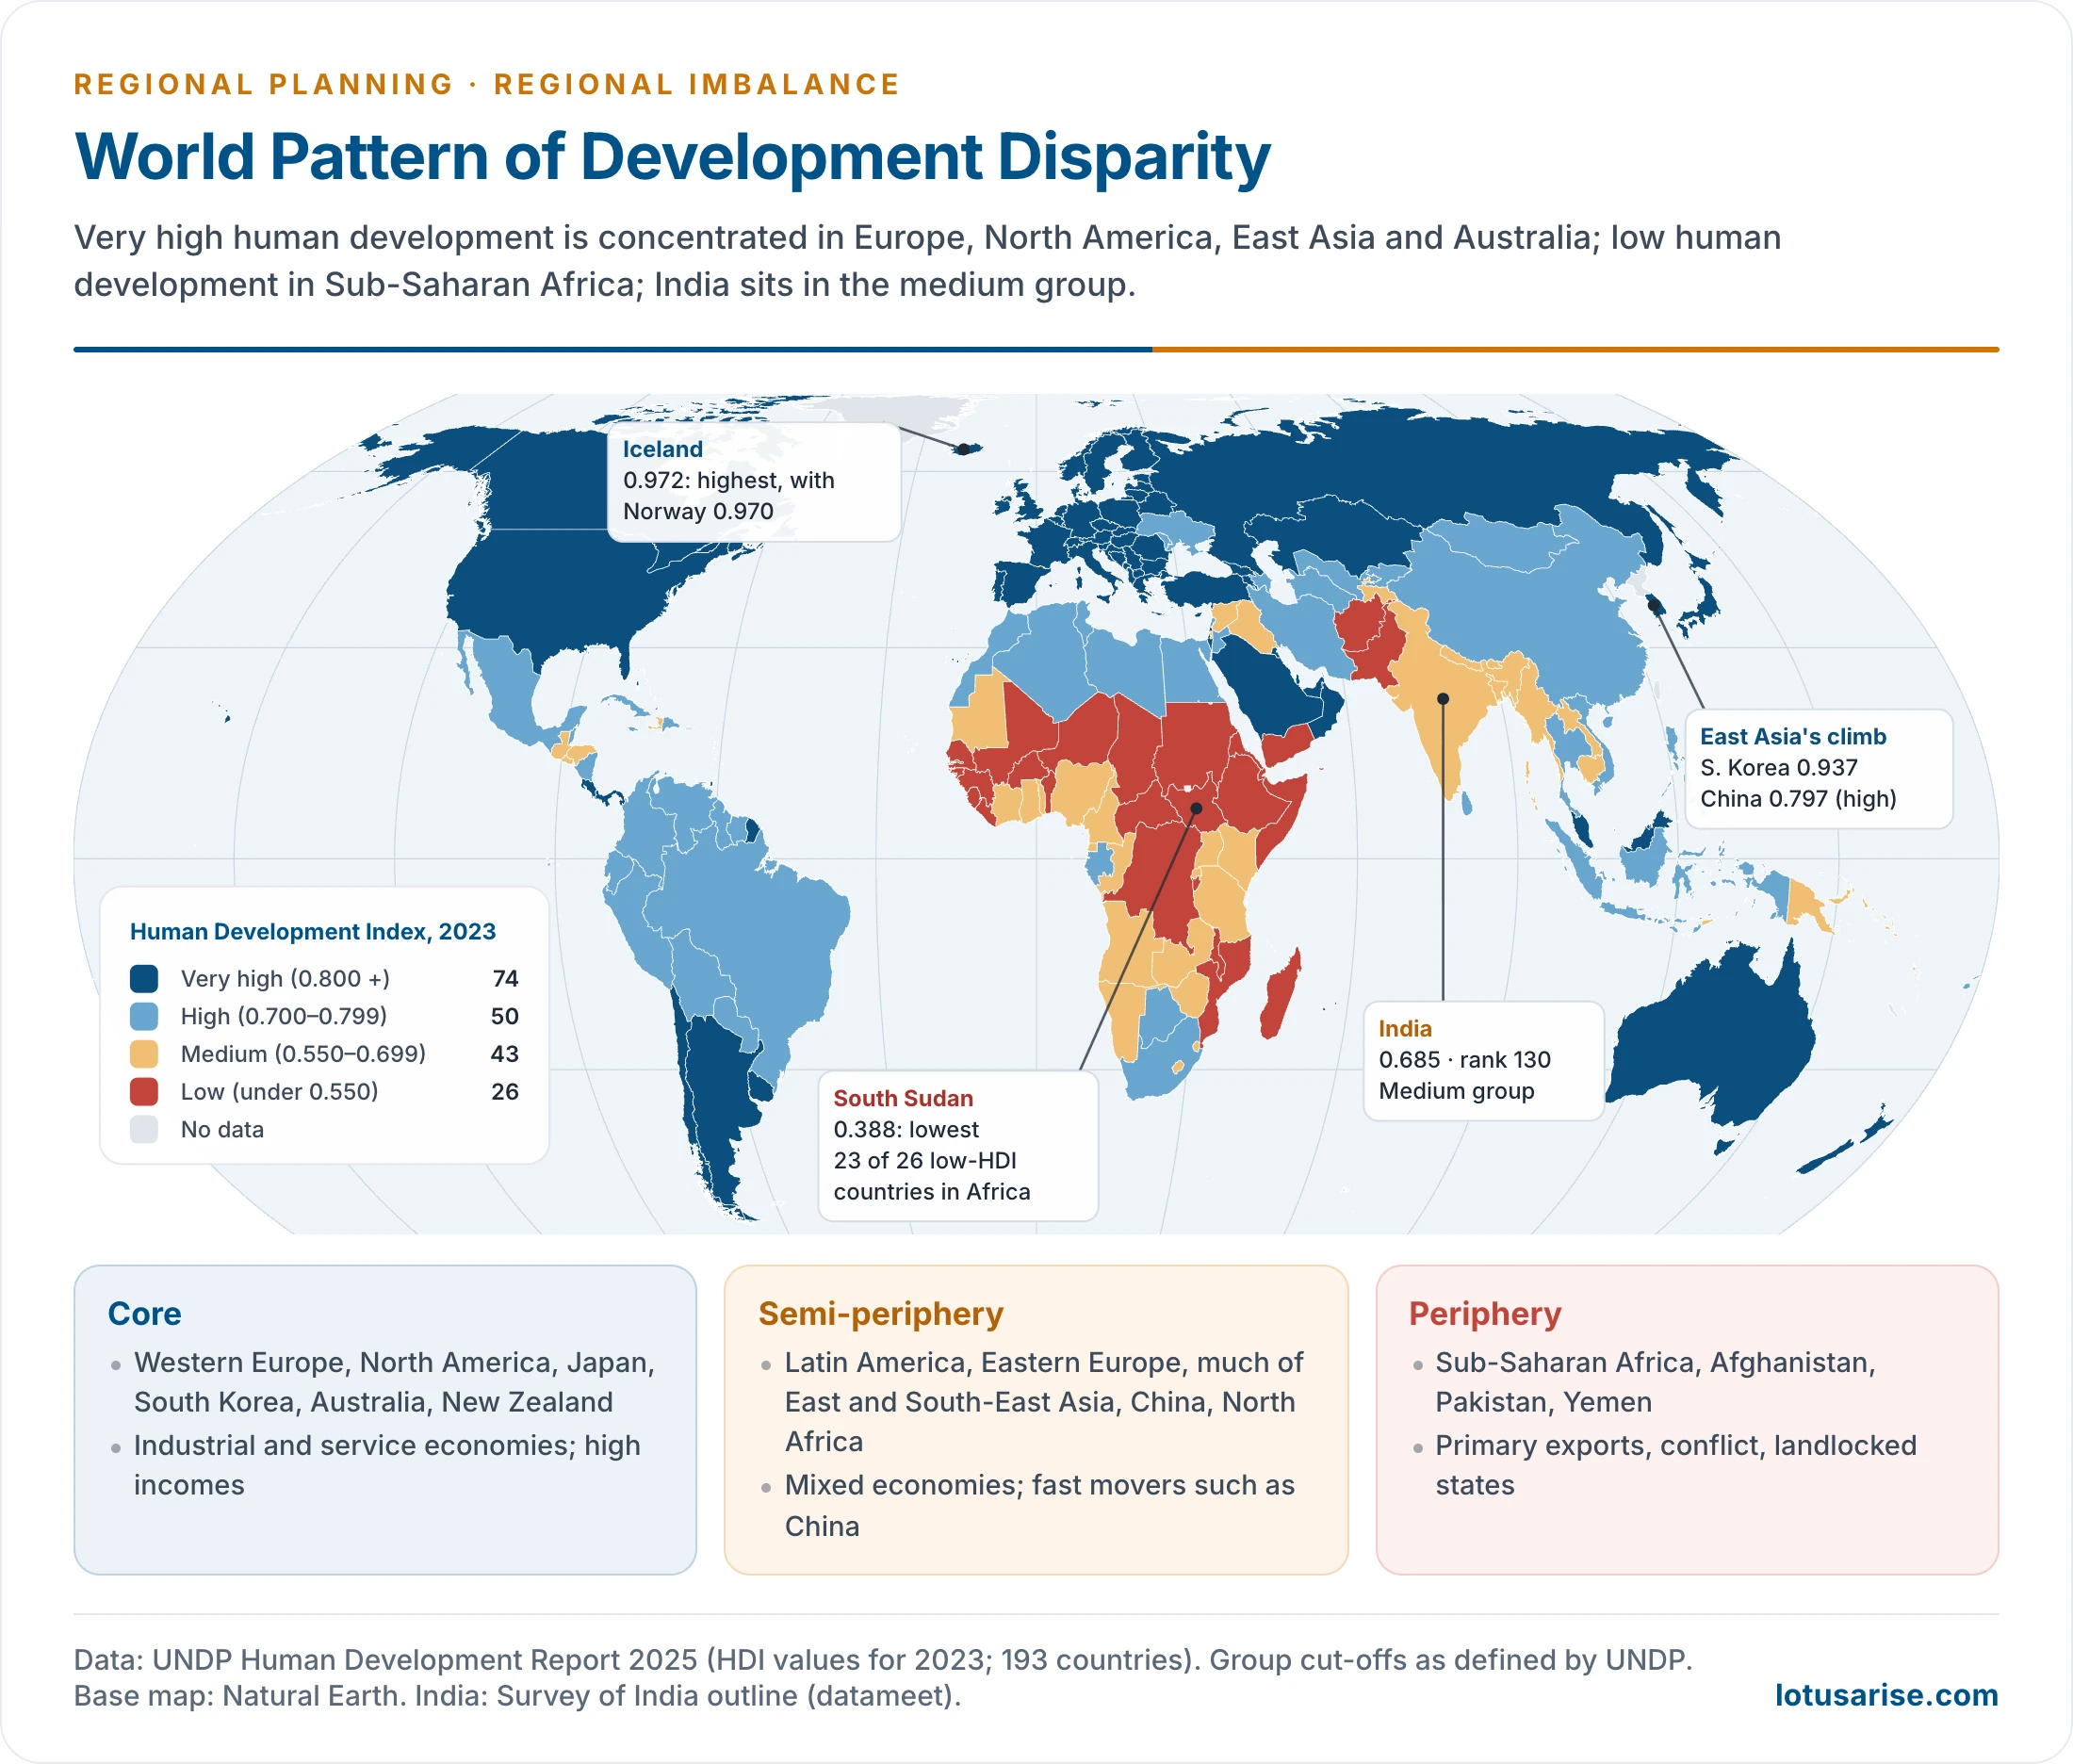
- Human development groups: UNDP’s Human Development Report 2025 (data for 2023) puts 74 countries in the very high group, 50 in high, 43 in medium and 26 in low.
- Iceland (0.972) ranks first and South Sudan (0.388) last.
- India scores 0.685 and ranks 130th of 193, in the medium group.
- Population–resource regions of Edward A. Ackerman (1967), based on population, resources and technology. About one-sixth of the world’s people live in each of the United States, European and Brazilian types, and about one-half in the Egyptian type:
- United States type: technology-source areas with a low population–resource ratio (North America, Australia, New Zealand, Russia);
- European type: technology-source areas with a high ratio, which import resources through trade (Europe, Japan);
- Brazilian type: technology-deficient areas with a low ratio, where resources lie unused (much of Latin America, Africa, South-East Asia);
- Egyptian type: technology-deficient areas with a high ratio and the most severe population pressure (India, Pakistan, China in his scheme);
- Arctic–desert type: ice caps, tundra and deserts with little food-producing potential.
Spatial Pattern of World Disparity
- The core of high development lies in Western Europe, North America, Japan, South Korea, Australia and New Zealand, joined by the oil-rich Gulf states and city-states such as Singapore.
- The semi-periphery of high and upper-middle development covers Latin America, Eastern Europe, much of East and South-East Asia, China and North Africa.
- The periphery of low development is concentrated in Sub-Saharan Africa, with Afghanistan, Pakistan and Yemen outside it.
- Of the 26 low human development countries in 2023, 23 are in Africa, many of them landlocked or affected by conflict.
- South Asia sits mostly in the medium group: India and Bangladesh (0.685), Nepal (0.622), with Sri Lanka (0.776) higher and Pakistan (0.544) in the low group.
- The pattern shows the same forces that work inside countries:
- colonial history that turned colonies into suppliers of raw materials;
- unequal terms of trade between primary and manufactured exports;
- technology and capital gaps;
- geography: tropical disease burdens, landlocked locations and arid lands raise the cost of growth, though they do not decide it.
- The gaps are not fixed. South Korea, Singapore and China have moved from the periphery towards the core within two generations, while parts of Africa and Latin America stagnated.
Characteristics of Developed and Less Developed Regions
| Basis | Less developed | Developed |
|---|---|---|
| Income and capital | Low per capita income, scarce capital, unequal wealth | High income, easy capital, wealth more evenly spread |
| Economy | Primary activities (farming, forestry, mining, fishing) dominate; agriculture employs most workers, over 70% in some | Manufacturing and services dominate; farm workforce small |
| Agriculture | Subsistence, low yields, disguised unemployment | Mechanised, efficient, high yields |
| Settlement | Mostly rural, over 70% in some | Mostly urban, often over 70% |
| Demography | High birth rate, high dependency ratio | Low birth and death rates, long life expectancy |
| Health and nutrition | Hunger, infectious and parasitic disease, weak health care | Adequate diet, efficient health care; obesity a problem |
| Housing and services | Overcrowding, poor sanitation | Adequate housing and sanitation |
| Education and gender | High illiteracy, low status of women | Integrated education system, greater gender equality |
Causes of Regional Imbalances
- The causes are multi-dimensional: physical geography, history, economy, society and policy all play a part. No single cause explains an imbalance.
- Physical: climate, terrain, soil, hydrology, vegetation and forest cover, location, accessibility, natural resources.
- Non-physical: historical, demographic, economic (trade pattern, industrialisation, farm development), socio-cultural, political and dynamic factors.
Geographical Factors
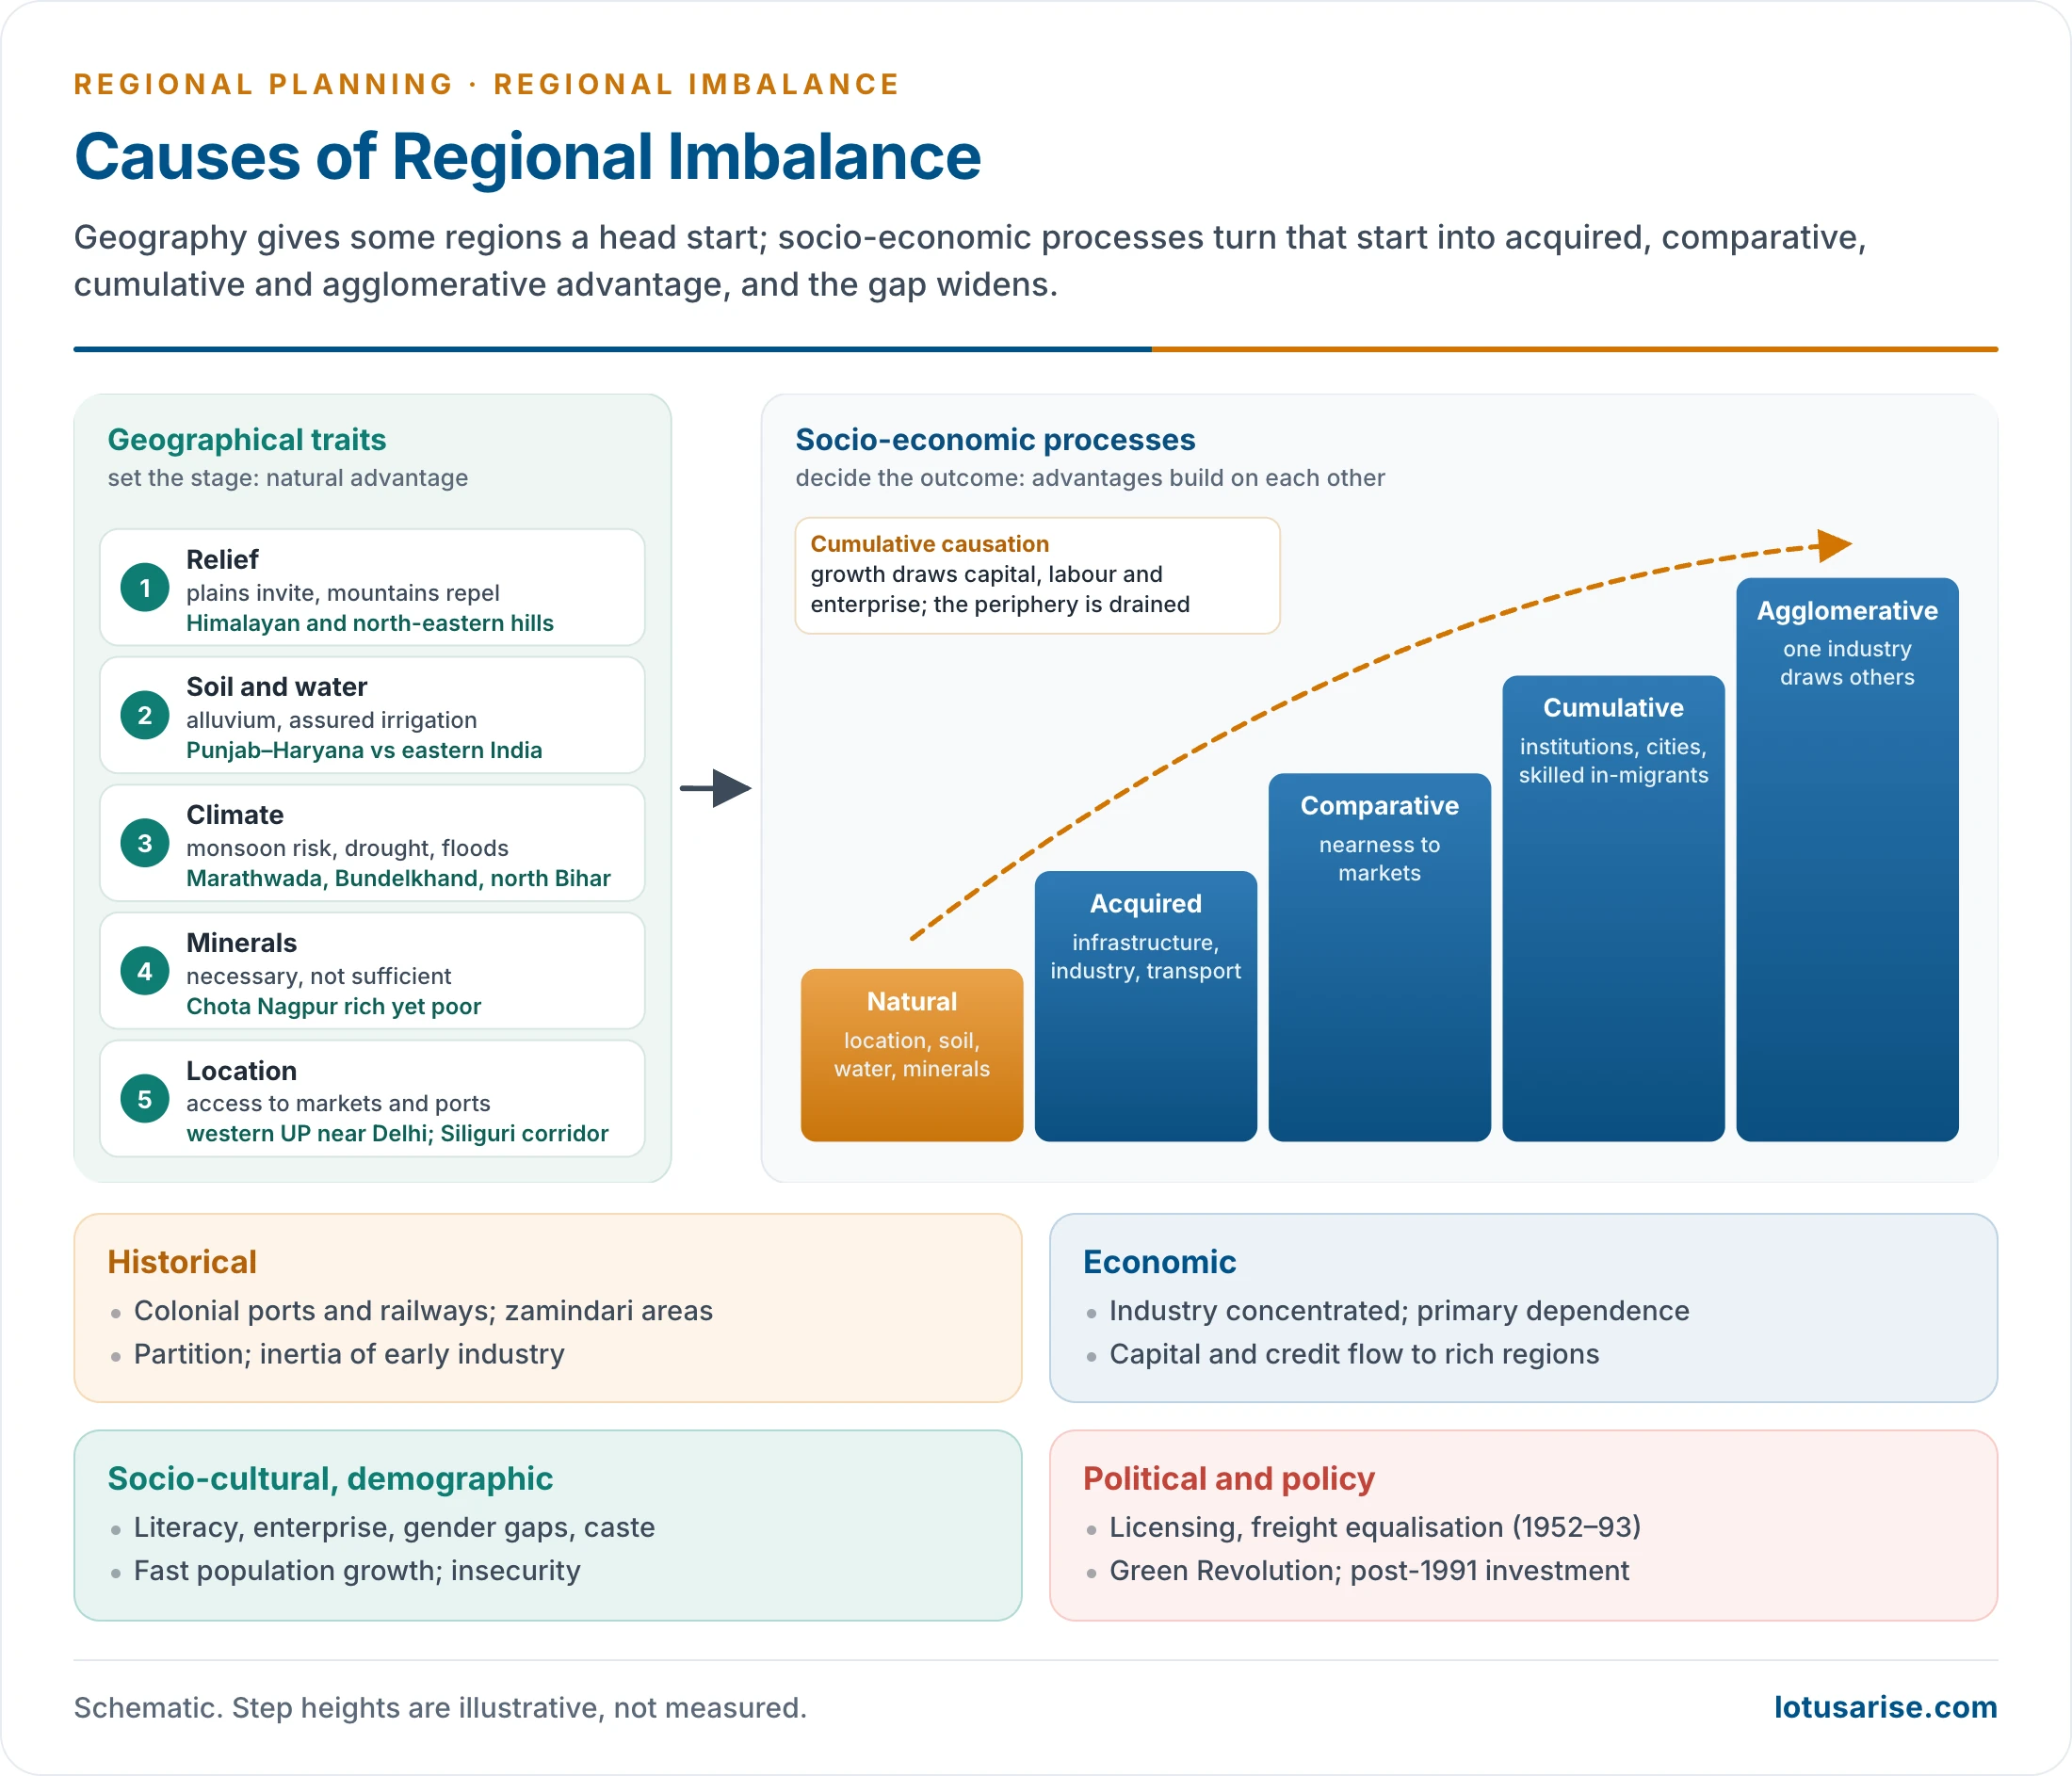
- Relief: plains invite settlement, mountains repel it, deserts deny it and coasts augment it.
- The Himalayan and north-eastern hill States face high costs of transport and construction.
- River basins and soil: Paul Vidal de la Blache saw river basins as gravity centres of civilisation, where nature supports human effort.
- The Nile, Indus, Huang He and Tigris–Euphrates valleys cradled early civilisations. Their modern successors inherited dense population and fertile alluvium.
- The alluvium of the Indo-Gangetic plain contrasts with the thin red and laterite soils of the Chota Nagpur plateau, the Eastern Ghats and Rayalaseema. Vidarbha’s black cotton soil contrasts with Rayalaseema’s degraded red soil.
- Climate: temperate climates favour farm output and human energy, while tropical ones bring a disease burden. Monsoon dependence, drought and floods make output unstable in rain-fed regions, such as Marathwada, Bundelkhand and north Bihar.
- Water: assured irrigation explains much of the Green Revolution’s success in Punjab, Haryana and western Uttar Pradesh, and its late arrival in eastern India.
- Mineral resources: Chota Nagpur holds coal, iron ore and bauxite but remains poor. The north-east has oil, coal, hydropower and forests but remains underdeveloped.
- Resources alone do not create development.
- Location and accessibility:
- Western Uttar Pradesh gains from nearness to Delhi; eastern Uttar Pradesh lacks it.
- Coastal regions reach world markets cheaply; landlocked and hill regions pay more to trade.
- The north-east is joined to the rest of India only by the narrow Siliguri corridor.
Historical Factors
- Colonial pattern of investment:
- Railways, ports and industry were built to move raw materials to Bombay, Calcutta and Madras and manufactures back.
- Hinterlands supplied raw materials without gaining industry, and Indian handicrafts were ruined by machine-made imports.
- The port cities’ lead has persisted through cumulative causation.
- Land tenure: the zamindari areas of the Permanent Settlement (1793), in Bihar, Bengal and Odisha, have lower agricultural investment and productivity than the ryotwari areas, an effect that has lasted long after zamindari was abolished.
- Partition (1947): it cut West Bengal’s jute mills off from the jute fields of East Bengal, and Indian Punjab off from the canal colonies of West Punjab. Sindh’s cotton trade was severed too.
- Seats of power: centres of Mughal, Maratha and princely rule inherited infrastructure and institutions. Peripheral tributary areas did not.
- Industrial inertia: once industry settles in a region, its skilled labour, suppliers and services give it a lasting lead.
Economic Factors
- Concentration of industry: manufacturing gathered in Maharashtra, Gujarat, Tamil Nadu and the Hugli belt; investment followed it. In 1950, Bengal and the western region alone held over 59% of India’s industrial capital.
- Primary-sector dependence: a region that lives on agriculture earns low incomes, saves little and cannot diversify. Purchasing power, demand and investment stay low. Secondary and tertiary regions have high demand, income and exports, and quaternary and quinary activities follow.
- Infrastructure deficit: without roads, power, banking and water, a region cannot attract investment. The deficit is both a cause and a consequence of backwardness.
- Capital flows: capital moves to where returns are highest, which is usually the developed region.
- Bank deposits raised in poor States are lent in rich ones, a backwash of savings.
- Low productivity: a poorly fed, poorly trained and unhealthy workforce produces less, which keeps incomes low.
- Trade pattern: regions exporting raw materials and importing manufactures lose on the terms of trade.
Socio-Cultural and Demographic Factors
- Enterprise and work culture: the trading communities of Gujarat and Rajasthan (Marwaris, Jains, Gujarati merchants) carried industry and finance wherever they settled.
- Education and health: Keralam’s early lead in literacy and health shows how social investment sustains later growth.
- Social structure: rigid caste hierarchies, a low acceptability of innovation, an inward outlook and, in isolated tribal areas, a primitive subsistence economy slow change.
- Gender inequality: low female education and work participation waste half a region’s human capital.
- Demography: rapid population growth, high dependency ratios, unemployment and adverse sex ratios divide each rupee of income among more people.
- Religious dogma and social conservatism can shape the values and work ethos that govern economic life.
- Insecurity: insurgency and Left Wing Extremism in the forested, mineral-rich tribal belt of central and eastern India have kept investment away and driven capital out.
Political and Policy Factors
- Industrial licensing: the Industries (Development and Regulation) Act, 1951 was meant to spread industry. The Industrial Licensing Policy Inquiry Committee (Subimal Dutt, 1969) found that licences had gone largely to the already industrialised States.
- Of 2,293 licences in 1953–61, Bombay, Calcutta and Madras took 35.77%.
- In 1956–66, Maharashtra, West Bengal, Gujarat and Tamil Nadu took 62.42%; Bihar and Odisha only 6.34%.
- Financial institutions lent more per head in developed States, often to the backward pockets of developed States rather than to backward States. Assistance per head ran at ₹255 in Maharashtra against ₹56 in Bihar, about 4.5 : 1.
- Freight equalisation (1952–93): uniform rail freight on steel and coal across the country took away the locational advantage of the mineral-rich eastern States.
- Public investment often went to accessible, already developed sites, or followed political influence rather than need.
- Sectoral plans with spatial effects: the Green Revolution favoured irrigated north-western India and widened the gap with the east.
- Liberalisation (1991): private and foreign investment flowed mainly to the advanced western and southern States.
- Geopolitics: wars, oil shocks and supply disruptions drain national resources and cut spending on backward areas.
Geographical Traits or Socio-Economic Processes?
- Geography sets the stage. Relief, soil, water, minerals and location give some regions a natural advantage.
- Socio-economic processes decide the outcome. They turn small initial advantages into large, lasting gaps:
- Acquired advantage: infrastructure, industry and transport built on the natural base.
- Comparative advantage: nearness to markets, as western Uttar Pradesh has near Delhi.
- Cumulative advantage: social and economic sectors, urbanisation, institutions and in-migration of skilled and unskilled labour build on each other.
- Agglomerative advantage: one industry draws others by providing common power, transport and labour.
- The evidence weighs on the side of socio-economic processes:
- Mineral-rich Jharkhand and Odisha lag, while resource-poor Keralam (Kerala) and Tamil Nadu have advanced.
- Kalahandi’s bauxite has drawn industry, yet the surrounding blocks remain among the poorest in Odisha.
- Vidarbha stays behind western Maharashtra within one State and one policy regime.
- How these forces work, and whether they ever reverse, is explained by the theories of regional imbalance: Myrdal’s cumulative causation, Hirschman’s trickling down, Friedmann’s core–periphery model and Williamson’s inverted U.
Regional Imbalances in India
Evolution
- At Independence: industry, banking and infrastructure were concentrated around Bombay, Calcutta and Madras and in a few princely States. The vast interior was agrarian.
- Planning era (1951–1990):
- Public-sector plants were sited in backward, mineral-rich areas; special area programmes and incentives for backward districts followed from the late 1960s.
- The Green Revolution, however, enriched the irrigated north-west, and the four industrial States kept their lead.
- After 1991: liberalisation let private and foreign investment choose its location. It chose the western and southern States, coastal and metropolitan regions with infrastructure, skills and ports.
- The eastern States lost their old industrial lead: West Bengal declined as a manufacturing State, and Bihar’s division in 2000 left the mineral belt in Jharkhand.
- Since 2014–15: poorer States have grown faster in some years, and social indicators (poverty, sanitation, electricity, banking access) have converged faster than income. Income gaps between States have not closed.
Pattern of Inter-State Disparity
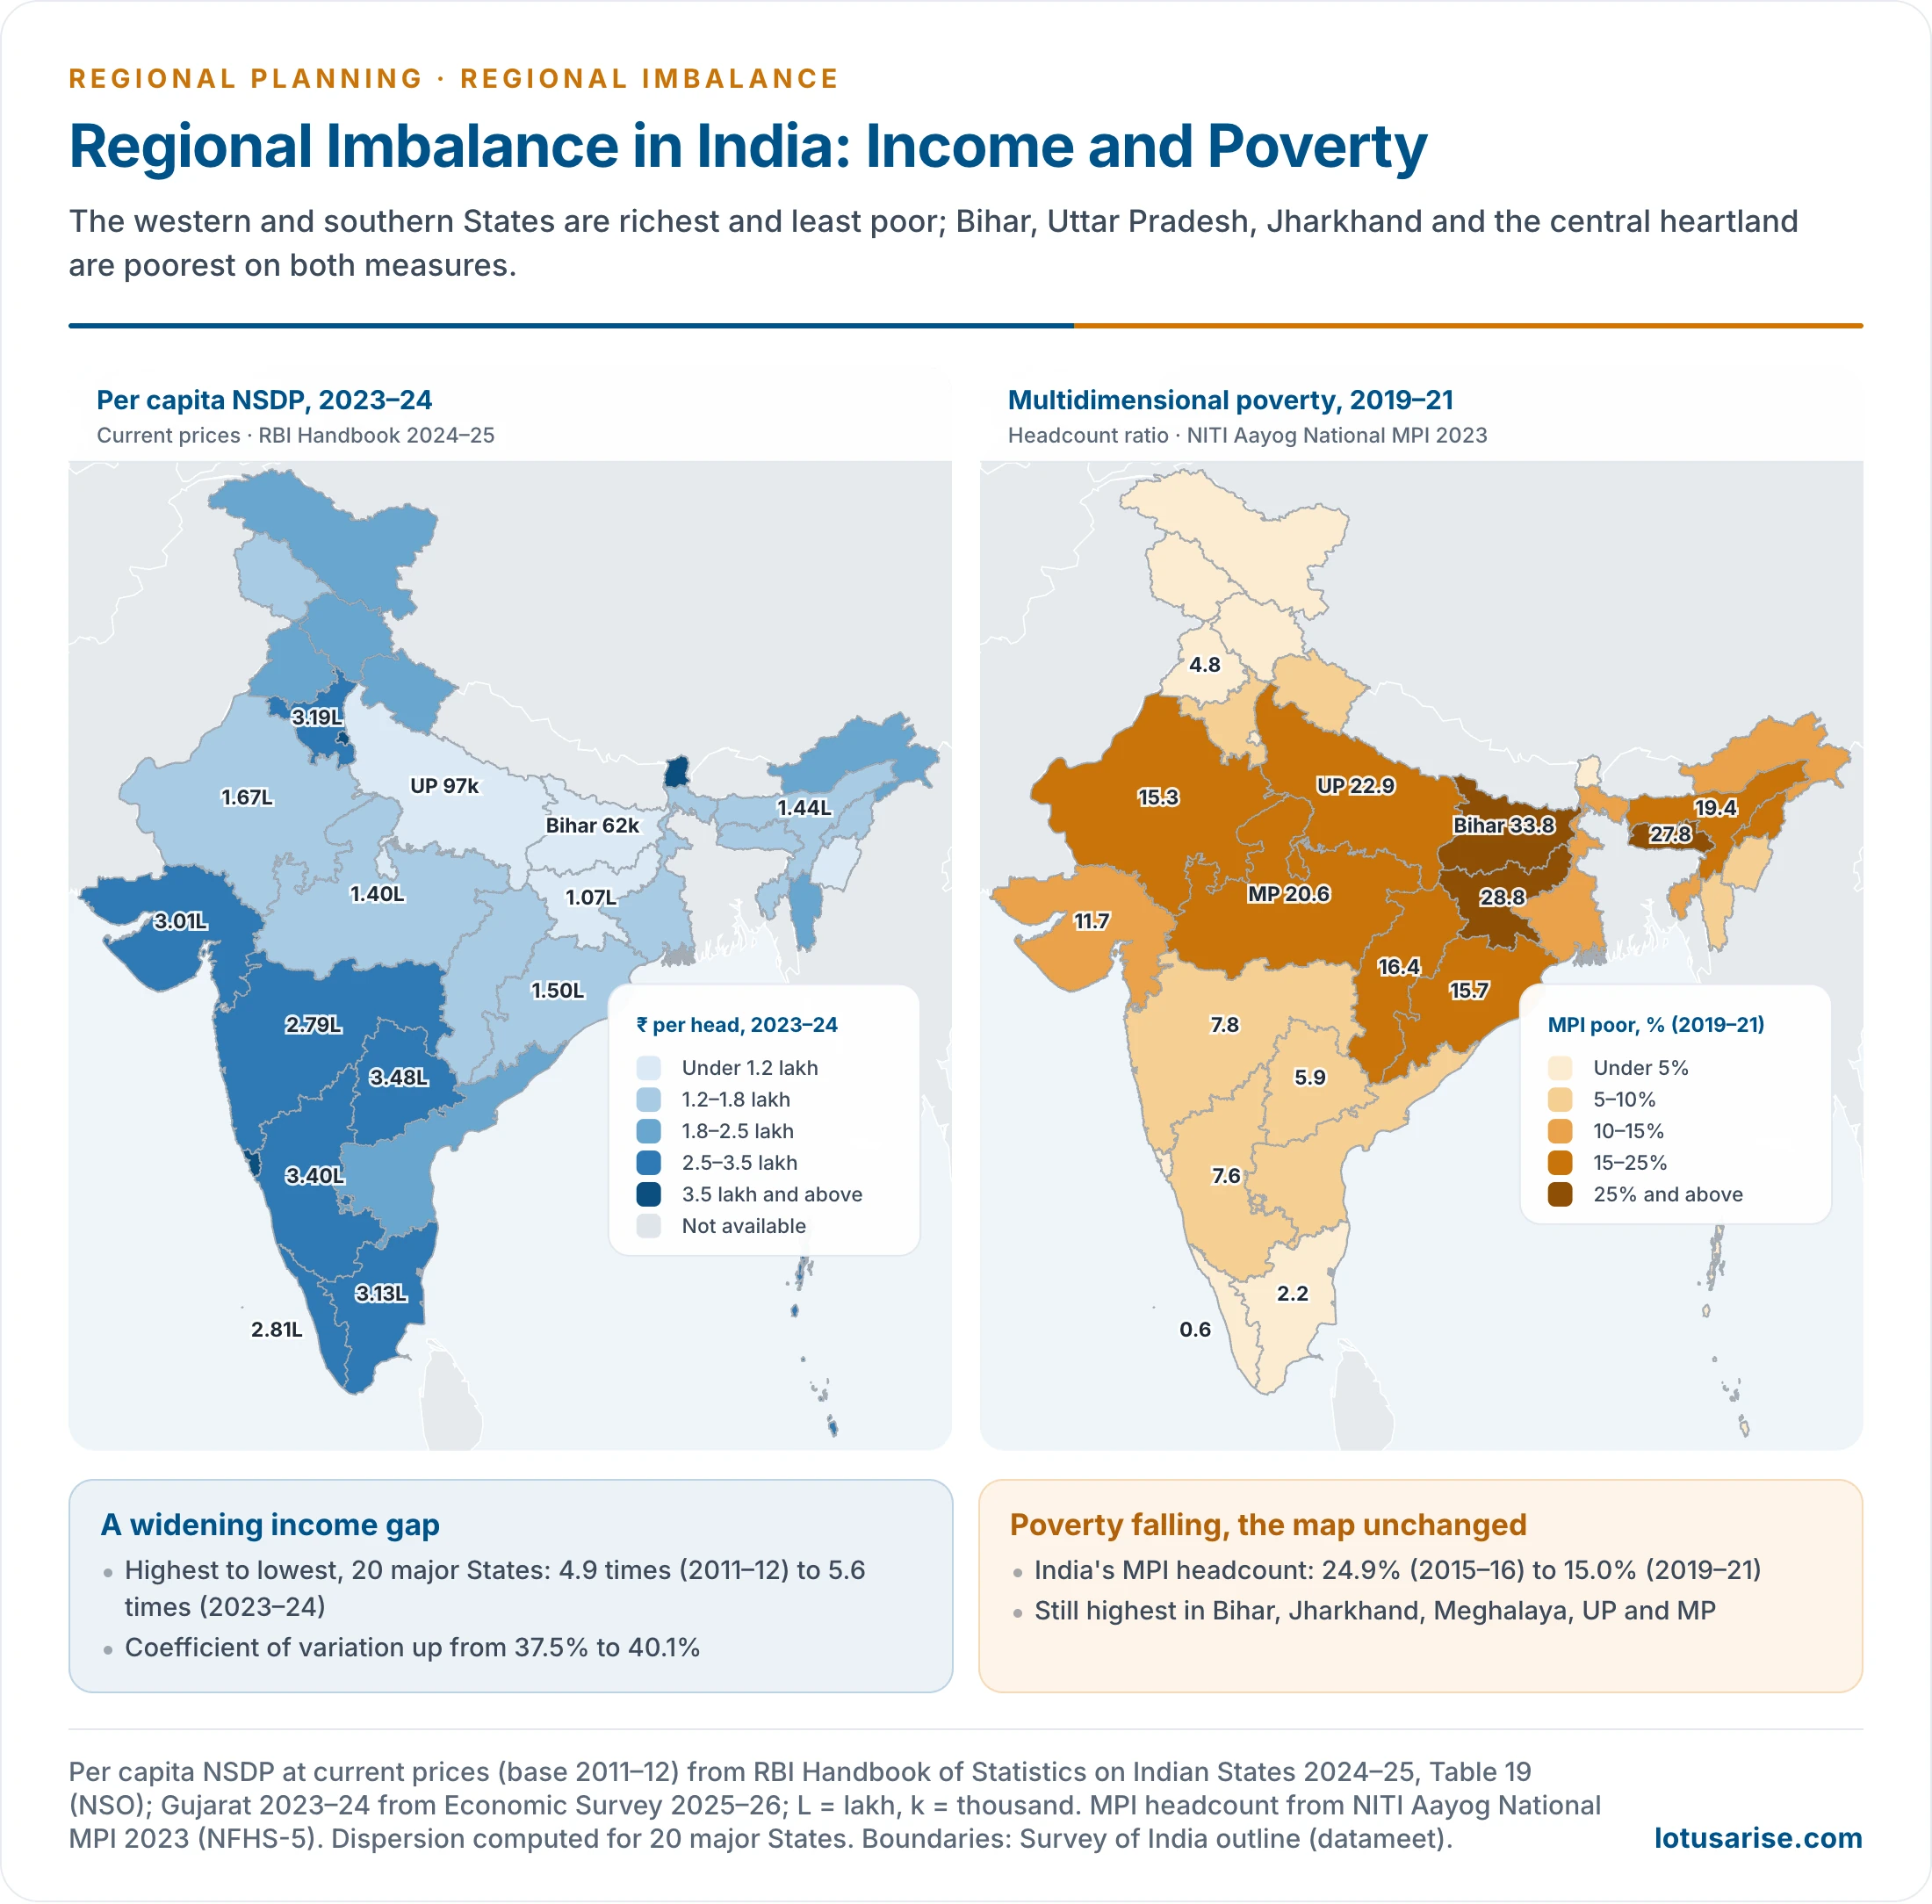
- Income: per capita NSDP at current prices for 2023–24 (RBI Handbook of Statistics on Indian States 2024–25):
- Highest: Sikkim (₹5.88 lakh) and Goa (₹5.86 lakh), then Delhi and Chandigarh.
- Highest among large States: Telangana (₹3.48 lakh), Karnataka (₹3.40 lakh), Haryana (₹3.19 lakh), Tamil Nadu (₹3.13 lakh) and Gujarat (₹3.01 lakh).
- Lowest: Bihar (₹62,201), Uttar Pradesh (₹97,364), Jharkhand (₹1.07 lakh) and Manipur (₹1.20 lakh).
- Telangana’s figure is 5.6 times Bihar’s; Goa’s is over nine times.
- The gap is widening. Across the 20 major States, the ratio of the highest to the lowest per capita NSDP rose from 4.9 in 2011–12 to 5.6 in 2023–24. The coefficient of variation rose from about 37.5% to 40%.
- Poorer States have grown, but not fast enough to catch up. This is divergence, not convergence.
- Multidimensional poverty (National MPI 2023, NFHS-5, 2019–21):
- India’s headcount ratio fell from 24.85% (2015–16) to 14.96% (2019–21).
- Highest: Bihar (33.8%), Jharkhand (28.8%), Meghalaya (27.8%), Uttar Pradesh (22.9%) and Madhya Pradesh (20.6%).
- Lowest: Keralam (0.55%), Goa, Puducherry and Tamil Nadu (2.2%).
- NITI Aayog’s 2024 discussion paper estimated that 24.82 crore people escaped multidimensional poverty between 2013–14 and 2022–23. The largest numbers were in Uttar Pradesh, Bihar and Madhya Pradesh, the States with the most poor.
- SDG India Index 2023–24: India’s score rose to 71. Keralam and Uttarakhand led with 79; Bihar (57) and Jharkhand (62) came last.
- Rural–urban: in 2023–24, average monthly per capita consumption was ₹4,122 in rural and ₹6,996 in urban India (HCES 2023–24).
- The urban–rural gap narrowed from 84% of rural spending in 2011–12 to 70%.
- The broad pattern:
- A prosperous western and southern belt (Gujarat, Maharashtra, Karnataka, Telangana, Tamil Nadu, Keralam), with the north-western core of Delhi, Haryana and Punjab.
- A lagging central and eastern heartland: Bihar, Uttar Pradesh, Jharkhand, Madhya Pradesh, Odisha and Chhattisgarh. Its older core was the “BIMARU” States (Bihar, Madhya Pradesh, Rajasthan, Uttar Pradesh).
- The north-east, held back by isolation, though small States such as Sikkim and Mizoram score well.
- Rajasthan and Odisha have moved up in recent decades, so the old BIMARU grouping is now loose.
- These patterns, with their sectoral detail, are part of the wider study of regional disparities in economic development.
Intra-State Imbalances
- Maharashtra: Mumbai–Pune–Nashik against Vidarbha and Marathwada. Article 371(2) provides separate development boards for these regions (constituted in 1994), and for Saurashtra and Kutch in Gujarat.
- Andhra Pradesh and Telangana: decades of agitation over the backwardness of Telangana, from 1969 onwards, ended in the creation of Telangana on 2 June 2014.
- Karnataka: the north-eastern Kalyana-Karnataka (Hyderabad-Karnataka) region lags the south; Article 371J (2012) gives it special provisions.
- Uttar Pradesh: prosperous western districts against eastern Uttar Pradesh and Bundelkhand.
- Odisha: the coastal districts against the KBK (Koraput–Bolangir–Kalahandi) region.
- Gujarat and Rajasthan: the industrial Ahmedabad–Vadodara–Surat belt against the tribal east; irrigated north-east Rajasthan against the desert west.
- West Bengal: Kolkata and its surroundings against the north and the western plateau districts.
- Metropolitan islands: Bengaluru and Gurugram generate a large share of their States’ output, far ahead of the districts around them.
Consequences
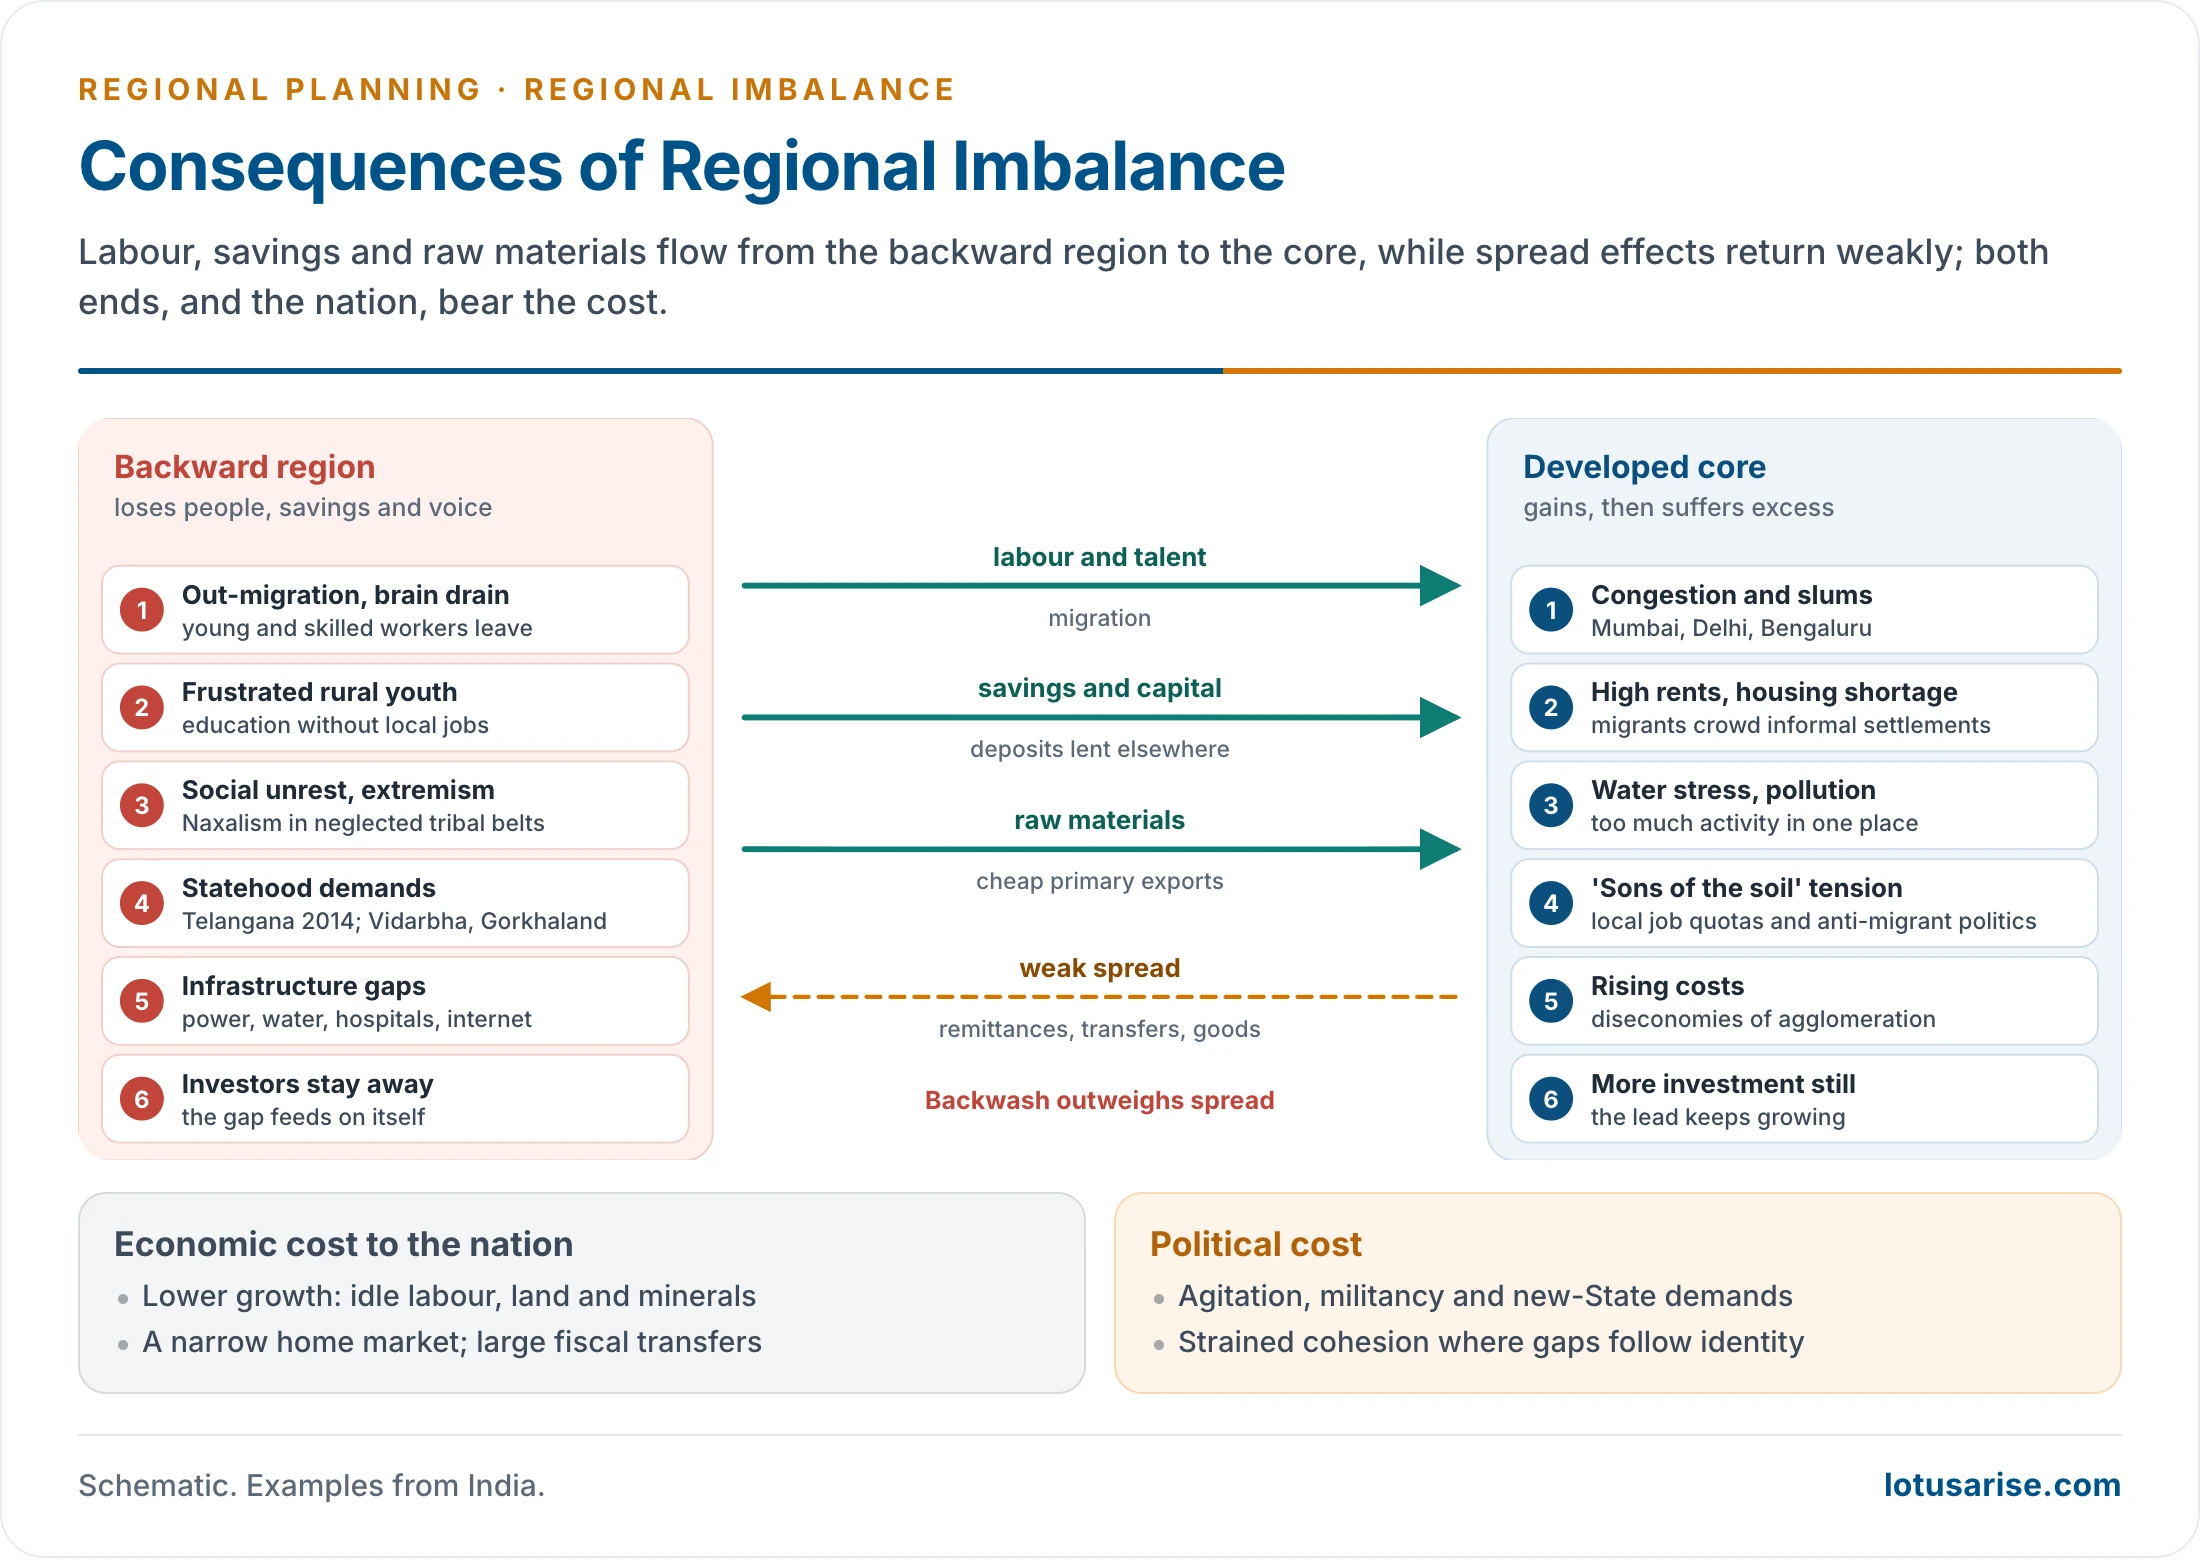
- Migration: people move from backward to developed regions in search of work.
- Railway passenger data suggest about 90 lakh inter-State migrants a year in 2011–16 (Economic Survey 2016–17). The main flows run from Bihar and Uttar Pradesh towards Delhi, Maharashtra, Gujarat and the south, and from the north-east to Bengaluru.
- Sending regions lose young, skilled workers; receiving cities strain.
- Agitations and demands for statehood: Telangana (formed 2014); continuing demands for Vidarbha, Gorkhaland and Bodoland.
- Social unrest and extremism: Naxalism took root in long-neglected tribal districts, and insurgency in the north-east, where deprivation meets ethnic, linguistic or tribal identity.
- “Sons of the soil” movements against migrants, and laws reserving private jobs for local people, such as Haryana’s 75% quota law of 2020, which the Punjab and Haryana High Court struck down in 2023.
- Over-concentration at the core: congestion, slums, high rents, water shortages and pollution in Mumbai, Delhi, Chennai, Bengaluru and Hyderabad.
- Frustration among rural youth, educated but without local jobs.
- Under-developed infrastructure in backward areas: unreliable power, poor housing, unsafe water, few hospitals and doctors, weak telecom and internet.
- Aggravation of the imbalance: prosperous areas attract still more investment, so their lead grows.
- Loss to the nation: under-used human and natural resources lower national growth.
- Disparities feed resentment and populism and can threaten national cohesion, especially where they coincide with ethnic, linguistic or religious divisions.
Impact on Economic Development
- Lower national growth: when large regions stay poor, the country uses only part of its labour, land and minerals.
- Narrow home market: low incomes in populous States limit demand for manufactures and services.
- Inefficiency at both ends: diseconomies of congestion raise costs in the core, while infrastructure in lagging regions stays under-used.
- Fiscal strain: large transfers to poorer States are needed every year, and centres of growth resist sharing their tax base. This sets “giving” States against “receiving” ones over sharing formulas.
- Inequality of opportunity: a child born in Bihar faces different life chances from one born in Keralam, a gap in intergenerational mobility that sits badly with constitutional equity.
- Human capital gaps: poor health and schooling in lagging regions lower the productivity of the workers they send to the rest of India.
- Investment risk: unrest and weak governance in neglected regions deter investment there, which deepens the imbalance.
Balanced and Unbalanced Growth
Concept of Balanced Regional Growth
- For Roy Harrod, balanced growth exists where the growth rates of per capita income, economic output and resources are equal.
- Balanced growth means development across all sectors and regions, in which economic growth goes together with human development.
- It does not mean equal output everywhere. It means narrowing gaps in opportunity and well-being, so every region grows on the basis of its own potential.
- Two dimensions:
- Spatial: balance between regions (inter-regional) and within them (intra-regional).
- Social: balance between classes, castes, tribes and genders, so that SC and ST communities reach the same services and opportunities as others.
- Two scopes:
- Global: narrowing the gap between North and South.
- National and regional: narrowing gaps between States, and between districts within States.
The Balanced Growth Doctrine
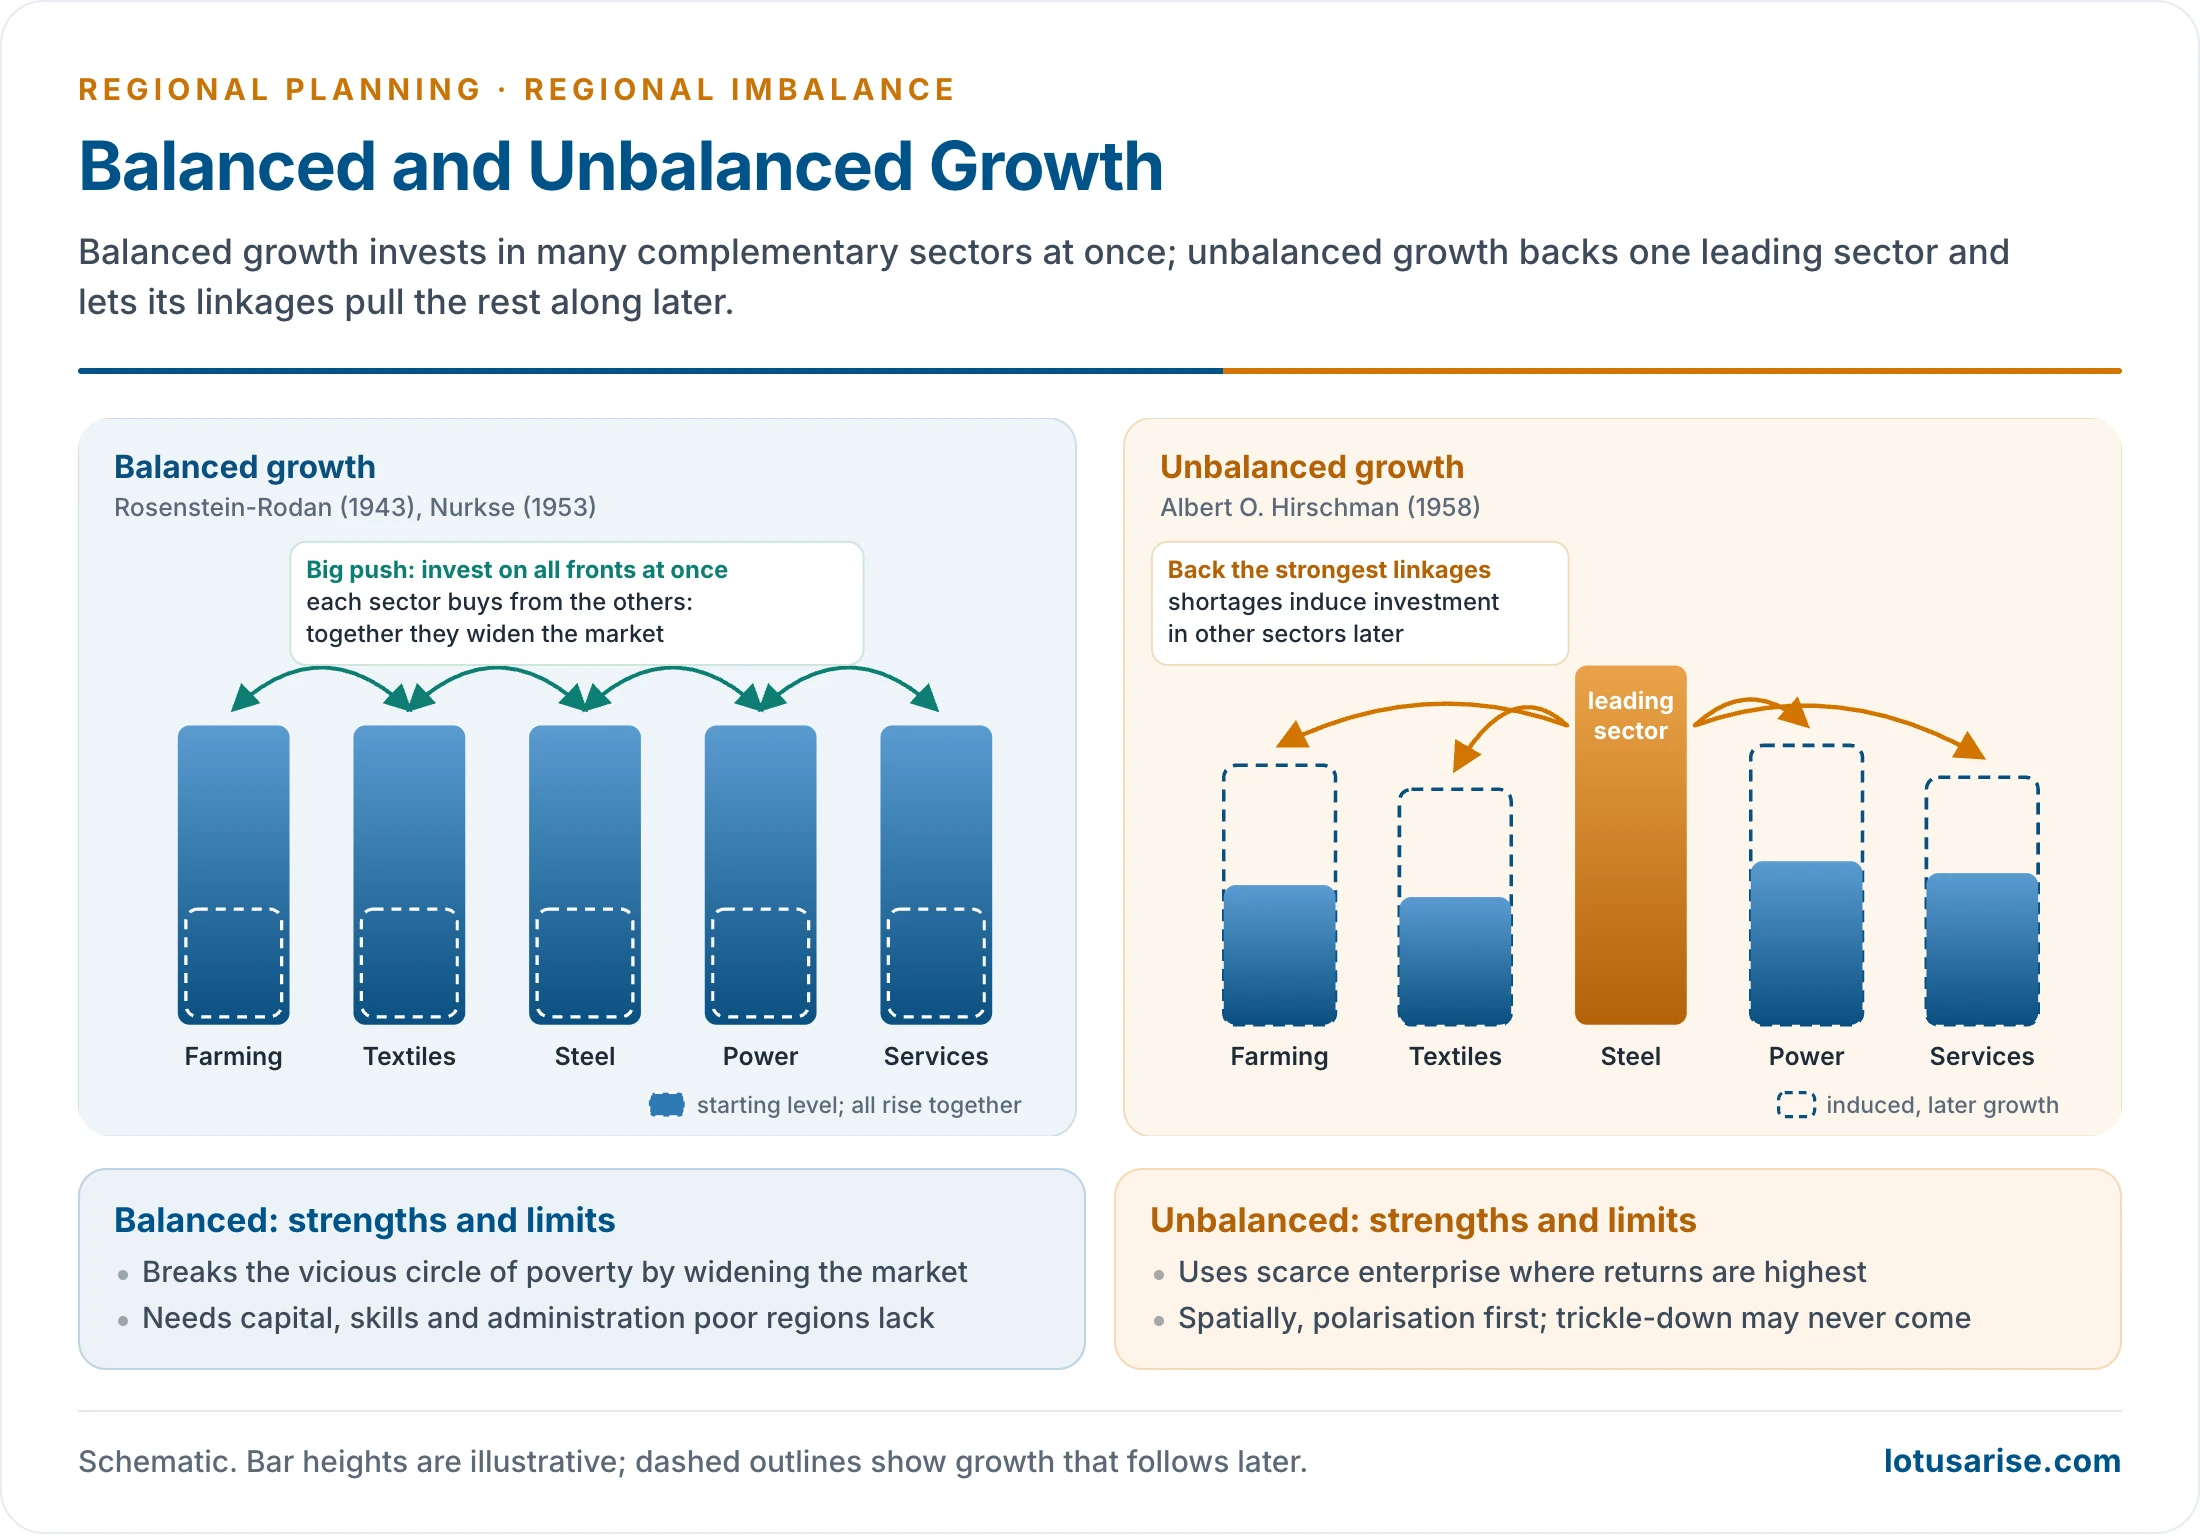
- Paul Rosenstein-Rodan (1943), writing on eastern and south-eastern Europe, argued for a “big push”: large, simultaneous investment in many complementary industries.
- Factories built together create markets for one another, which no single factory could do alone.
- Ragnar Nurkse (1953) built on this in Problems of Capital Formation in Underdeveloped Countries.
- Poor countries are caught in a vicious circle of poverty: low income → low saving and low demand → low investment → low income.
- Only balanced investment across many sectors widens the market enough to break the circle.
- Critique: a poor country lacks the capital, skills and administration to invest on all fronts at once.
The Unbalanced Growth Doctrine
- Albert O. Hirschman (1958), in The Strategy of Economic Development, argued that the scarce resource is decision-making, not capital.
- Investment should go to leading sectors with the strongest backward and forward linkages.
- The shortages and pressures these create induce investment in other sectors. Growth is a chain of disequilibria.
- Spatially, Hirschman held that concentration in a few growth points is efficient. Polarisation comes first; trickling-down to other regions follows. This idea is developed in growth pole theory.
- Critique: trickle-down may take decades or never come. The leading regions can lock in their lead, as Myrdal warned.
| Basis | Balanced growth | Unbalanced growth |
|---|---|---|
| Proponents | Rosenstein-Rodan (1943), Nurkse (1953) | Hirschman (1958) |
| Investment | Simultaneous, across many sectors and regions | Concentrated in leading sectors and growth points |
| Scarce factor | Size of the market | Decision-making and entrepreneurship |
| Mechanism | Complementary demand widens the market | Linkages and shortages induce further investment |
| Spatial result | Dispersed growth | Polarisation first, trickling-down later |
| Weakness | Needs capital and skills poor countries lack | Spread may never come; gaps widen |
| Indian trace | Backward-area and special-area programmes | Second Plan heavy industry; today’s corridors |
Balanced Regional Development in Indian Planning
- Balanced regional development has been a stated aim of planning since the 1950s.
- The Second Plan (1956–61) followed an unbalanced sectoral strategy: heavy industry first. It placed the new public-sector steel plants (Bhilai, Rourkela, Durgapur) in backward, mineral-rich regions, on Alfred Weber’s principle of least-cost location, in the hope that they would act as growth poles and spread multiplier effects.
- The local people mostly got unskilled jobs, displaced communities lost their land and way of life, and the hinterlands lagged.
- India has since used a mix of instruments:
- fiscal transfers: the 16th Finance Commission (2026–31) kept the States’ share at 41% and gives the largest weight (42.5%) to income distance, which favours poorer States. Population, demographic performance, area and forest cover also count;
- Special Category Status for hilly, tribal and frontier States (Himachal Pradesh, Uttarakhand, the north-eastern States, Jammu and Kashmir before it became a Union Territory): 90 : 10 central funding of schemes against 60 : 40 for general States;
- the Backward Regions Grant Fund (2007): untied grants straight to Panchayati Raj institutions in 272 backward districts. Central support ended in 2015;
- industrial location policy:
- licensing reform after the Pande Committee (1968) gave more licences to backward areas, though backward parts of developed States gained most;
- special economic zones and industrial corridors (Delhi–Mumbai, Chennai–Bengaluru, Amritsar–Kolkata) carry growth along transport spines;
- special area programmes and the aspirational districts and blocks approach (table below);
- decentralised, bottom-up planning through Panchayati Raj and multi-level planning:
- the 73rd Amendment (1992): three tiers, the Gram Sabha, one-third of seats for women;
- District Planning Committees (Article 243ZD) consolidate panchayat and urban plans;
- Kerala’s People’s Planning Campaign (1996) devolved 35–40% of State plan funds to local bodies, the best-known such case;
- spatial diffusion:
- hierarchical: innovations pass from metropolis to State capital, district town, tehsil town and village, with poles as relay stations, so medium towns must be strengthened;
- contagion: adjacent areas benefit first, so roads, rail and telecom must keep distance from blocking the spread;
- two planning approaches:
- spatial: area-specific goals, such as tourism to cut poverty in hill areas or watersheds in drought-prone districts;
- temporal: time-bound goals, such as doubling farmers’ income by 2022 or poverty targets for aspirational districts;
- central place theory, growth poles and growth centres put these into practice: planners decide which activity belongs at which level of the hierarchy.
- fiscal transfers: the 16th Finance Commission (2026–31) kept the States’ share at 41% and gives the largest weight (42.5%) to income distance, which favours poorer States. Population, demographic performance, area and forest cover also count;
| Programme | Target area | Approach | Status |
|---|---|---|---|
| Drought Prone Areas Programme (1973) | 70+ drought-prone districts | Watersheds, soil conservation, alternative livelihoods | Merged into watershed programmes, now the watershed component of PMKSY |
| Desert Development Programme (1977) | Thar fringe districts | Dune stabilisation, shelter belts, water harvesting | As above |
| Hill Area Development Programme (Fifth Plan) | Hill districts of Uttar Pradesh, West Bengal, Assam, Himachal Pradesh | Horticulture, connectivity, erosion control | See backward area planning |
| Tribal Sub-Plan (1974) | Scheduled Tribe areas | Funds ring-fenced by tribal population share | Now the Development Action Plan for Scheduled Tribes |
| Integrated Rural Development Programme (1980) | Rural households below the poverty line | Assets and subsidised credit for self-employment | Merged into SGSY (1999), then the National Rural Livelihoods Mission |
| Command Area Development (1974) | Major irrigation commands | Field channels, warabandi, last-mile water | Under PMKSY |
| Aspirational Districts (2018) | 112 backward districts | Real-time delta ranking on 49 indicators; convergence of schemes | Running; blocks added in 2023 |
- How far these planning instruments have reduced regional imbalance in India is a separate assessment.
Outlook
- Regional imbalance threatens inclusive growth and poverty reduction. It slows reform, can become a drag on national growth, and fuels regional tension, agitation and at times militancy.
- Neglect of backward regions within States has produced demands for new States: Telangana in the past; Vidarbha and Bodoland now and then.
- The way forward lies in good governance in backward areas: stronger, better-funded local bodies, investment in human capital and connectivity, and plans built on each region’s own resources.
- Measures commonly proposed:
- Identify and fund: composite criteria with the mandal or block as the unit (poverty, literacy, infant mortality, social and economic infrastructure), block-wise devolution, and a greater share of the central pool for backward States.
- Reward and enforce: rewards to States that cut intra-State gaps; political will; accountable local governments; regional boards with legal powers and funds, on the lines of Article 371(2).
- Invest: incentives and new financial institutions in backward regions; growth corridors with education, farm and industrial zones; forward and backward linkages; cottage and small industries; roads and railways.
- Services: free and compulsory schooling, hospitals and dispensaries, water for homes and fields, special grants for backward and tribal areas.
- Land and resources: limits on turning productive farmland to other uses, with farmers guaranteed a better life first; natural resources used for tribal development; improved dry farming; special area programmes.
Previous Year Questions
2025‘Regional imbalances are the product of socio-economic factors.’ Elucidate with examples.2024India has wide-ranging regional disparities in economic development. Explain the patterns, implications and challenges.2022Explain in detail the impact of regional disparities on economic development.2016Examine the causes of regional disparities in economic development in India.2015“Geographical traits lead to regional imbalances.” Examine.2003Write short note: Regional imbalance.2001Examine the spatial patterns of development disparity prevailing in the world.1999Analyse the causes of regional disparities in the economic development of India and suggest measures for their removal.1996Write short note: Magnitude of regional imbalances in economic development in India.1993Write short note: Major causes for regional disparities in the development of India.





Thnqq for such valuable content.
Thank u for providing this type of notes for free but Please (request to you) provide straight to the point notes and skip the unnecessary content.Jai Hind…..
baba u r the best
I really want to say thanks from my heart for your effort. It is actually beyond the price.
sir how religion cause regional imbalance can u give some eg ??
religion is one of the factors for population explosion e.g. in some religions there’s a want for male children for the last ritual to be carried on that lead to the birth of more child until a couple gets a baby boy. It may cause overpopulation, and less scope for health and education–the deterioration of human capital. e.g. in U.P., Bihar, and Bengal which are agriculturists have wanted, male children. While Kerela has a good family planning program and a positive sex ratio!
P.S. no factor influences anything in isolate. Intermingling of factors actually causes differentiation.
Need to change the article given in regional development board it’s not 321 D it is 371(2)