

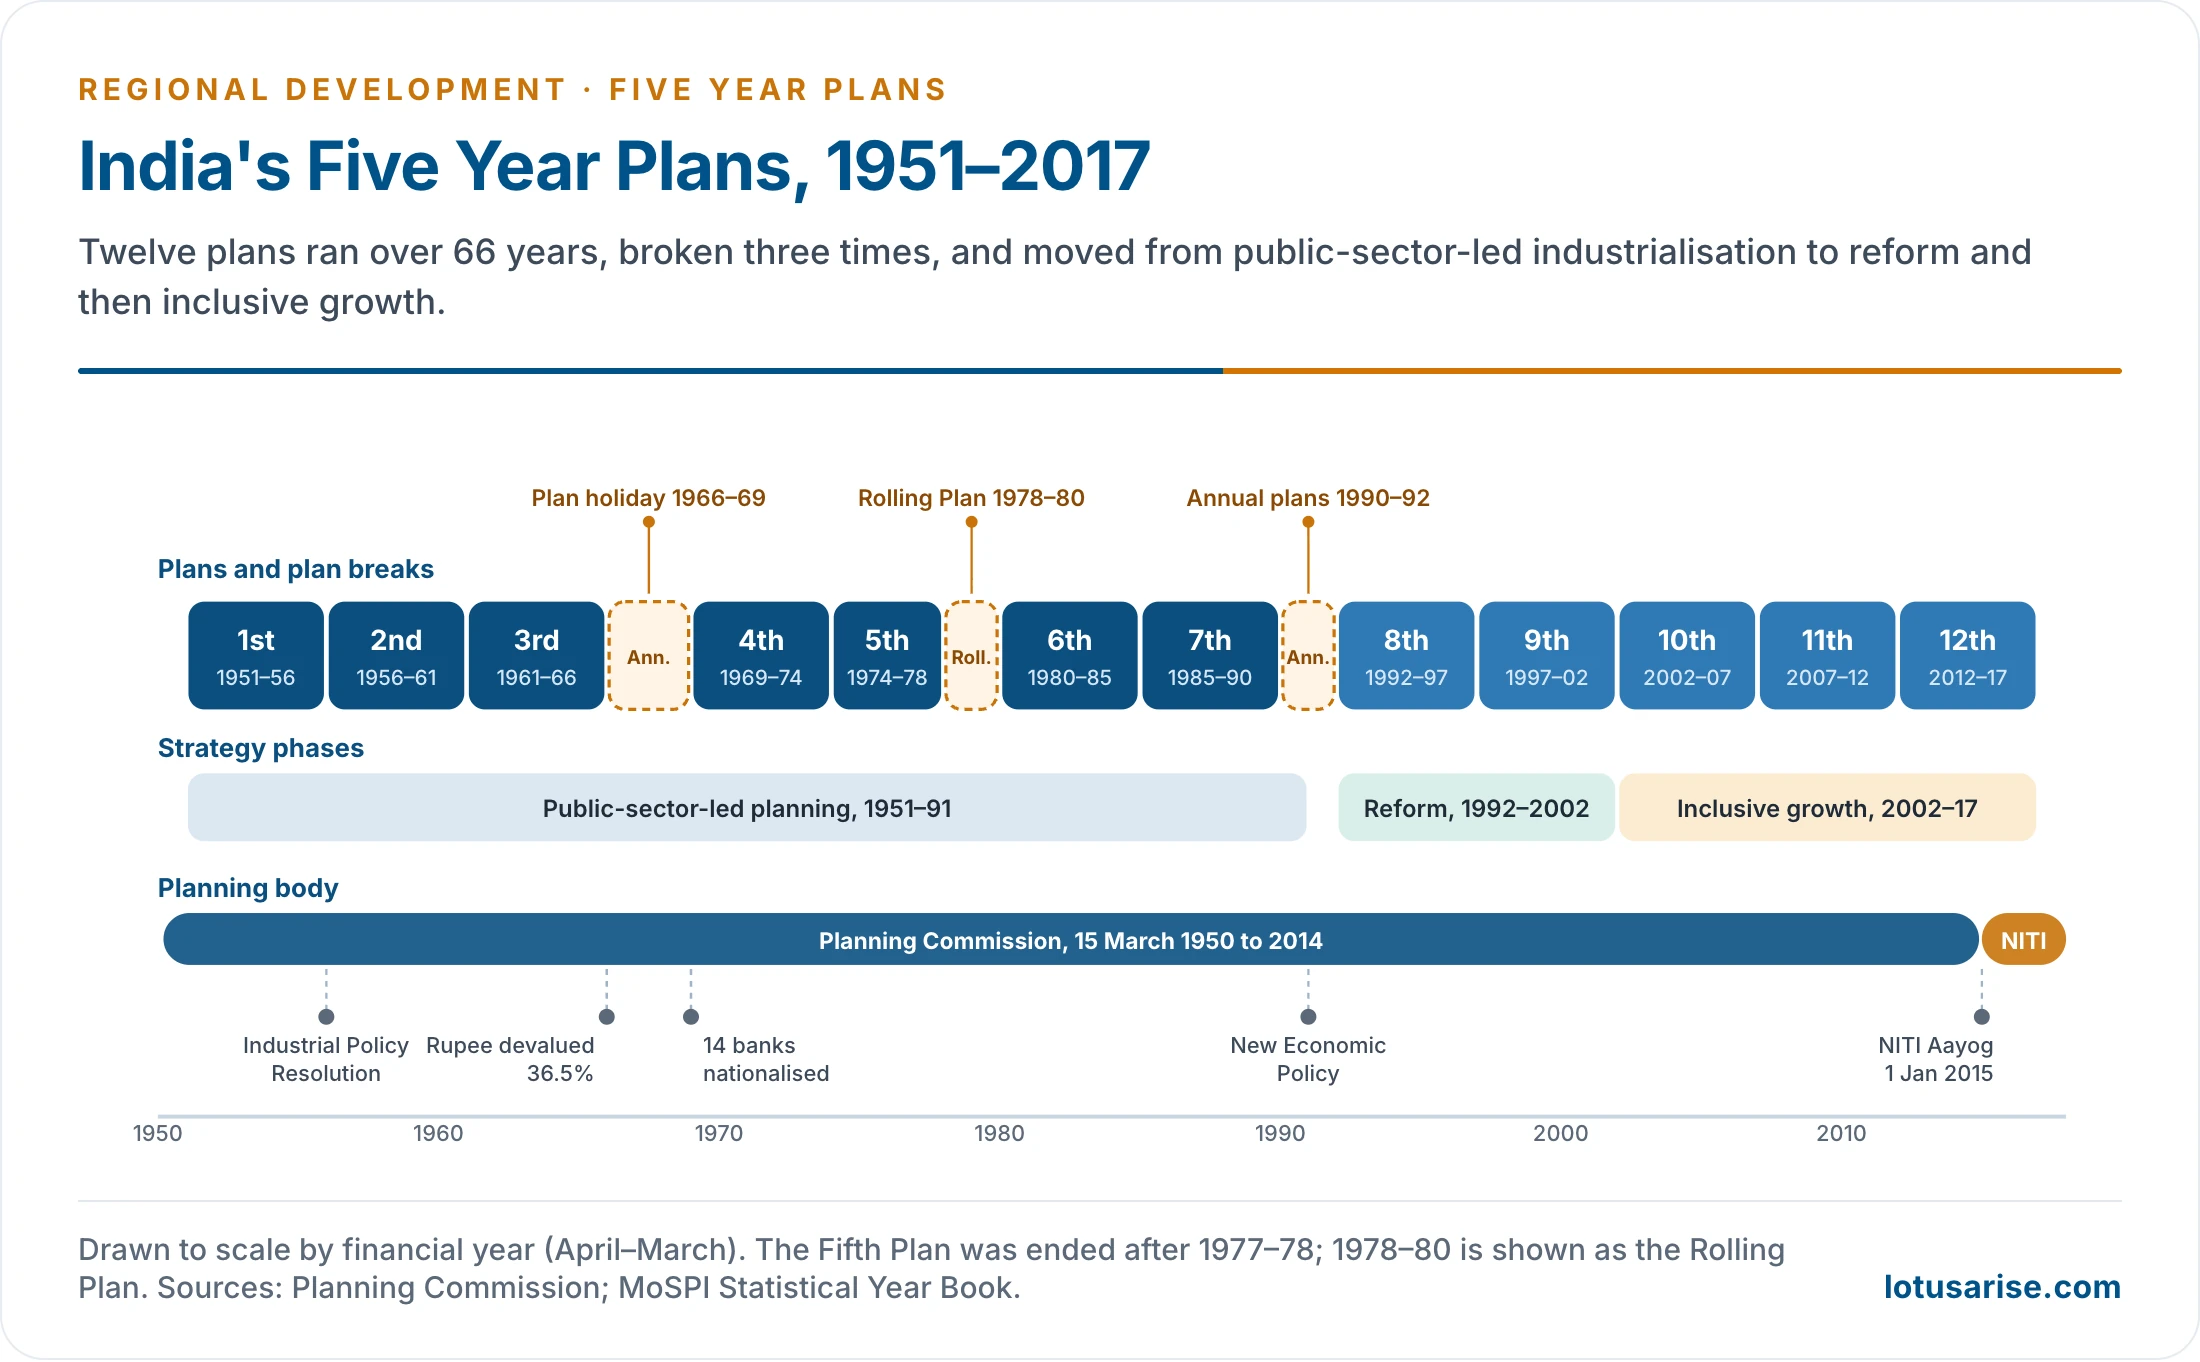
- Five Year Plans were India’s main instrument of economic planning from 1 April 1951 to 31 March 2017: twelve plans, three annual-plan breaks and one rolling plan, drawn up by the Planning Commission and approved by the National Development Council.
- Each plan ran for five financial years, from 1 April of its first year to 31 March of its last, and set growth targets, sector outlays and programmes.
- The first eight plans built a public-sector-led economy of heavy and basic industry. From the Ninth Plan (1997–2002) the state became a facilitator of growth led by private enterprise.
- Read regionally, the plans are also a record of how India tried to spread development: from river valley projects and steel towns to area programmes, decentralisation and inclusive growth.
The Framework of the Plans
Origin and Long-Term Objectives
- The Constitution came into force on 26 January 1950. The Planning Commission was set up on 15 March 1950, and the plan era began on 1 April 1951 with the First Plan.
- Five-year planning was taken from the Soviet Union, under the socialist influence of the first Prime Minister, Jawaharlal Nehru, but adapted to a democracy and a mixed economy.
- The long-term objectives were common to all plans:
- a high growth rate, to raise living standards;
- economic stability;
- a self-reliant economy;
- social justice and reduced inequality;
- modernisation of the economy;
- from the Third Plan, balanced regional development.
How the Plans Ran
- Plan holiday (1966–69): after the failure of the Third Plan, three annual plans replaced the Fourth, which began only in 1969.
- Fifth Plan cut short: the Indira Gandhi government launched it in 1974. The Janata government ended it after 1977–78, a year early.
- Rolling Plan (1978–80): the Janata government introduced it from 1978 as its own Sixth Plan for 1978–83.
- The returning Indira Gandhi government abandoned it and began a new Sixth Plan in 1980. The year 1978–79 was counted back to the Fifth Plan.
- Annual plans (1990–92): political instability and the balance of payments crisis delayed the Eighth Plan by two years, to 1992.
- End of the plans: the Twelfth Plan (2012–17) was the last. The Planning Commission was replaced by NITI Aayog on 1 January 2015, two years before the plan ended.
Phases and Models
- The twelve plans fall into three phases:
- public-sector-led planning (1951–91): heavy industry, import substitution, licensing and a growing state;
- reform and indicative planning (1992–2002): the state steps back from industry, and the private sector leads investment;
- inclusive growth (2002–17): monitorable social targets, rights-based programmes such as rural employment, and State-wise targets.
- The models changed with the phases:
- the First Plan used the aggregate Harrod–Domar model;
- the Second used Mahalanobis’s sectoral models of capital-goods-led growth;
- later plans used input–output and consistency models, checking that sector targets fitted together.
- From the Eighth Plan, targets for the private sector became indicative, while public outlays remained firm.
List of Five Year Plans
| Plan | Period | Model or theme | Growth target (% a year) | Growth achieved (% a year) | Regional measure |
|---|---|---|---|---|---|
| First | 1951–56 | Harrod–Domar; agriculture, irrigation, refugees | 2.1 | 3.6 | Multipurpose river valley projects; Community Development Programme (1952) |
| Second | 1956–61 | Mahalanobis; heavy industry | 4.5 | 4.3 | Public steel plants at Bhilai, Rourkela, Durgapur in backward mineral regions |
| Third | 1961–66 | Self-reliant, self-generating economy | 5.6 | 2.8 | First chapter on balanced regional development; Panchayati Raj bodies |
| Annual Plans | 1966–69 | Plan holiday; new agricultural strategy | – | – | High-yielding varieties in irrigated districts; backward-area working groups (1968) |
| Fourth | 1969–74 | Growth with stability, self-reliance | 5.7 | 3.3 | Backward-district incentives (1970–71); SFDA, MFAL (1971); DPAP (1973) |
| Fifth | 1974–79 | Removal of poverty, self-reliance | 4.4 | 4.8 | Minimum Needs Programme; Command Area, Hill Area and Tribal Sub-Plan (1974–75) |
| Rolling Plan | 1978–80 | Employment, small industry | – | – | Desert Development Programme (1977–78); Food for Work (1977) |
| Sixth | 1980–85 | Direct attack on poverty | 5.2 | 5.7 | IRDP nationwide (1980), NREP (1980), RLEGP (1983) |
| Seventh | 1985–90 | Food, work and productivity | 5.0 | 6.0 | Jawahar Rozgar Yojana (1989); Growth Centre Scheme (1988) |
| Annual Plans | 1990–92 | Crisis; start of reforms | – | – | – |
| Eighth | 1992–97 | Indicative planning; human development | 5.6 | 6.8 | 73rd and 74th Amendments (1992); Employment Assurance Scheme (1993) |
| Ninth | 1997–2002 | Growth with social justice and equality | 6.5 | 5.4 | Seven Basic Minimum Services; SGSY (1999); PMGSY (2000) |
| Tenth | 2002–07 | Monitorable targets, State-wise targets | 8.0 | 7.6 | Rashtriya Sam Vikas Yojana (2003); Backward Regions Grant Fund (2006–07); NREGA (2006) |
| Eleventh | 2007–12 | Faster and more inclusive growth | 9.0 | 8.0 | Integrated Action Plan for Left Wing Extremism districts (2010); NRLM (2011) |
| Twelfth | 2012–17 | Faster, sustainable, more inclusive growth | 8.0 | about 7.1 | Regional equality across and within States; Aspirational Districts followed (2018) |
- Sources differ on the figures. An older official table gives achieved growth of 4.21 (Second), 2.72 (Third), 2.05 (Fourth), 4.83 (Fifth), 5.54 (Sixth), 6.02 (Seventh), 6.68 (Eighth), 5.5 (Ninth) and 7.7 (Tenth). Other accounts give the Third as 2.2 on a 5% target, and the Fourth as 3.4 or 3.5 on a 5.5% target. One old table has the First Plan’s target at 2.9 and the Sixth’s result at 6.0.
- Targets for the first three plans were set for national income, the Fourth for net domestic product, and later plans for GDP. The Twelfth Plan figure is the average of annual GDP growth on the 2011–12 series.
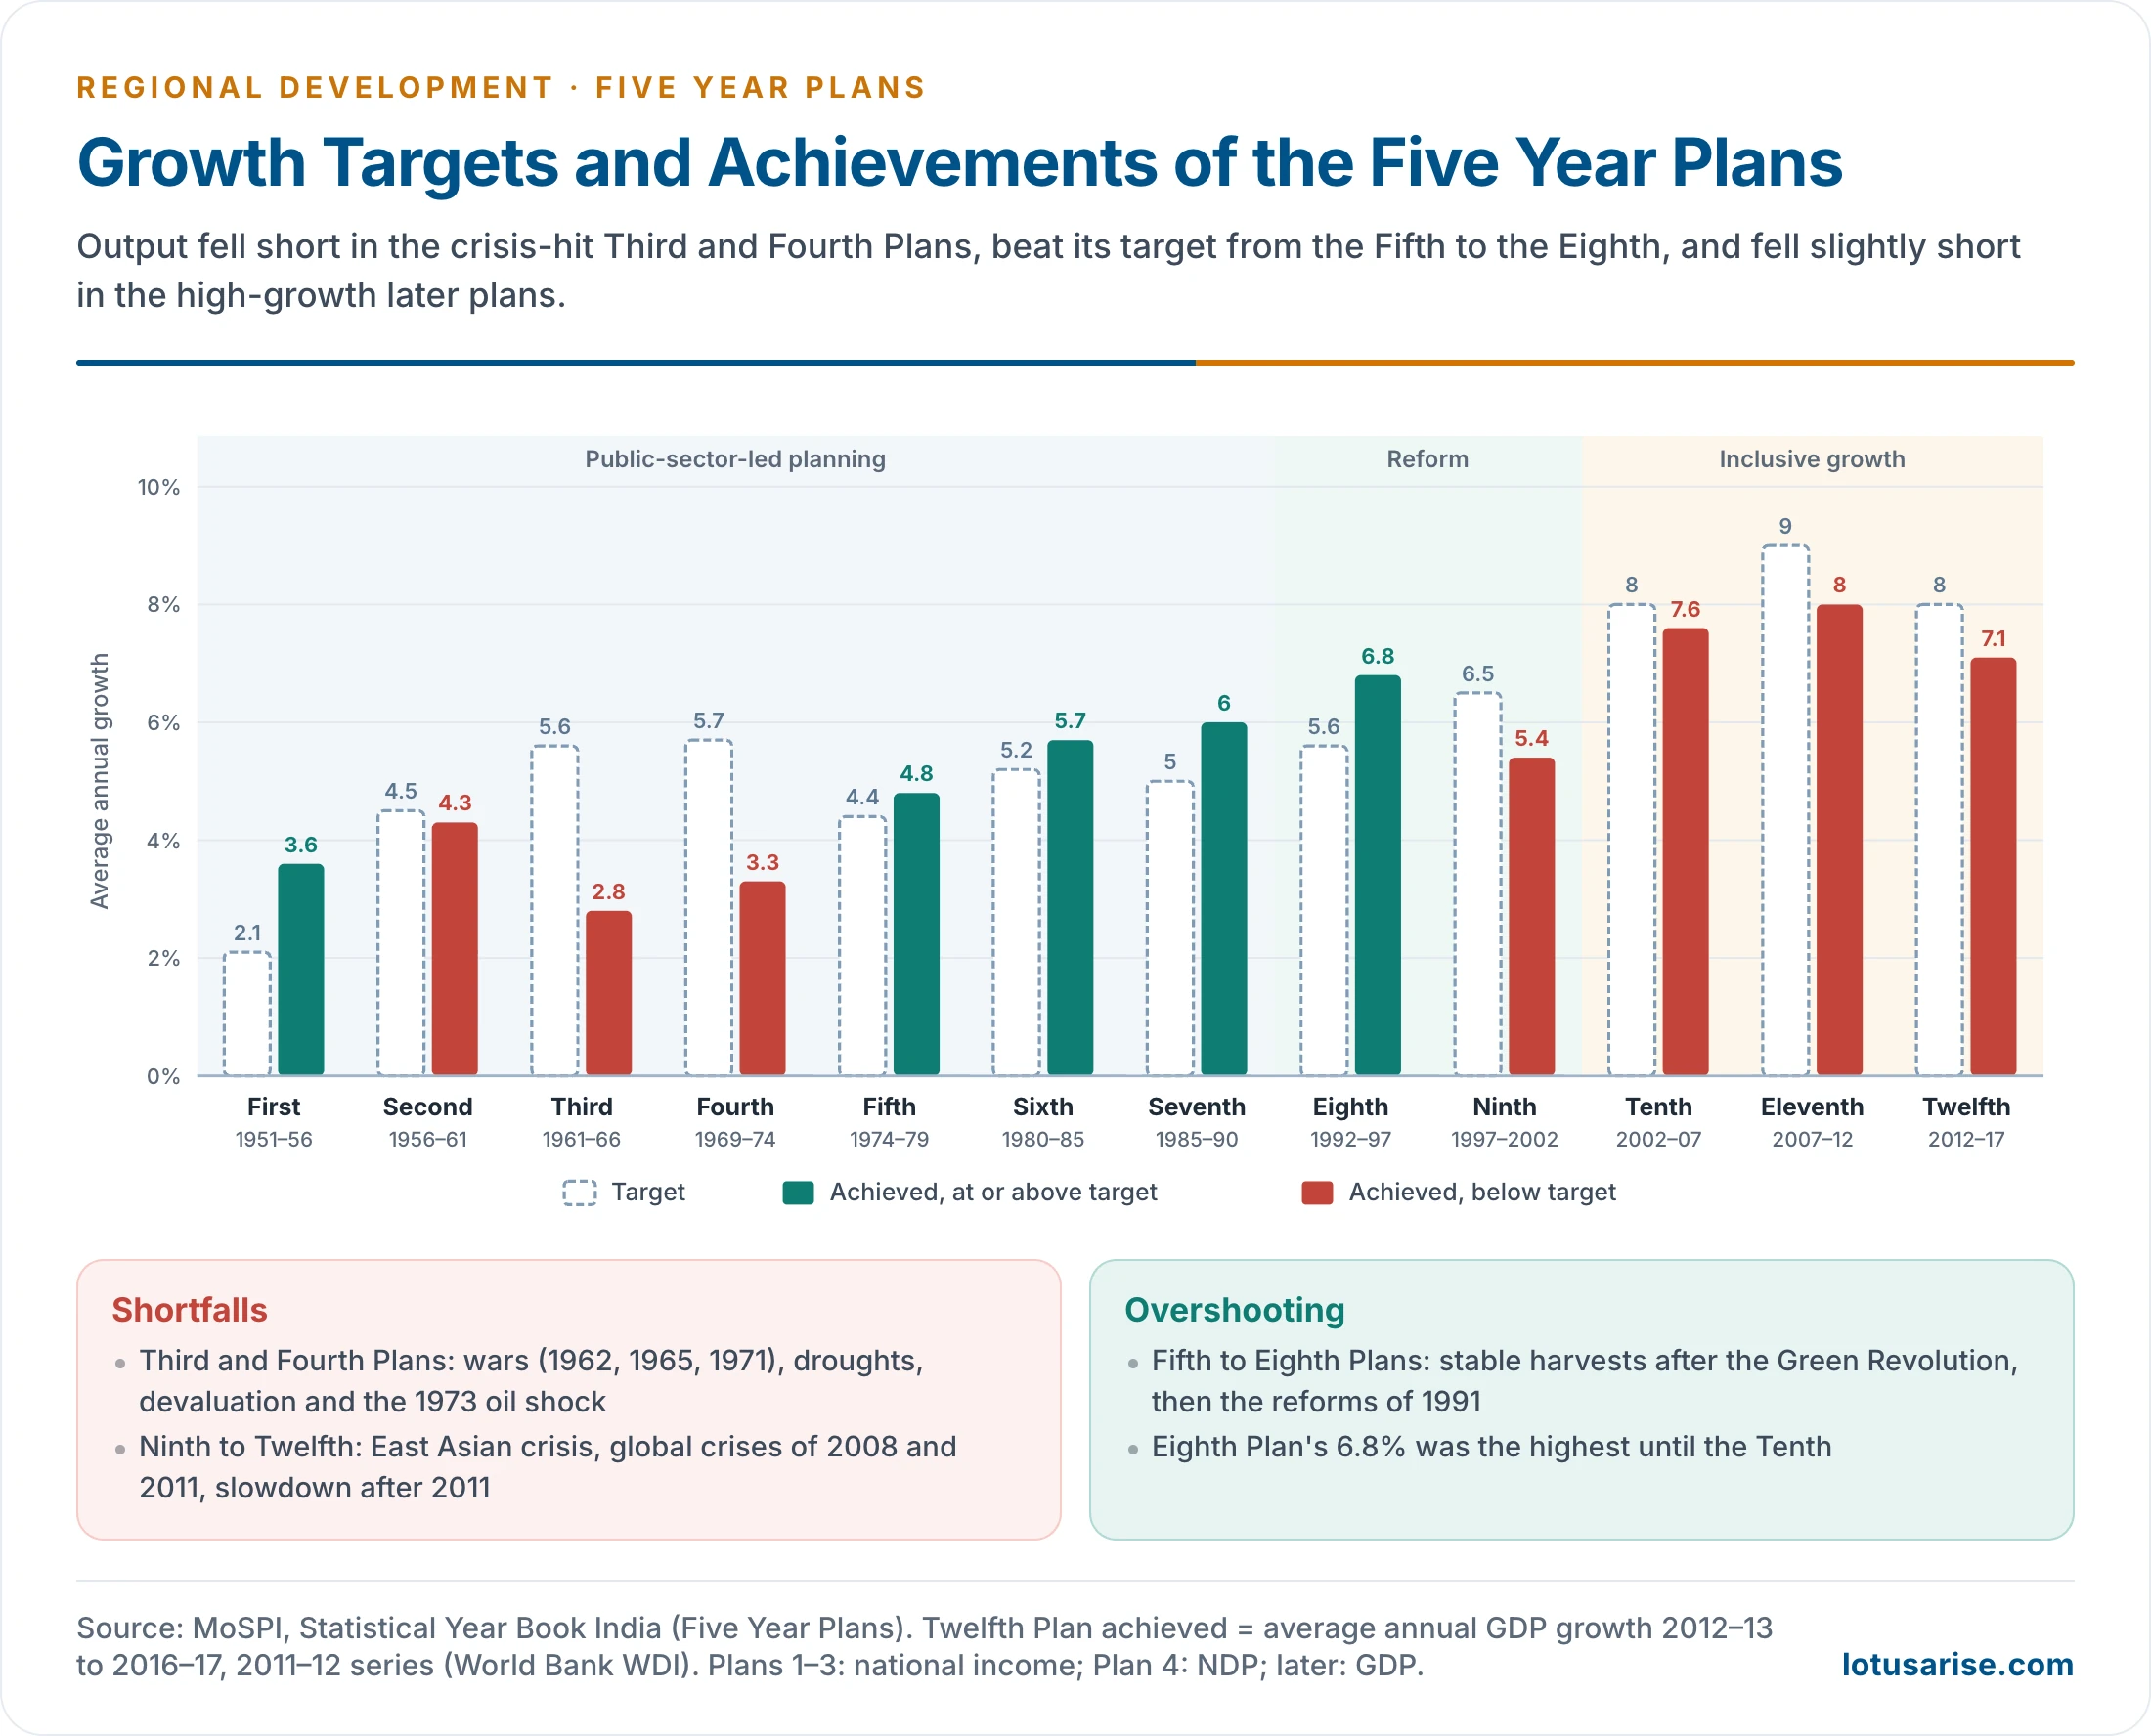
- The economy beat its target in five plans (the First and the Fifth to Eighth) and came close in the Second and Tenth. The big shortfalls came in the Third and Fourth Plans, years of war, drought and the oil shock.
The Plans One by One
First Five Year Plan (1951–56)
- Presented by Nehru, it was based on the Harrod–Domar growth model, which links growth to the rate of saving and the capital–output ratio. It gave top priority to agriculture, irrigation and power.
- Context: Partition and the influx of refugees, severe food shortage, large food imports, mounting inflation and the disequilibrium left by the Second World War.
- Its outlay of ₹2,069 crore, later raised to ₹2,378 crore, went to:
- irrigation and energy, 27.2%;
- transport and communications, 24%;
- agriculture and community development, 17.4%;
- social services, 16.6%;
- industry, 8.4%;
- land rehabilitation, 4.1%, and others, 2.5%.
- Irrigation, energy and agriculture together took 44.6%. The plan aimed to raise investment from about 5% to 7% of national income.
- Highlights:
- multipurpose river valley projects, among them Bhakra–Nangal, Hirakud and the Damodar Valley dams;
- the first IIT at Kharagpur (1951), with Bombay, Madras, Kanpur and Delhi following by 1961, and the University Grants Commission (1953);
- a public health drive, with WHO support, that cut mortality.
- Regional dimension:
- the river valley projects were the first regional plans, each organised around a basin;
- the Community Development Programme (2 October 1952) made the block the unit of rural development, followed by the National Extension Service (1953);
- all States were grouped into five broad divisions, counted as the first step towards regional planning, and problem areas such as the Damodar Valley were recognised;
- new towns were planned and old ones enlarged to resettle migrants from Pakistan;
- otherwise the plan was national and sectoral. No attempt was made to identify backward areas.
- Assessment:
- growth of 3.6% beat the 2.1% target, helped by two good harvests at the end;
- the plan was a patchwork of separate projects, prepared without reliable data;
- per capita income rose little, because population growth quickened as mortality fell.
Second Five Year Plan (1956–61)
- Confident after the First Plan, planners turned to industry, especially heavy industry, and aimed to raise national income by 25% over the plan.
- It was the Mahalanobis Plan. P. C. Mahalanobis, founder of the Indian Statistical Institute, built two-sector and four-sector models: investment in capital goods would raise long-run growth.
- The model laid the statistical base for state-directed investment, and for the licensing system that controlled private industry.
- The Industrial Policy Resolution of 1956 made a socialistic pattern of society the goal. The public sector took the lead; private industry was largely confined to consumer goods.
- Highlights:
- steel plants at Bhilai (Soviet aid), Rourkela (West German) and Durgapur (British);
- more coal output and new railway lines;
- hydroelectric projects;
- large imports financed by foreign loans, which ran down India’s sterling balances;
- atomic energy and science: the Atomic Energy Commission under Homi J. Bhabha (set up in 1948, not 1957 as often stated), the Tata Institute of Fundamental Research (founded 1945) as a research base, and a talent search and scholarship programme (1957) to train young people for nuclear work.
- Regional dimension:
- the steel plants were sited in backward mineral regions of Chhattisgarh (then Madhya Pradesh), Odisha and West Bengal, on the least-cost principle of raw materials;
- they were meant to act as growth poles for their regions;
- the 1956 Resolution declared that disparities between regions should be progressively reduced;
- an industrial estates programme from 1955 tried to take small industry to smaller towns.
- Assessment:
- growth reached 4.3% against 4.5%: national income rose about 20% against the 25% target, and per capita income about 8%;
- investment rose from about 7% to 11% of national income;
- a foreign exchange crisis (1957–58) forced targets to be pruned, and prices rose about 30%;
- small and cottage industries stayed sluggish;
- the steel towns grew, but spread effects to their tribal hinterlands were weak.
Third Five Year Plan (1961–66)
- It assumed the economy had reached the “take-off” stage and aimed at a self-reliant and self-generating economy. The first two plans had shown agriculture to be the limiting factor, so agriculture was given top priority, to support exports and industry.
- Targets: national income growth above 5% a year, self-sufficiency in foodgrains, a wider industrial base, fuller use of manpower and less inequality.
- Regional dimension:
- it was the first plan with a separate chapter on balanced regional development, covering differences both between and within States;
- it argued that the handicaps of backward areas for large projects were often a lack of basic facilities, which could be remedied, not something fixed;
- the Intensive Agricultural District Programme (1960–61) concentrated inputs in selected districts;
- Panchayati Raj institutions, introduced from 1959, were given development roles;
- a committee on the dispersal of industries (1960) made the first attempt to identify backward areas.
- Assessment: a failure.
- Growth was only 2.8% against a target of 5.6%.
- The China war (1962) and the war with Pakistan (1965) shifted the approach from development to defence.
- The deaths of Nehru (1964) and Shastri (1966) left a political vacuum, and 1965–66 was a near-famine year with no buffer stocks.
- Heavy borrowing and aid dependence ended in the devaluation of the rupee in June 1966, from ₹4.76 to ₹7.50 a dollar. That was a 36.5% fall in the rupee’s value, and a 57.5% rise in the dollar’s price, the figure often quoted. Foreign aid had been cut and pressure to devalue was strong. Inflation of about 36% wiped out much of the gain.
- Gains: dams continued, cement and fertiliser plants were built, and the first steps of the Green Revolution were taken, with Punjab producing wheat in abundance.
- Many primary schools opened in rural areas.
- State electricity boards, secondary education boards and road transport corporations were formed. States became responsible for secondary and higher education, and for local roads.
Annual Plans (1966–69): The Plan Holiday
- The Fourth Plan was postponed because of:
- the conflict with Pakistan (1965);
- two successive years of severe drought (1965–66 and 1966–67);
- the devaluation of the rupee;
- a general rise in prices;
- the erosion of resources for the plan.
- Three annual plans gave priority to food output and buffer stocks, and to absorbing the shocks of the Third Plan.
- A new agricultural strategy spread high-yielding seeds, fertilisers, irrigation and soil conservation.
- Regional dimension:
- the package needed assured irrigation, so the gains went first to Punjab, Haryana and western Uttar Pradesh;
- rainfed eastern and central India gained little: the start of the Green Revolution’s regional imbalance;
- in 1968 the Planning Commission set up the Pande and Wanchoo working groups, to identify backward areas and recommend incentives for industry there.
Fourth Five Year Plan (1969–74)
- The Indira Gandhi government launched it with the aims of “growth with stability” and the “progressive achievement of self-reliance”.
- It sought to reduce fluctuations in farm output and dependence on uncertain foreign aid, and to curb the concentration of wealth and economic power.
- Highlights:
- nationalisation of 14 major banks (July 1969), which drew savings into banks and spread branches to rural areas;
- the 1971 war, the creation of Bangladesh and millions of refugees to support;
- the oil crisis of 1973, which pushed up fuel and fertiliser prices;
- the Smiling Buddha nuclear test (May 1974), partly a response to the US Seventh Fleet’s deployment in the Bay of Bengal in 1971, followed by Western sanctions.
- Regional dimension: the turn to backward areas.
- The Gadgil formula (1969) for plan assistance and special category status for hill and frontier States.
- The NDC (1969) extended industrial concessions to backward districts in all States, about 247 in the end.
- Instruments followed: concessional finance (1970), the Central Investment Subsidy and the Transport Subsidy Scheme (1971).
- Target-group agencies: the Small Farmers’ Development Agency and the Marginal Farmers and Agricultural Labourers agency (1971).
- The Drought Prone Areas Programme (1973–74).
- Assessment: growth of 3.3% against an ambitious 5.7%. The first two years brought record harvests; the last three were spoilt by poor monsoons, war, refugees and inflation.
Fifth Five Year Plan (1974–79)
- Prepared under D. P. Dhar amid runaway inflation, it aimed at the removal of poverty (garibi hatao) and the attainment of self-reliance, through higher growth, better distribution of income and higher domestic savings.
- Highlights:
- the Minimum Needs Programme: elementary education, drinking water, rural health, roads, electrification, housing for the landless and nutrition;
- the Twenty Point Programme (1975);
- self-sufficiency in foodgrains from about this time;
- the national highway system was taken up;
- the electricity supply law was amended (1975–76) so that the Centre could enter power generation and transmission;
- to even out the Green Revolution, the government tried and failed to take over the wholesale trade in wheat.
- Regional dimension: area-specific planning.
- Backward areas were split into two classes: areas with physical handicaps of relief and climate, often home to distinctive cultures, and areas that were economically backward. Separate plans were made for each.
- The Command Area Development Programme (1974–75) tackled under-use of canal irrigation.
- The Hill Area Development Programme and the Western Ghats Development Programme (1974–75) served the hills.
- The Tribal Sub-Plan (1974–75) worked through Integrated Tribal Development Projects.
- Medium and minor irrigation, afforestation, soil conservation, dairying and drinking water went to drought-prone areas.
- Planning was politicised under the Emergency (1975–77). After 1977 the Janata government reconstituted the Commission and ended the plan after 1977–78.
- Assessment: growth of 4.8% beat the 4.4% target, though inflation upset the cost estimates. The first draft aimed at 5.5%, and some accounts give the result as 5.0%.
The Rolling Plan (1978–80)
- The Janata government’s Sixth Plan (1978–83) stressed employment, agriculture, small and cottage industries and the incomes of the poor. It was a reply to the Nehru model, which it blamed for concentrating power, widening inequality and leaving poverty untouched.
- Its stated objective was “Growth for Social Justice”.
- Rolling plans are said to have failed in Mexico and Myanmar, and to have worked in Japan and Poland.
- Meaning: the plan is reviewed and renewed every year on the basis of performance. A rolling system has three parts:
- an annual plan for the current year, tied to the budget;
- a plan for three to five years, revised each year as the economy and politics require;
- a perspective plan for 10, 15 or 20 years.
- There are no fixed dates for the start and end of the plan.
- Advantages:
- flexibility: targets, projections and allocations change with conditions;
- continuous review: in a fixed plan, annual reviews only report progress, while here each yearly review becomes the basis of a new plan.
- Drawbacks:
- frequent revision makes targets hard to reach;
- it is difficult to keep the balances a growing economy needs;
- with no fixed start or end, it loses the mobilising force of a five-year commitment.
- Regional dimension:
- the Desert Development Programme (1977–78) for hot and cold deserts;
- Food for Work (1977);
- the first phase of the Integrated Rural Development Programme (1978–79) in selected blocks;
- a working group under M. L. Dantwala (1978) on block-level planning.
- Fate: Morarji Desai resigned, and Charan Singh’s government lasted only about 170 days, unable to keep a majority. After the January 1980 elections, Indira Gandhi’s government launched its own Sixth Plan from 1 April 1980.
Sixth Five Year Plan (1980–85)
- Its aim was a direct attack on poverty by creating the conditions of an expanding economy. Investment in social services (education, health, family planning, housing and urban development) rose sharply, and the role of the Planning Commission grew from this plan.
- Against a public outlay of ₹97,500 crore, spending reached ₹1,09,291.7 crore.
- Rural poverty programmes:
- Training of Rural Youth for Self-Employment (TRYSEM), from August 1979;
- the Integrated Rural Development Programme (IRDP), nationwide from 2 October 1980, through District Rural Development Agencies;
- the National Rural Employment Programme (NREP), from October 1980 and a regular plan programme from April 1981;
- Development of Women and Children in Rural Areas (DWCRA), from 1982;
- the Rural Landless Employment Guarantee Programme (RLEGP), from 1983.
- Regional dimension:
- the poverty programmes were allocated to districts and blocks, so the block became the working unit of rural planning;
- the National Committee on the Development of Backward Areas (B. Sivaraman, 1981) proposed fresh criteria for backward areas;
- a working group under C. H. Hanumantha Rao (1984) recommended district planning.
- Assessment: a success. Growth of 5.7% (5.4% or 5.5% in other accounts) beat the 5.2% target, and the Planning Commission’s estimate of poverty fell from 47% at the start, against a 30% target, to about 37% by 1983–84. Famine conditions in many areas marred the last year.
- Poverty later fell to about 21.9% on the Tendulkar line (2011–12), and multidimensional poverty to 14.96% (2019–21).
Seventh Five Year Plan (1985–90)
- Framed within a perspective for 1985–2000, it emphasised “food, work and productivity” under growth, modernisation, self-reliance and social justice. Manmohan Singh was Deputy Chairman of the Commission at its start.
- Announced on 9 November 1985, its public sector outlay of ₹1,80,000 crore doubled that of the previous plan; actual spending reached ₹2,18,700 crore, 21.5% more.
- Foodgrain output grew 3.23% a year, against a long-term 2.68% (1967–68 to 1988–89).
- NREP and RLEGP were merged into the Jawahar Rozgar Yojana (April 1989), and spending on rural development doubled.
- Regional dimension:
- the Growth Centre Scheme (1988) for industrialising backward districts;
- the Million Wells Scheme (1988–89) for small farmers’ irrigation;
- the Indira Awaas Yojana (1985–86) for rural housing;
- the National Commission on Urbanisation (1988), on spreading urban growth to smaller centres.
- Assessment: growth of 6.0% beat the 5% target despite drought in its first three years. The economy broke out of the “Hindu rate of growth”, but the deficits of the 1980s built up towards the 1991 crisis.
Annual Plans (1990–92) and the 1991 Crisis
- Fiscal deficits and heavy external borrowing in the 1980s ended in crisis.
- By mid-1991, foreign exchange reserves covered only about two weeks of imports, and India came close to default.
- In January 1991 reserves stood at about US$1 billion, some three weeks of imports.
- The caretaker government of Chandra Shekhar pledged 67 tonnes of gold to raise emergency loans, and the IMF provided about US$2.2 billion.
- The P. V. Narasimha Rao government, with Manmohan Singh as Finance Minister, launched liberalisation, privatisation and globalisation from July 1991.
- After the assassination of Rajiv Gandhi, Congress returned to power.
- Two annual plans, of ₹58,369.30 crore and ₹64,751.20 crore, covered 1990–91 and 1991–92, within the approach already prepared for an Eighth Plan of 1990–95.
Eighth Five Year Plan (1992–97)
- The NDC agreed that the Eighth Plan would begin on 1 April 1992. It managed the transition from a centrally planned to a market-led economy through indicative planning.
- Objectives:
- employment generation;
- population control;
- primary health, drinking water and vaccination for all villages;
- growth and diversification of agriculture;
- stronger infrastructure;
- overall human development;
- modernisation of industry, with industrial growth targeted at about 7.5% a year;
- universal primary education, and literacy for ages 15–35;
- relief of poverty and unemployment, the plan’s twin aims.
- The reform period:
- the rupee was devalued by about 18–19% in July 1991;
- the New Industrial Policy (July 1991) delicensed most industries, cut tariffs and welcomed FDI;
- the exchange rate became market-determined;
- India became a founding member of the WTO (1995).
- Regional dimension:
- the 73rd and 74th Amendments (1992) made Panchayats and municipalities constitutional bodies, with District Planning Committees to consolidate local plans;
- the Employment Assurance Scheme (1993) started in drought-prone, desert, tribal and hill blocks;
- after delicensing, private investment flowed to the States with the best infrastructure, so market forces began to widen the gaps between States.
- Assessment: growth of 6.8% against a target of 5.6%, the highest so far. It ran at about 7.7% in the first two years, and slowed towards the end, as the Asian financial crisis (1997) approached.
Ninth Five Year Plan (1997–2002)
- Launched in the fiftieth year of Independence, it aimed at “growth with social justice and equality”, with priority to agriculture and rural development to create employment and remove poverty.
- Four dimensions:
- quality of life;
- productive employment;
- regional balance;
- self-reliance.
- It set out Seven Basic Minimum Services:
- safe drinking water;
- primary health care;
- universal primary education;
- housing for the shelterless;
- nutritional support for children;
- connectivity of all villages;
- a streamlined public distribution system.
- The state was to be a facilitator, leaving most investment to the private sector, Indian and foreign. It would concentrate on the social sectors and infrastructure.
- Regional dimension:
- the Swarnjayanti Gram Swarozgar Yojana (1999) replaced IRDP and its allied programmes;
- the Pradhan Mantri Gram Sadak Yojana (2000) set out to connect unconnected habitations by all-weather roads;
- special action plans went to the Kalahandi–Bolangir–Koraput region of Odisha.
- It also sought to regulate debt and cut the revenue deficit. The first target of 7% was later cut to 6.5%.
- Assessment: growth of 5.4% against 6.5%, held back by the East Asian crisis and slow agriculture.
- Agriculture grew 2.1%, and manufacturing about 4.5%, against 4.69% and 7.57% in earlier plans.
- Industry reached 4.5% against a 3% target in one count, and services 7.8%.
Tenth Five Year Plan (2002–07)
- Approved by the NDC on 21 December 2002, it aimed at 8% growth and the doubling of per capita income in ten years.
- It set monitorable targets beyond growth:
- poverty down from 26% to 21% by 2007;
- literacy up to 75%;
- infant mortality down from 72 to 45 per 1,000;
- forest and tree cover up to 25% by 2007;
- gender gaps in literacy and wages halved;
- drinking water for all villages and clean major rivers;
- decadal population growth down from 21.3% to 16.2%;
- all children in school by 2003, and through five years of schooling by 2007;
- maternal mortality down from 4 to 2 per 1,000;
- gainful jobs at least keeping pace with the labour force.
- New programmes:
- Bharat Nirman (2005) for rural infrastructure;
- the National Rural Health Mission (2005);
- JNNURM (2005) for cities;
- the National Rural Employment Guarantee Act (2005), in force from February 2006.
- Regional dimension:
- for the first time, growth and social targets were broken down State-wise, to make balanced development measurable;
- the Rashtriya Sam Vikas Yojana (2003–04) gave additional funds to backward districts;
- the Backward Regions Grant Fund (2006–07) gave untied funds to about 250 backward districts, planned from below;
- NREGA began in the 200 most backward districts.
- Assessment: growth averaged about 7.6% (7.7% to 7.8% in other accounts), close to target and the highest of any plan until then.
- National income grew about 7.6% and per capita income about 6% a year; industry grew 8.6%.
- The NSSO’s 61st round put poverty at 22% in 2004–05, down from 26.1%.
Eleventh Five Year Plan (2007–12)
- Its theme was “Towards Faster and More Inclusive Growth”. India entered it as one of the fastest-growing economies in the world.
- It set 27 national targets, 13 of them broken down by State, on poverty, education, health, women and children, infrastructure and the environment.
- Priorities:
- revival of agriculture;
- health and education in rural areas;
- skill development;
- employment through the NREGA;
- environmental sustainability;
- gender equality;
- clean drinking water for all by 2009;
- growth rising to 10% by the end of the plan;
- education spending more than double the Tenth Plan’s.
- Regional dimension:
- the Backward Regions Grant Fund grew to 272 districts;
- the Integrated Action Plan (2010) for districts affected by Left Wing Extremism;
- the National Rural Livelihoods Mission (2011), which built self-help groups across poorer States;
- the National Food Security Mission (2007), targeted at districts with low yields, to add 20 million tonnes of cereals and pulses in five years.
- Assessment: growth averaged 8%, below the 9% target but above the Tenth Plan, despite the global crises of 2008 and 2011.
- Growth was 9.3% in 2007–08, fell to 6.7% in 2008–09, recovered to 8.6% and 9.3%, and slowed to 6.2% in 2011–12.
- Agriculture grew 3.7% (target 4%), industry 7.2% (target 10–11%) and services 9.7% (target 9–11%).
Twelfth Five Year Plan (2012–17)
- India’s last Five Year Plan, with the theme “Faster, More Inclusive and Sustainable Growth”.
- The approach paper aimed at 9% growth. The NDC, on 27 December 2012, approved 8%, against a slowing economy.
- It set out three scenarios:
- “strong inclusive growth” at about 8%;
- “insufficient action” at 6–6.5%;
- “policy logjam” at 5–5.5%.
- Objectives:
- 50 million new work opportunities in the non-farm sector;
- removal of gender and social gaps in school enrolment;
- wider access to higher education;
- less malnutrition among children aged 0–3;
- electricity for all villages;
- piped drinking water for 50% of the rural population;
- green cover up by 1 million hectares a year;
- banking access for 90% of households;
- poverty down by 10 percentage points;
- power capacity up by about 88,000 MW;
- farm output growth of 4% and manufacturing growth of 10%.
- It hoped to draw about US$1 trillion of infrastructure investment, half from private sources, and to bring subsidies down from 2% to 1.5% of GDP, with Aadhaar as the platform for direct cash transfer of subsidies.
- Regional dimension: it aimed explicitly at regional equality across and within States, and at better living conditions for Scheduled Castes, Scheduled Tribes, Other Backward Classes and minorities.
- After 2015, central funding of the Backward Regions Grant Fund ended as the Fourteenth Finance Commission raised devolution to the States.
- Assessment: growth averaged about 7.1% on the 2011–12 series. The plan ran its course under NITI Aayog after the Planning Commission was replaced in 2015.
After the Five Year Plans
NITI Aayog’s Framework
- The view had grown that, in a country as large and diverse as India, centralised planning could not work beyond a point because of its one-size-fits-all approach. The Planning Commission was replaced by NITI Aayog in 2015, and no Thirteenth Plan was made, though a five-year defence plan continued.
- NITI proposed a 15-year vision, a 7-year strategy and a 3-year action agenda in place of the five-year plan.
- Three Year Action Agenda (2017–18 to 2019–20): released in August 2017, it set out a fiscal framework and sector strategies for agriculture, industry, services and infrastructure.
- A separate part on regional strategies covered urban and rural transformation, the North-East, coastal areas and islands, the Himalayan States, and desert and drought-prone regions.
- It gave a roadmap without schemes or allocations, since NITI has no financial powers.
- Strategy for New India @75 (2018): goals for 2022–23 grouped under drivers of growth, infrastructure, inclusion and governance.
- Viksit Bharat@2047: the long-term goal of a developed India by the centenary of Independence. NITI asks each State to prepare a matching State vision.
- NITI documents need no Cabinet approval and bind no one: they are policy guides, not plans with money attached.
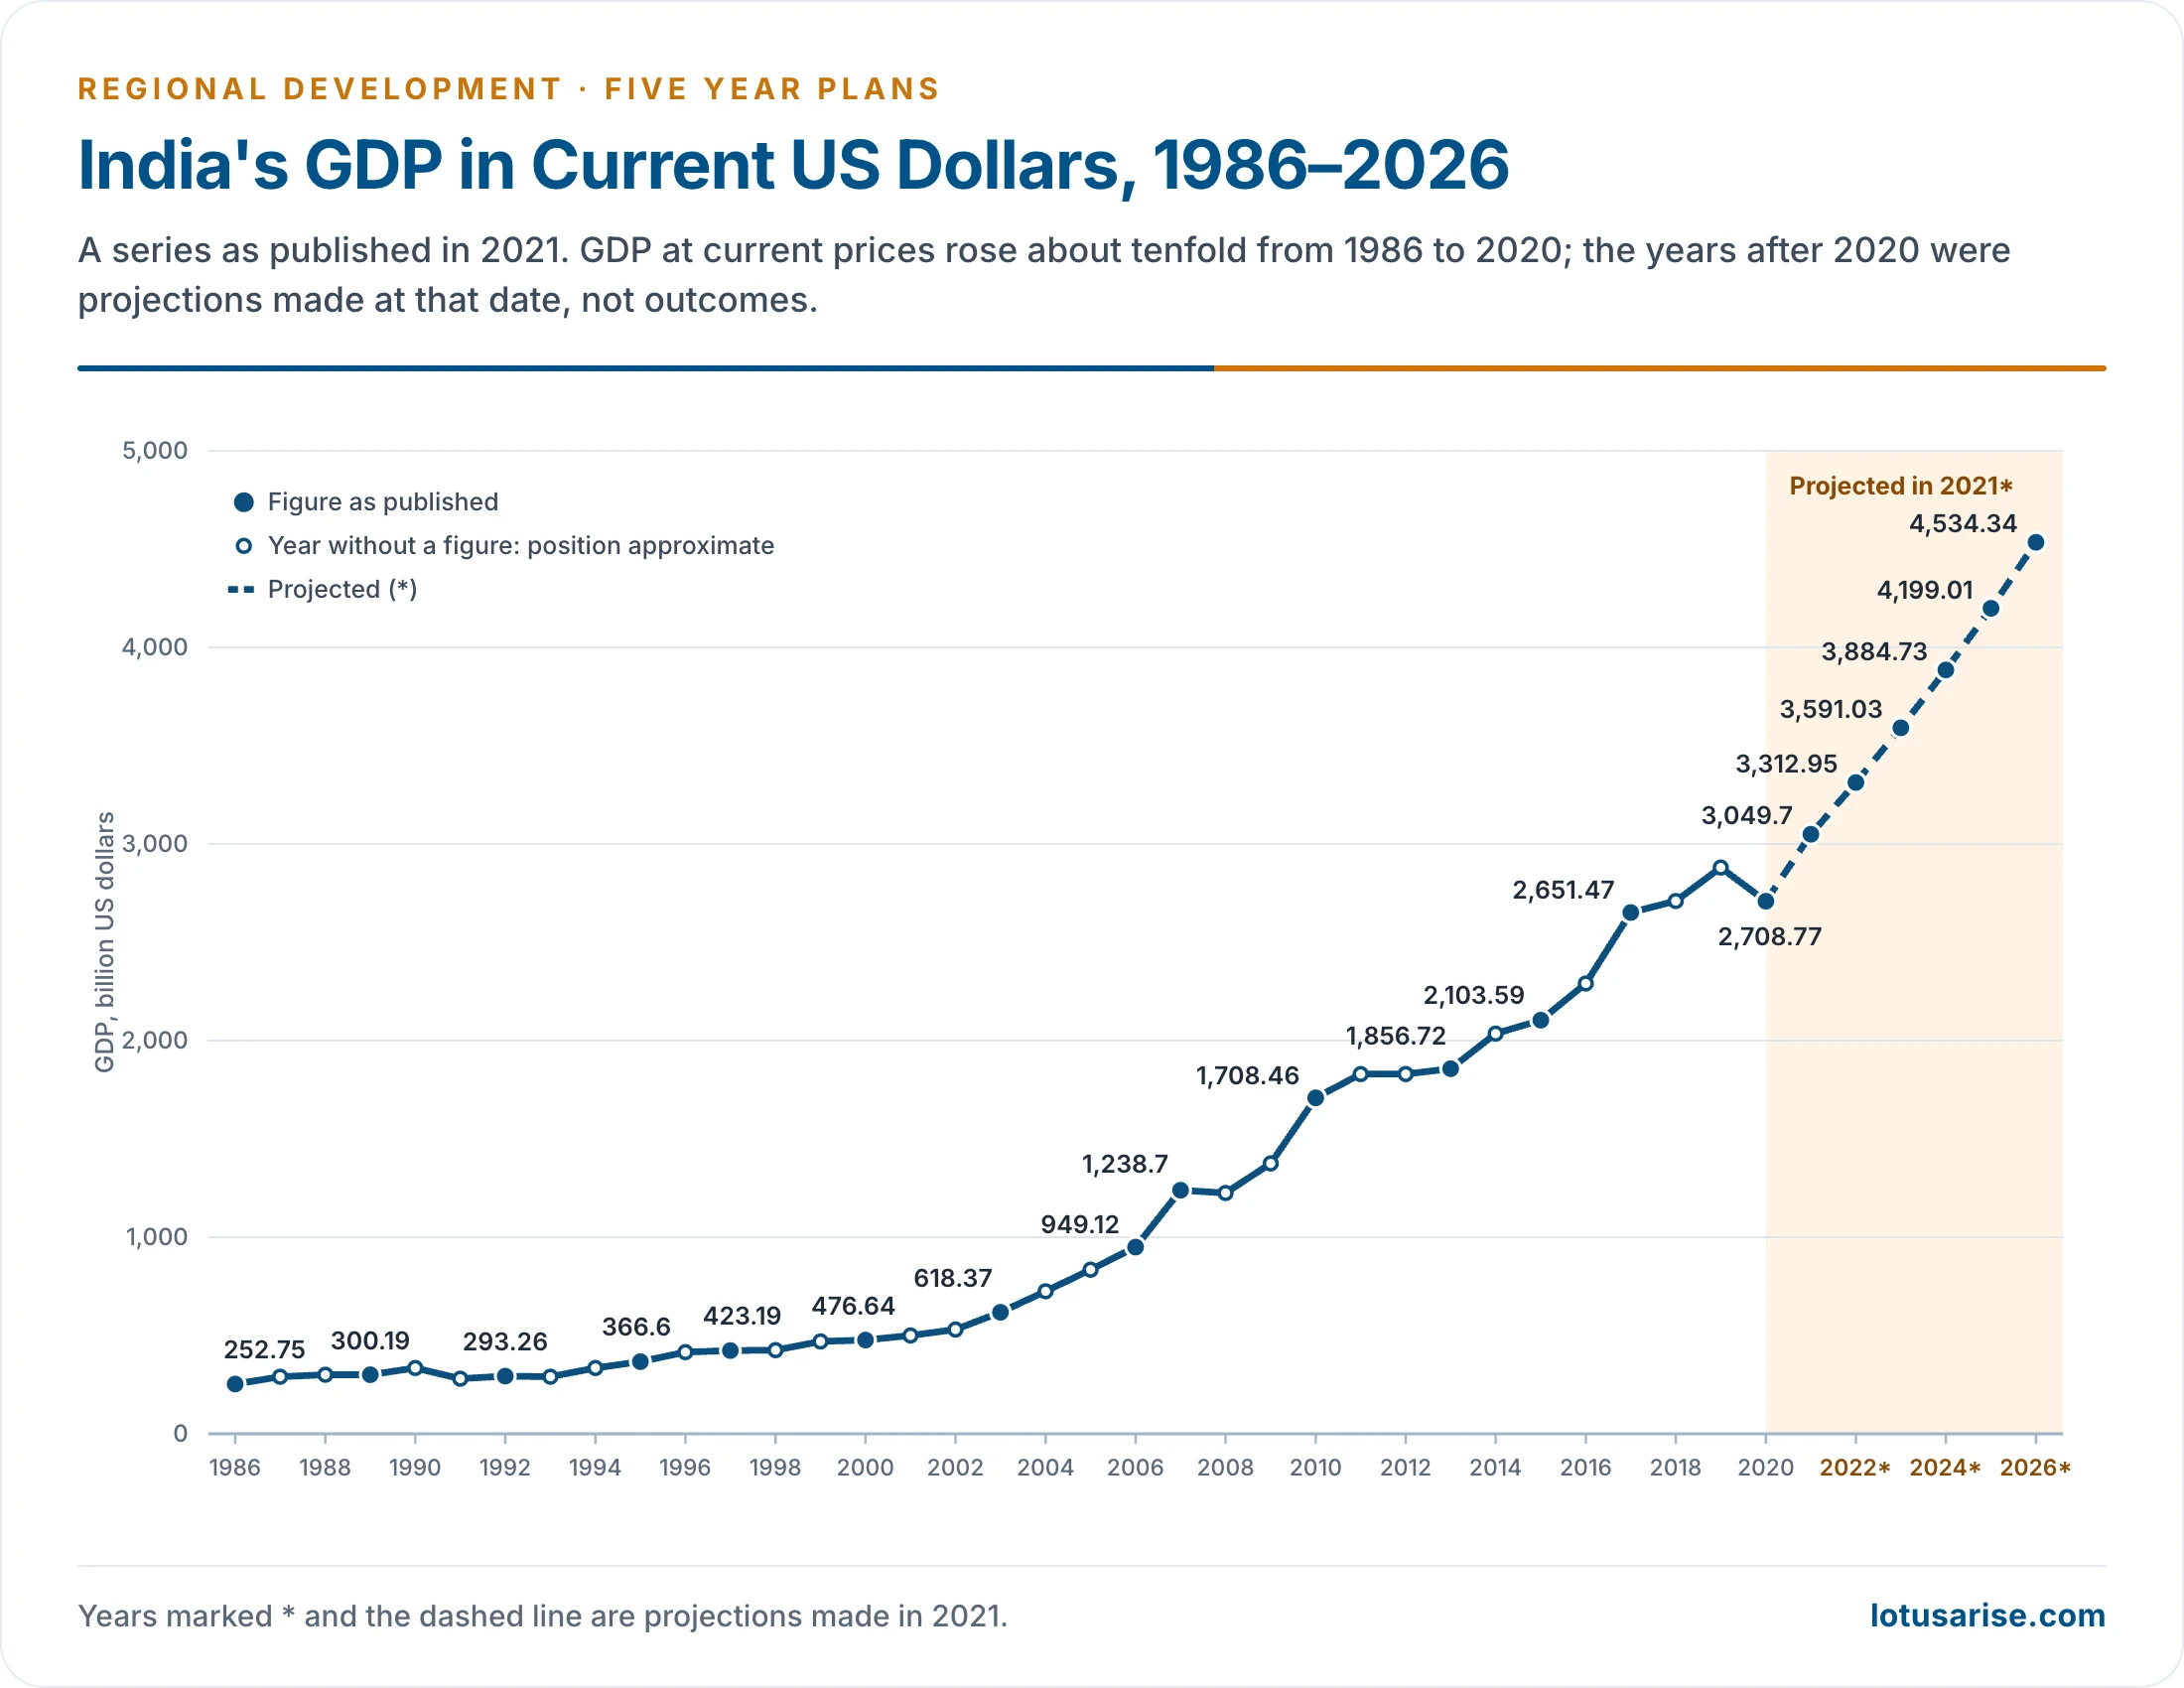
- GDP at current prices rose from about US$253 billion (1986) to about US$2.7 trillion (2020), and about US$4 trillion by 2025.
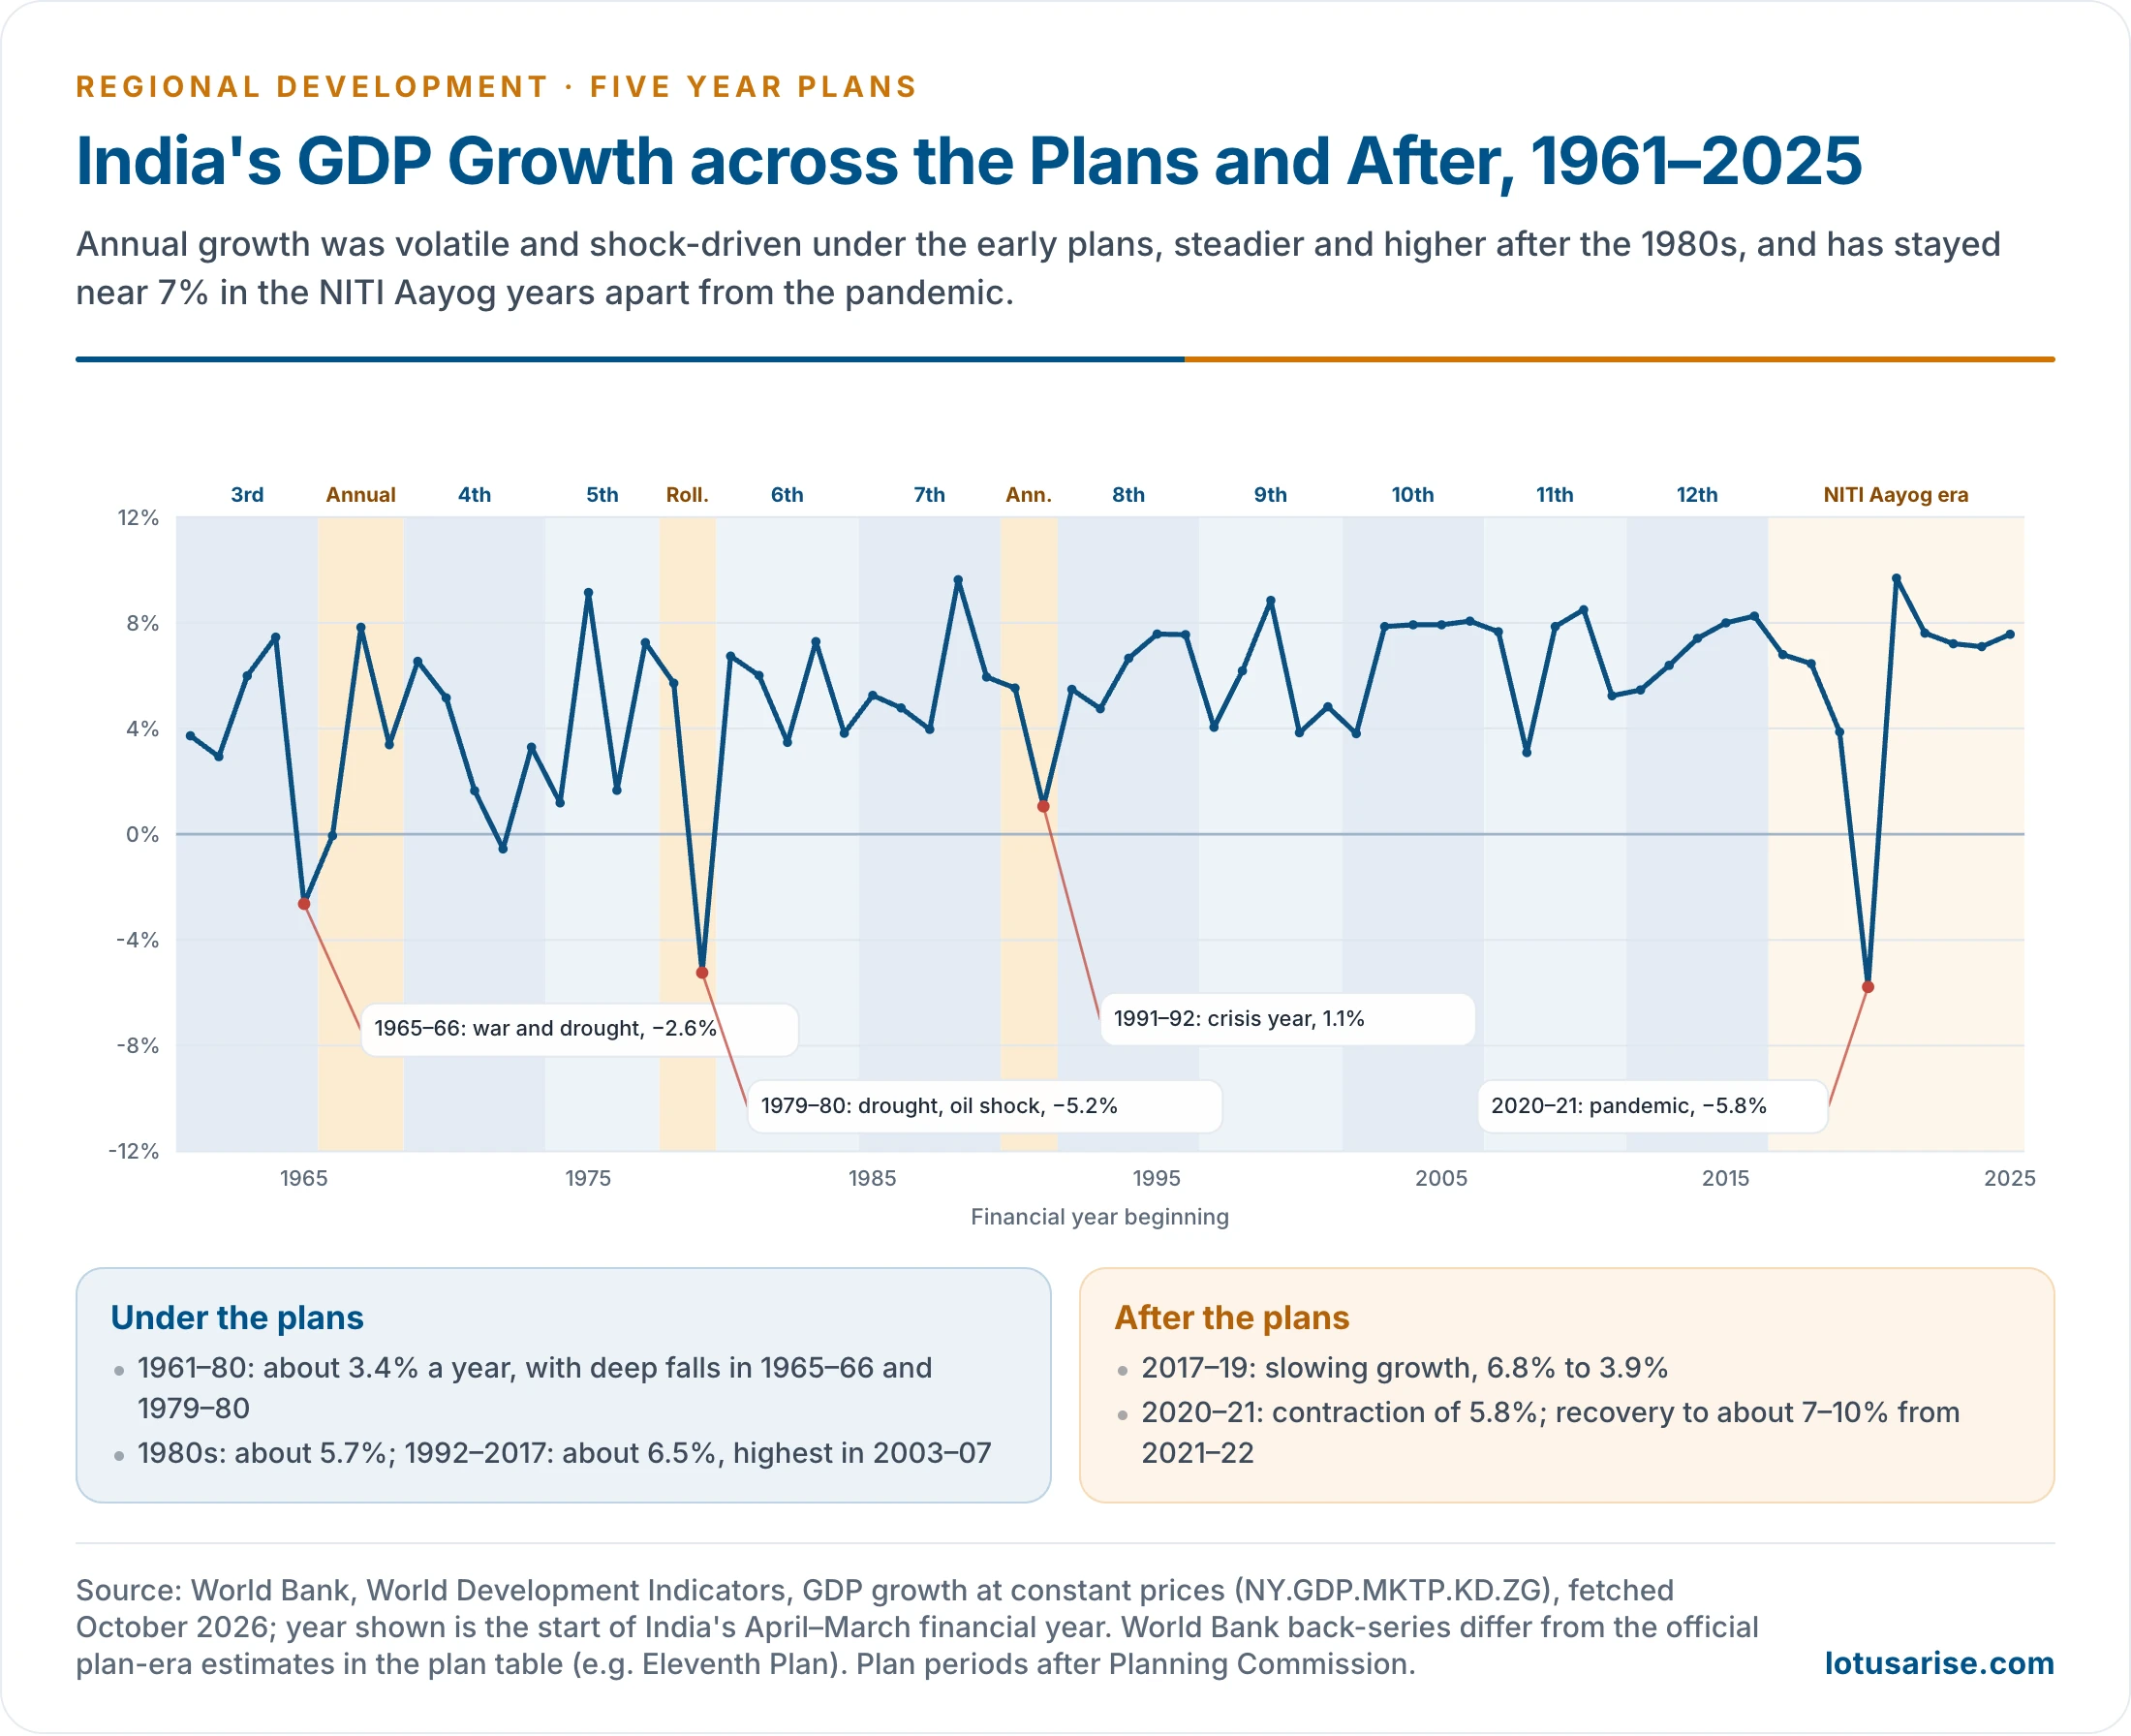
- Growth after the plans:
- about 6.5–7% a year before the pandemic;
- a contraction of 5.8% in 2020–21;
- a recovery to about 7–10% a year after it.
Agriculture across the Plans
- First Plan: top priority to agriculture, irrigation and community development, to end food imports.
- Second Plan: agriculture took second place to heavy industry, on the assumption that food was secure. The food crisis of the mid-1960s exposed the error.
- Third Plan and the annual plans: agriculture returned to the top. The Intensive Agricultural District Programme (1960–61) and the High Yielding Varieties Programme (1966) began the Green Revolution.
- Fourth and Fifth Plans: the focus turned to those left out: small and marginal farmers (SFDA, MFAL), drought-prone areas (DPAP) and canal commands (CADP).
- Sixth to Eighth Plans: rural employment and asset programmes, and the spread of the new technology to rice in the east.
- Ninth to Twelfth Plans: agriculture as the “prime mover” of the Tenth Plan; the Rashtriya Krishi Vikas Yojana and the National Food Security Mission (2007); a 4% growth target in the Eleventh and Twelfth Plans.
- Outcome: foodgrain output rose from about 51 million tonnes (1950–51) to about 257 million tonnes (2012–13), ending dependence on food aid.
- Shortfalls:
- gains were concentrated in irrigated north-west India;
- land reform stalled;
- rainfed and eastern regions lagged;
- groundwater depletion and soil damage followed in the Green Revolution core.
What the Plans Achieved and Where They Fell Short
- Achievements:
- self-sufficiency in food after the Green Revolution, and food security through buffer stocks and the public distribution system;
- an industrial and infrastructure base: steel, power, irrigation, railways, ports and telecommunications;
- a science and technology base, from atomic energy and space to agricultural research;
- rising literacy, from 18.3% (1951) to 74.0% (2011), and life expectancy, from about 32 years to about 68 (2011–15), or from 37 to 66 on an older reckoning;
- diversified exports, from jute, tea and cotton textiles to engineering goods, chemicals and services;
- from the Sixth Plan, a direct attack on rural poverty through employment and asset programmes.
- Reading the growth record:
- shortfalls came when shocks hit: wars (1962, 1965, 1971), droughts (1965–67, 1972, 1979, 1987) and oil prices (1973, 1979);
- overshooting came in the Fifth to Eighth Plans, as agriculture stabilised and, later, reform freed industry;
- from the Tenth Plan, growth depended more on private investment and world markets than on plan outlays.
- Shortfalls:
- growth below target in seven of the twelve plans;
- persistent poverty and unemployment;
- inflation in the 1960s and 1970s;
- a weak record on land reform.
- Regional record: each plan added a regional measure, but plans stayed sectoral. The experience of regional planning under them shows the gap between advanced and lagging States widening, not closing.
Previous Year Questions
2004Examine the regional development policy of India in various five-year plans.1991Discuss the changes brought about in Indian agriculture by the successive Five-Year Plans, mentioning their successes and failures.1989Analyse the prevailing patterns of regional disparities in the socio- economic development of India and evaluate the role of the five-year plans in reducing them.





sir can you please update about 12 th 5 year plan