

- Liberalisation, privatisation and globalisation (LPG) are the three linked strands of the economic reforms of 1991, which moved India from a licence-bound, public-sector-led economy towards a market-led one open to the world.
- The turning point was the New Industrial Policy of 24 July 1991, presented by Finance Minister Manmohan Singh in the P. V. Narasimha Rao government, weeks after a balance of payments emergency.
- Their geography is uneven. Investment, exports and jobs gathered in a few already advanced States and metropolitan regions, so the reforms feed directly into India’s regional disparities.
Liberalisation
- Liberalisation means freeing the economy from direct or physical controls imposed by the government, so that market forces guide investment and output.
- For industry, it means removing the bureaucratic hurdles that decided who could produce what, how much and where, and preparing firms to meet market competition.
The Economy Before 1991
- India began its First Five Year Plan on 1 April 1951 and followed the socialistic pattern of society.
- From the First to the Sixth Plan, the public sector held the primary role in growth and development.
- Examples: BHEL in the 1960s and NTPC in the 1970s.
- The private sector played a secondary role, within tight rules.
- Industry and trade faced production quotas and permits for export and import.
- The aim was to protect domestic industry from international competition and to curb private monopolies.
- Results, as the reformers read them: licences, permits and quotas gave some good results at first, but the end result disappointed.
- Public enterprises came to be criticised for corruption and inefficiency.
- Private firms, in the absence of competition, did little to diversify or modernise.
- Policy line behind 1991: the Industrial Policy Resolutions of 1948 and 1956 set up a mixed economy, with 17 industries reserved for the state in Schedule A of 1956. The statements of 1977 and 1980 shifted attention to small industry and to public sector management, all stages in the evolution of industries.
- First loosening: the Sixth Plan (1980–85) already felt that firms had to become efficient, modern and able to compete abroad, and it began some liberalisation. High-cost, low-quality production had become the pattern of the first three decades of planning.
The Crisis of 1990–91
- The cumulative effect was stagnation, and by June 1991 India faced an unprecedented economic crisis.
- Reserves were barely enough to pay for two weeks’ imports, with estimates of cover falling to about 10 days.
- New loans were not available on normal terms.
- In July 1991, the Reserve Bank of India (RBI) pledged 46.91 tonnes of gold with the Bank of England and the Bank of Japan to raise about US$ 400 million.
| Indicator | Earlier | 1990–91 | Official later count |
|---|---|---|---|
| Fiscal deficit (% of GDP) | 5.4 (1981–82) | 8.4 | Later series: about 7.8 |
| Current account deficit (₹ crore) | 2,214 (1980–81) | 17,367 | About 3% of GDP |
| Foreign loans (% of GDP) | 12 (1980–81) | 23 | External debt 28.7% at end-March 1991 |
| Debt service | 15% of exports (1980–81) | 30% of exports | 35.3% of current receipts |
| Forex reserves (₹ crore) | 8,151 (1986–87); 6,252 (1989–90) | 11,416, end-March 1991 | Only ₹4,388 crore of it was foreign currency |
- Fiscal deficit: government spending had run far ahead of revenue through the 1980s.
- Balance of payments: the heavier burden of foreign debt service drained reserves and caused a crisis of confidence in the international foreign exchange market.
- External debt stood at US$ 83.8 billion at end-March 1991.
- Short-term debt alone was 3.8 times the foreign currency assets.
- Gulf crisis: the Iraq war of 1990–91 pushed up petrol prices and hit the remittances India received from Gulf countries, deepening the crisis.
- Foreign exchange reserves: counting gold and special drawing rights, reserves were US$ 5.83 billion at end-March 1991, but foreign currency assets were only US$ 2.24 billion. They fell further in the following months.
- Policy response: the government turned to liberalisation with loans and advice from the World Bank and the International Monetary Fund.
Why India Waited Till 1991
- After Independence, India put barriers on foreign trade and investment to protect its producers from foreign competition. Imports, it was felt, would have stopped new industries from coming up.
- Strict restrictions applied, except on essentials such as petroleum products, capital goods and fertilisers.
- Developed countries had offered similar protection during their own early stages of development.
- The 1980s up to 1991:
- The mixed economy framework came to be seen as having produced a mass of rules and laws, the permit-licence raj.
- By 1990–91, the government could hardly repay its borrowings from abroad, and at one stage lacked the foreign exchange to pay interest to international lenders.
- Revenue fell short of spending through the 1980s. Development programmes did not generate additional revenue.
- Taxation could not raise enough income from internal sources, while a large share of spending went to the social sector and defence.
- Public enterprises grew from just 5 in 1951 to 246 in March 1991, with several thousand crores of rupees invested. Their first 15 years were encouraging, but most later showed losses and became a liability.
- Money borrowed from foreign governments and multilateral institutions went to meet government consumption.
- India approached international institutions such as the International Bank for Reconstruction and Development (IBRD) and the International Monetary Fund (IMF).
- In return for loans, they wanted India to open up the economy, remove restrictions on the private sector and reduce the government’s role in many areas.
- This led to the New Economic Reforms of 1991.
Globalisation and Liberalisation
- Removing barriers to trade is liberalisation, and the removal of those barriers results in globalisation.
- Globalisation is primarily economic. It is the growing integration of national economies through international trade, investment and capital flows.
- Liberalisation was introduced to end trade restrictions and open up various sectors of the economy.
- Some measures came in 1990, in industrial licensing, export-import policy, technology upgradation, fiscal policy and foreign investment, but they were not sufficient.
- The New Economic Policy of 1991 began comprehensive reform.
The New Industrial Policy, 1991
- Aims:
- Release industry from needless bureaucratic control.
- Integrate India with the world economy.
- Remove limits on direct foreign investment, and free domestic entrepreneurs from the Monopolies and Restrictive Trade Practices (MRTP) Act.
- Shed the load of loss-making or low-return public enterprises.
| Head | What changed in 1991 |
|---|---|
| Industrial licensing | Abolished except for a short list of security, strategic, social, hazardous, environmental and elite-consumption items |
| Location | No central approval outside cities of over one million people. Within them, polluting units had to sit 25 km beyond the periphery, except in designated industrial areas |
| Foreign investment | Automatic approval up to 51% foreign equity in high-priority industries |
| Foreign technology | Automatic approval of technology agreements in priority industries; no permission needed to hire foreign technicians |
| Public sector | Priority narrowed to essential goods and services, oil and minerals, technology where private investment was lacking, and strategic products such as defence equipment |
| MRTP Act | No prior approval for expansion, mergers or new units; the focus moved to curbing unfair and restrictive trade practices |
- March 1993 change: compulsory licensing stayed for 18 industries, among them coal and lignite, petroleum products, sugar, motor cars, paper, drugs and white goods. The list later shrank to five.
- Later law: the Foreign Exchange Management Act replaced the Foreign Exchange Regulation Act from 1 June 2000, and the Competition Act (2002) superseded the MRTP framework.
- Private role in infrastructure: industrialists were invited into roads, power, communication and petroleum, leaving governments more room for social and economic programmes.
- Early path: the first years after the reforms saw low growth and even stagnation in major industries. Annual industrial growth then recovered to 12% in 1995–96.
- The Eighth Plan (1992–97) was drawn up against worsening inflation and balance of payments. It aimed at 5.6% annual growth and achieved 6.8%.
Features of Liberalisation
Industrial Sector
| Feature | Till 1991 | Since 1991 |
|---|---|---|
| Licensing | Government permission to start or close a firm | Removed except for five industries: alcoholic drinks, cigars and cigarettes, electronic aerospace and defence equipment, industrial explosives, hazardous chemicals |
| Output | Permission needed for the quantity produced | Firms decide |
| Public sector reservation | Private sector barred from many industries; 17 reserved | Cut to 8 in 1991, and by 2010–11 to two: atomic energy and railway operations |
| Small industry | Some goods only from small-scale units | Many items de-reserved; market forces allocate resources in place of government directives |
| Prices | Government controlled prices and distributed selected products, which led to corruption | In many industries the market sets prices |
- Atomic energy: the SHANTI Act (December 2025) replaced the Atomic Energy Act, 1962 and opened civil nuclear power to licensed private firms and joint ventures, while the state keeps control of strategic assets.
Financial Sector
- The RBI’s role shifted from “a regulator” to “a facilitator” of the financial sector.
- Private banks, domestic and international, were established under the RBI’s guidelines of January 1993. Examples: ICICI Bank and HDFC Bank (1994), and later Kotak Mahindra.
- Foreign investment limits rose gradually in various sectors, for both direct and portfolio investment.
- Insurance: the limit reached 100% in February 2026, through the automatic route, after the Sabka Bima Sabki Raksha Act, 2025.
- Banks were allowed to raise resources in India and abroad.
- Reforms reached insurance, money and capital markets.
- New institutions and regulators arose to suit these realities:
| Body | Role | Date |
|---|---|---|
| SEBI | Securities regulator | Set up 1988; statutory from 1992 |
| NSE | National stock exchange | Recognised 1993 |
| BSE | Older stock exchange, now under SEBI | Founded 1875 |
| IRDA (now IRDAI) | Insurance regulator | 1999 |
| PFRDA | Pension regulator | 2003; statutory from 2014 |
Tax Reforms
- Taxes on individual income have been reduced continuously since 1991.
- High income tax rates were held to encourage evasion, so moderate rates of income and corporate tax were brought in.
- Many procedures have been simplified.
- Indirect taxes: the Goods and Services Tax (GST) began on 1 July 2017.
- From 22 September 2025, GST moved to two main slabs of 5% and 18%, with a special 40% rate on a few items.
- The Income-tax Act, 2025 replaces the Act of 1961.
Foreign Exchange Reforms
- The rupee was devalued in two steps, on 1 and 3 July 1991, by about 18% against the US dollar in all.
- The aim was to raise exports and rebuild reserves, and it increased the supply of foreign exchange.
- Exchange rate steps: a dual rate came in March 1992 and a unified market rate in March 1993. The rupee became convertible on current account in August 1994.
- Demand and supply now set the rate, and the RBI steps in only to calm the market, a managed float.
Trade and Investment Policy
- Quantitative restrictions on imports were eased gradually.
- Import licensing was abolished, except for hazardous and environmentally sensitive industries.
- Restrictions on manufactured consumer goods and agricultural products were fully removed from April 2001.
- Export duties were removed, to make Indian goods more competitive abroad.
- Foreign direct and portfolio investment were liberalised gradually.
- Press Note 3 of 2020 placed investment from countries sharing a land border under the government route, and a 2026 revision eased it for small non-controlling stakes.
- Exports: ₹32,553 crore in 1990–91 and ₹18,94,182 crore in 2013–14. Goods exports were US$ 441.78 billion in 2025–26.
- Trade agreements under the foreign trade policy have widened fast: the UAE (2022), the European Free Trade Association (2025), and Oman, the United Kingdom and New Zealand (2026).
Disinvestment
- Disinvestment and privatisation both involve selling government shares in public enterprises, but they differ technically.
- Privatisation: transfer of 51% or more of the equity to private players.
- Disinvestment: sale of only part of the equity, less than 51%, so that ownership and management stay with the government.
- The method has changed over time with successive governments.
- There are two main approaches:
| Approach | Stake sold | Control | Form |
|---|---|---|---|
| Minority disinvestment | Government keeps a majority, typically over 51% | Stays with government | Shares sold as public offers |
| Strategic sale | A substantial part, 50% or higher | Passes to the buyer; government becomes a minority holder or exits | Sale to a chosen buyer |
- Current position: the New Public Sector Enterprise Policy (February 2021) keeps a bare minimum government presence in four strategic sectors and looks to privatise or close the rest, which sets the frame for disinvestment and privatisation today.
Privatisation
- Privatisation is the transfer of ownership, management and control of public sector enterprises to the private sector. It takes two forms:
- Withdrawal of government ownership and management, by leaving majority control of public companies.
- Outright sale of public companies.
- Most profitable undertakings were formed in the 1950s and 1960s, when self-reliance was central to public policy. They were meant to provide infrastructure and direct employment.
- The government later gave them more managerial and operational autonomy through the Navratna and Miniratna categories.
- December 2025 (Department of Public Enterprises): 14 Maharatna, 26 Navratna and 58 Miniratna enterprises.
- Operating central enterprises (Public Enterprises Survey): 291 in 2024–25, against 272 in 2023–24, with an overall net profit of ₹2.91 lakh crore, against ₹3.22 lakh crore.
- Pace of sale: critics of the 1991 policy count slow privatisation among its failures. Others reply that a reformed public sector has become profitable and strategically useful.
- Air India went to the Tata group, with the bid won in October 2021 and the transfer completed on 27 January 2022.
- IDBI Bank: on 14 October 2026, the Cabinet Committee on Economic Affairs approved the sale of a 60.72% stake for about ₹52,878 crore, subject to regulatory steps.
Globalisation
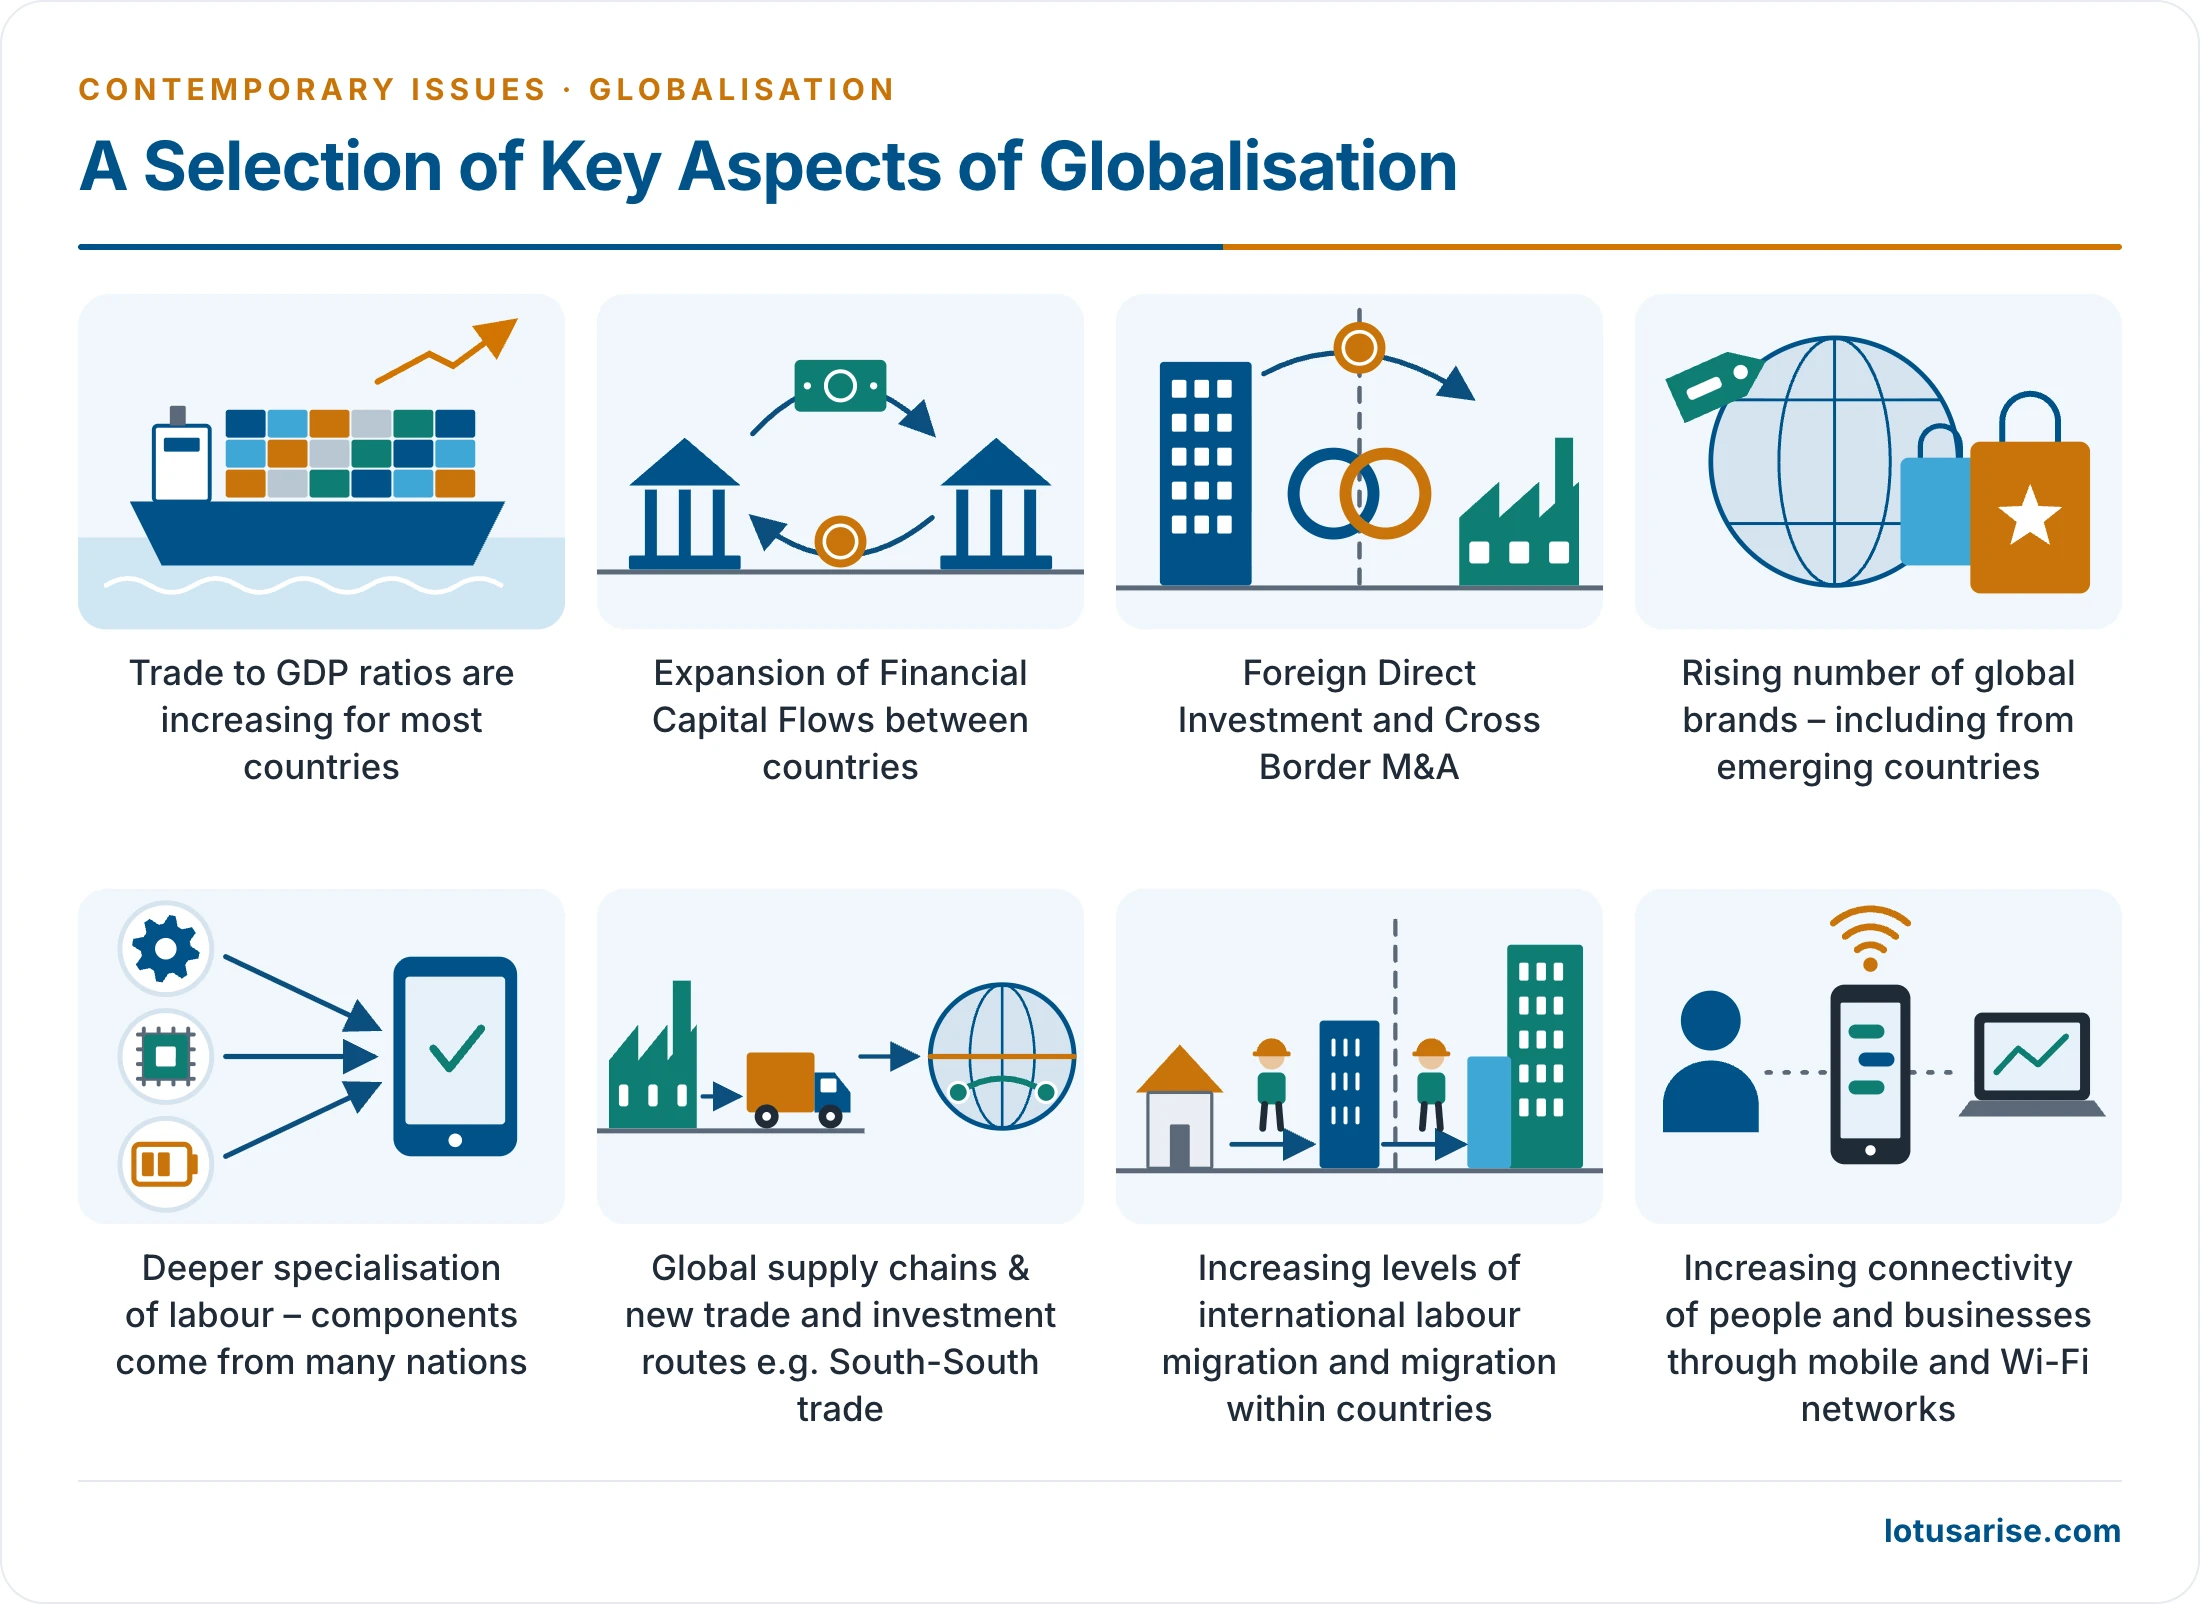
- Globalisation is the growing interdependence of the world’s economies.
- Economic globalisation aligns regional economies with the global economy through trade, foreign direct investment (FDI), capital flows, technology and wide-scale migration.
- Only after 1991 did the Indian economy taste the freedom of trade in a real sense.
- It is the outcome of liberalisation and privatisation.
- It is the free movement of trade, investment, people, services and technologies across borders, with some controls.
- It is complex: commercial activities move to places where they are cheaper.
- It has led to greater interdependence and integration of economic activity across the globe.
- It creates networks that cross economic, social and geographical boundaries, so that events in one country can shape events in another.
- The web of a product: research and development may sit in the USA, component making in China, accessories in Thailand, assembly in Poland and call centres in India.
- Apple shows how such webs shift. By a 2026 industry estimate, China assembled about 74% of iPhones in 2025 and India about 23%, against 14% in 2024.
Outsourcing: An Offshoot of Globalisation
- Outsourcing occurs when a company retains another business to do some of its work.
- These firms usually sit in foreign countries with lower labour costs and lighter regulation.
- Companies hire regular services from external sources, mostly abroad. The services are mainly computer-related back-end work, such as business process outsourcing (BPO) and knowledge process outsourcing (KPO).
- It has intensified with the advent of information and communication technologies (ICT).
- Low wages and English-speaking skilled manpower made India a global outsourcing destination after the reforms.
- The software industry grew about 52% a year between 1991 and 1996, drawing on a large pool of technical skill.
- In 2025–26, the technology sector earned about US$ 315 billion, of which about US$ 246 billion came from exports.
Advantages of Globalisation
- Competition: more competition raised the productivity of domestic industries, though only partly in India.
- Quality and price: quality has improved and prices have fallen for many products.
- Choice: consumers have wider choices.
- Living standards: higher incomes and opportunities have lifted a larger section of society.
- Capital and technology: foreign capital brings updated technology, which improves production.
- IT: the IT industry has grown immensely.
- Local suppliers: local firms supplying raw materials to big industries have gained, and some Indian firms have grown from local to global, into big multinationals.
- Foreign investment:
- FDI and foreign portfolio investment (FPI) together came to just US$ 100 million in 1990–91.
- FDI equity alone was about US$ 40 billion in 2015–16.
- 2025–26: total FDI inflow was US$ 94.52 billion, FDI equity US$ 58.84 billion, and net FDI US$ 7.7 billion after repatriation and outward investment.
- Cumulative FDI grew from US$ 277.86 billion (April 2000 to November 2012) to about US$ 1.16 trillion (to March 2026).
- Foreign exchange reserves:
- Foreign currency assets stood at US$ 2.24 billion at end-March 1991.
- Total reserves were about US$ 373 billion in 2017.
- They reached a record US$ 785.7 billion on 4 September 2026 and stood at US$ 721.0 billion on 16 October 2026.
- Industrial revival: foreign investment and technology revived old units and created new ones.
- The slump of 1991 had eased by 1994, when automobiles, consumer electronics, textiles, petrochemicals and software grew at about 20%.
- India also took the global recession of 2008 relatively well, though industrial growth fell to 2.5% in 2008–09.
- Infrastructure: heavy investment flowed into transport and electricity, both weak before the reforms.
- GDP growth: growth before 1980 was known as the Hindu rate of growth, a term of the economist Raj Krishna for a rate of about 3–3.5%. It rose after liberalisation:
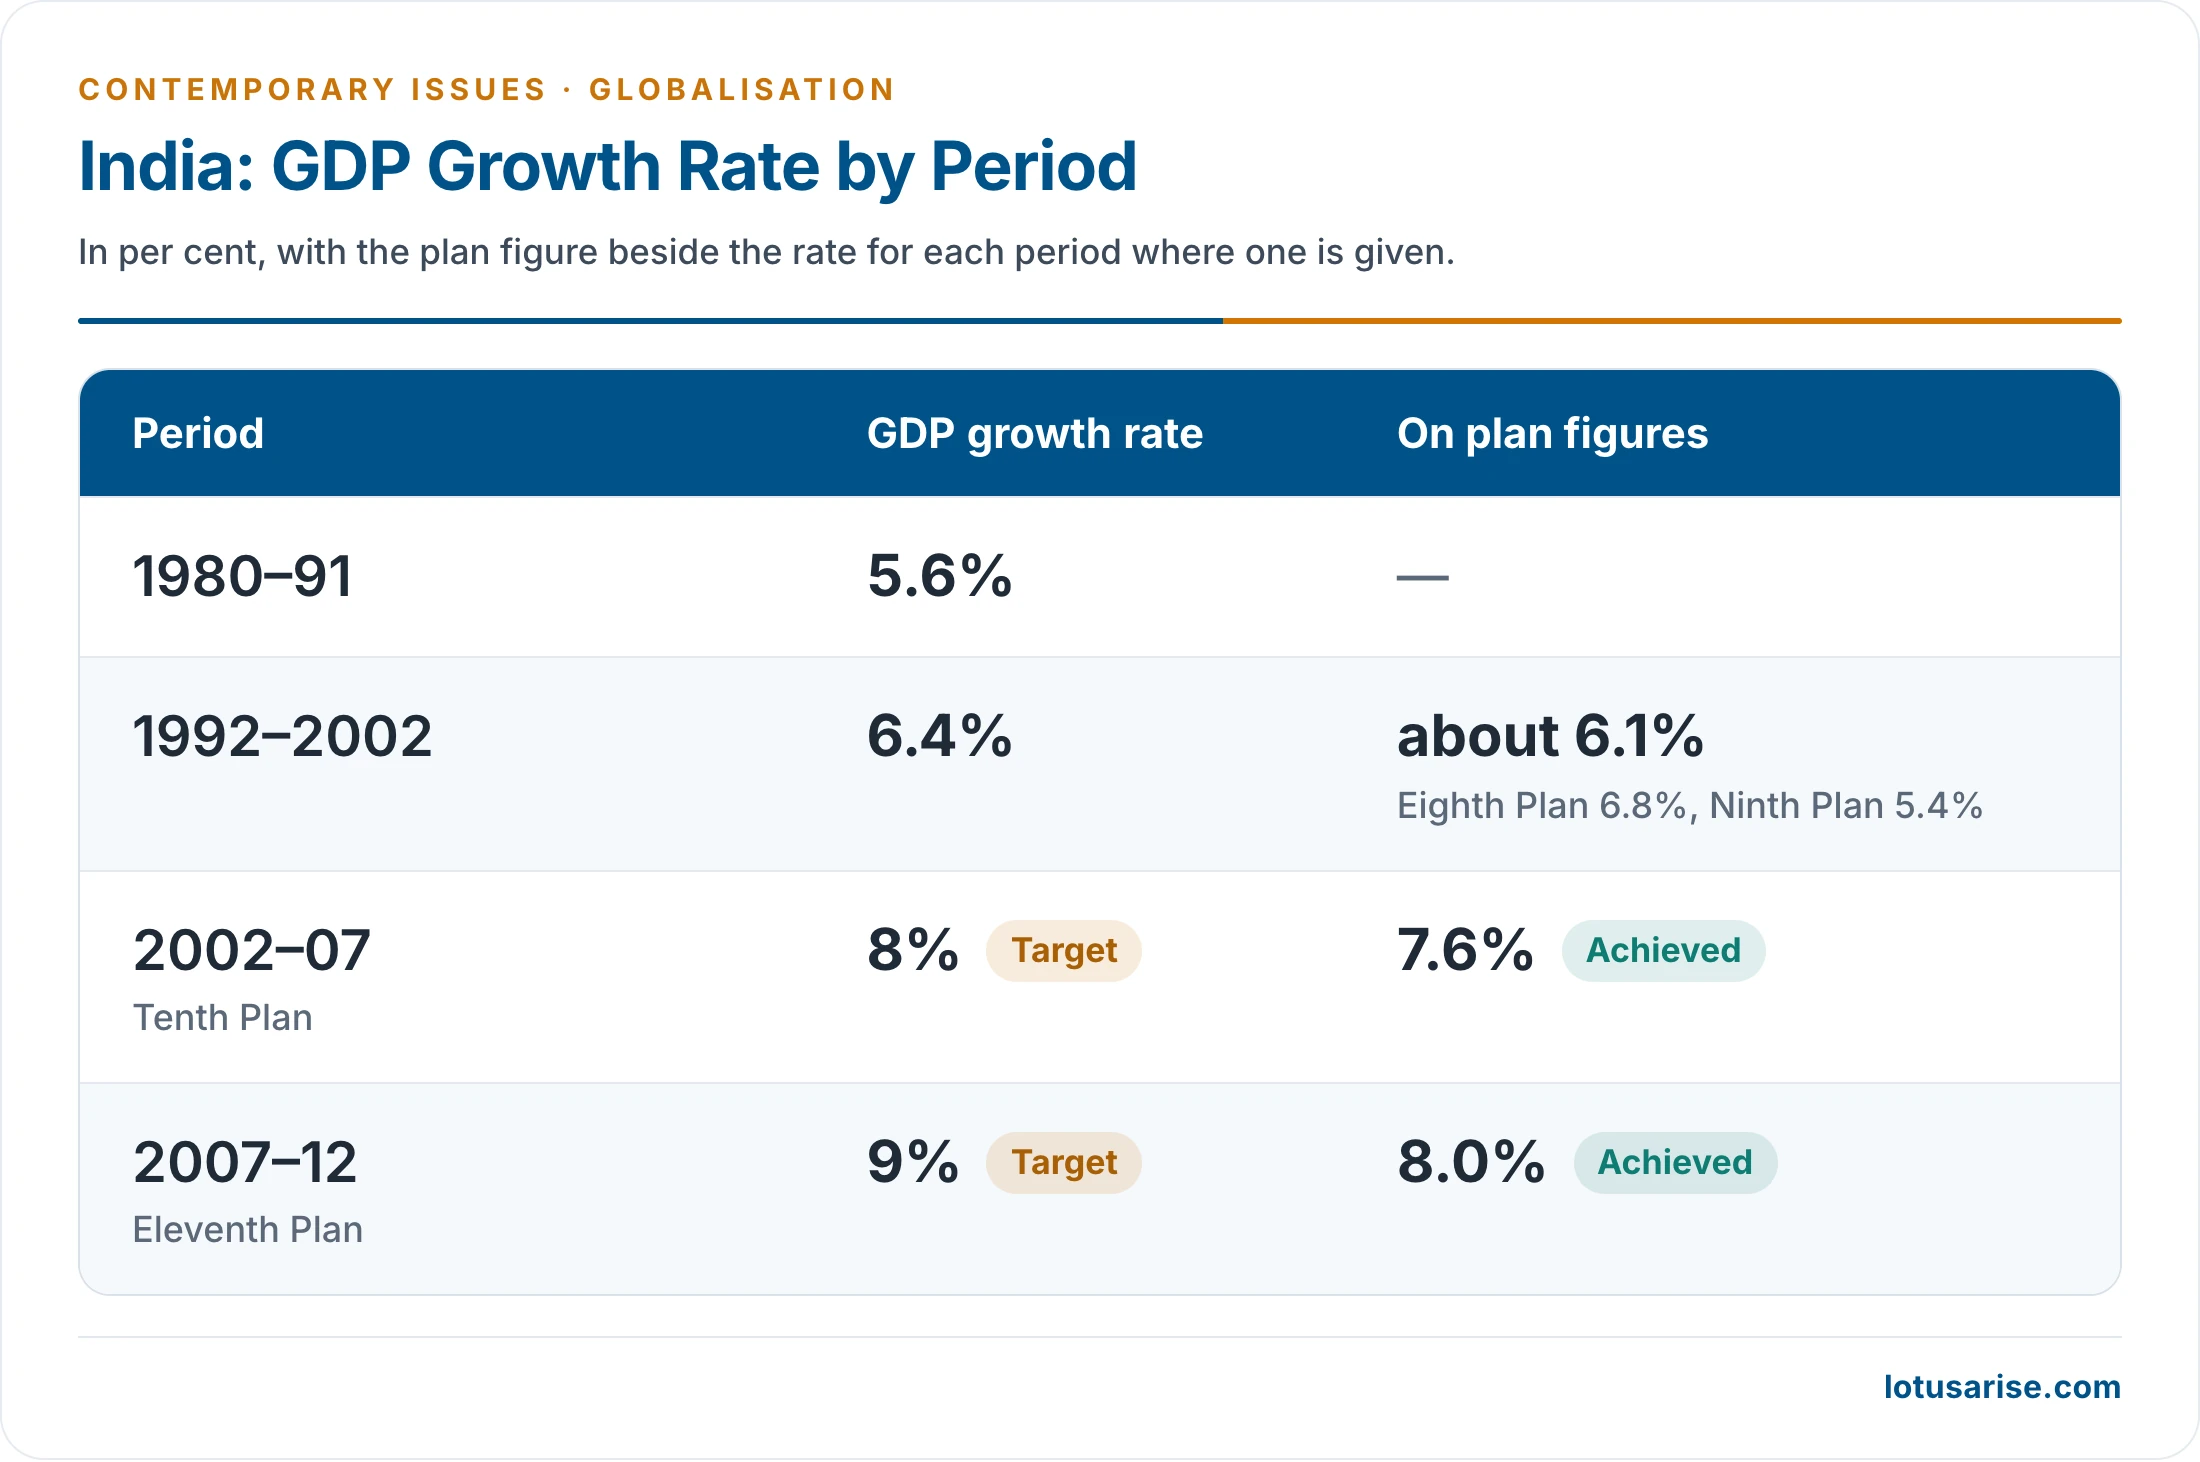
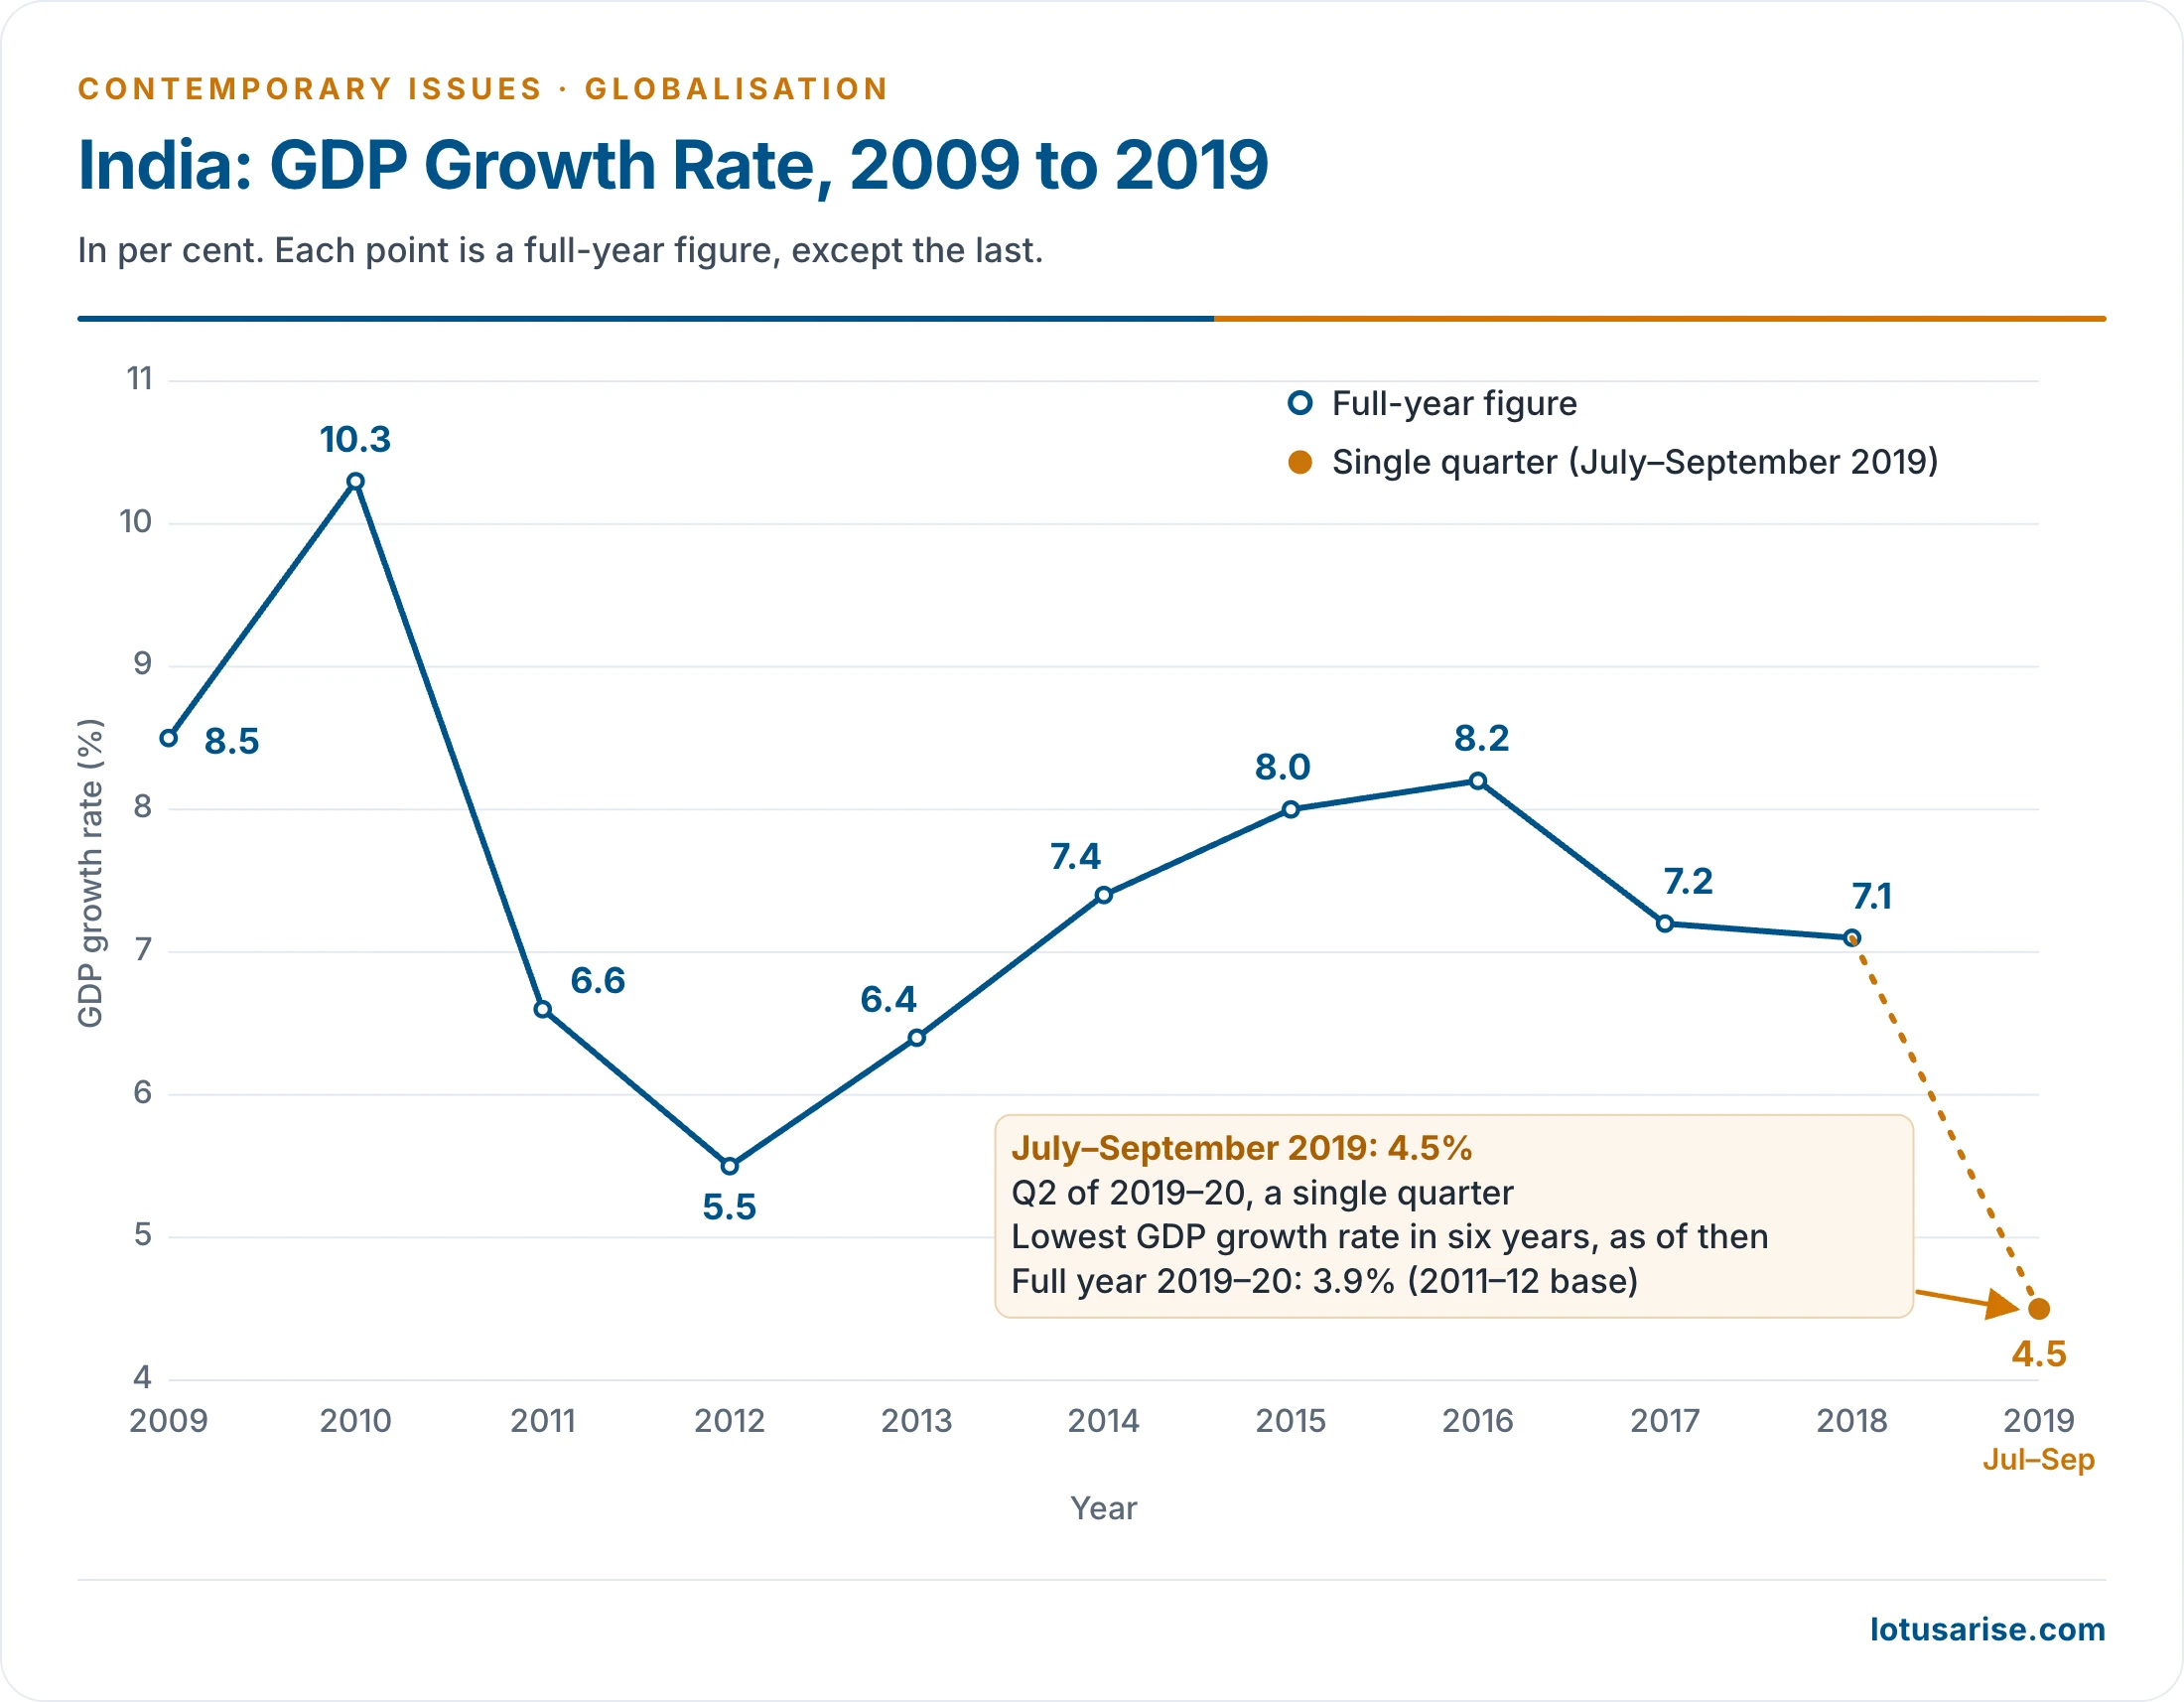
- Later years follow below.
| Period | Growth (%) | Basis |
|---|---|---|
| Eighth Plan, 1992–97 | 6.8 | Plan average |
| Ninth Plan, 1997–2002 | 5.4 | Plan average |
| Tenth Plan, 2002–07 | 7.6 | Plan average |
| Eleventh Plan, 2007–12 | 8.0 | Plan average |
| Twelfth Plan, 2012–17 | about 7.1 | Plan average |
| 2019–20 | 3.9 | 2011–12 base |
| 2020–21 | −5.8 | 2011–12 base; Covid-19 year |
| 2021–22 | 9.7 | 2011–12 base |
| 2022–23 | 7.6 | 2011–12 base, final |
| 2023–24 | 9.2 | 2011–12 base, first revised |
| 2024–25 | 7.1 (6.5 on the 2011–12 base) | 2022–23 base |
| 2025–26 | 7.7 | 2022–23 base, provisional (June 2026) |
- Services: most GDP growth has come from the service sector. World Bank figures put services at 37.0% of GDP in 1990 and 49.3% in 2025, and agriculture at 27.6% and 16.2%.
- Going abroad: Indian companies have left footprints overseas.
- Tata group: Tetley (2000), NatSteel (2004–05) and Corus (2007).
- VSNL, later Tata Communications: Tyco Global Network and Teleglobe (2005–06).
Disadvantages of Globalisation
- Rural–urban gap: critics hold that reform widened the gap between rural and urban India, with joblessness, the growth of slums and greater exposure to terrorism, while well-off urban groups gained most.
- Competition: some small producers could not survive against foreign firms.
- Units making batteries, plastic toys and tyres and other micro, small and medium enterprises (MSMEs) shut down, causing job losses. Toys are the classic case.
- Cottage and small-scale industries, the livelihood of millions of village artisans, lacked the finance and technology of big firms.
- Job quality: more employment is flexible or temporary, because of competition and uncertainty.
- Sectoral imbalance: manufacturing as a whole suffered while services benefited. Manufacturing was 16.6% of GDP in 1990 and 13.5% in 2025.
- Foreign subsidies: domestic industries also suffered from subsidies other countries gave their own firms.
- Jobless growth: reform-led growth has not created employment in step with output.
- Labour-saving technology came along with heavy investment.
- Agriculture still held about 46% of workers in 2023–24 (Periodic Labour Force Survey), far above its share of output.
- The four Labour Codes took effect on 21 November 2025. Supporters call them a simplification, and unions oppose them as weakening worker protection.
- Agriculture: critics call the fall in public investment in irrigation, power, roads, market links and research the biggest drawback of the reform period.
- Liberalisation favoured industry, they add, over a sector then supporting more than 55% of the people.
- Power tariffs: reform in the power sector brought a steep rise in tariffs, which hit some groups hard. Suicides among the powerloom weavers of Sircilla (now in Telangana) in the early 2000s are linked to it, alongside debt and weak markets.
- Farmers: small and marginal farmers were affected adversely, with rising suicides among cotton farmers of the Deccan.
- National Crime Records Bureau, 2023: 10,786 suicides in the farm sector, of which 4,690 were cultivators and 6,096 agricultural labourers. Maharashtra (38.5%) and Karnataka (22.5%) led.
- Imports: products that were not world class lost demand to cheaper imports.
- Narrow investment: only a few sectors attracted investment, and infrastructure stayed inadequate across the country.
- Foreign money favoured white goods over wage goods, and could not always be absorbed productively.
- Portfolio money, easily withdrawn, has often been preferred to direct investment. Net portfolio outflow was about US$ 16.5 billion in 2025–26.
- Protectionism abroad: policies of developed countries have denied a level playing field and cut the export income of developing countries such as India.
- USA: tariffs of up to 50% from August 2025, cut to 18% under a February 2026 framework.
- Welfare spending: critics argue that lower tariffs and pressure from multilateral lenders cut development and welfare expenditure.
- Other criticisms:
- Inflation has at times reached double digits, and the gap between rich and poor has widened.
- Some critics fear that foreign firms could gain too much power over economic and political choices, while others credit multinational companies with capital, technology and exports.
Regional Effects of the Reforms
- Investors, Indian and foreign, chose regions that were already industrially advanced, widening the older regional imbalance.
| Theme | Early reform years | Latest position |
|---|---|---|
| Investment | 1994: Maharashtra led with ₹3,744.71 crore, then West Bengal with ₹2,844 crore | 2025–26: Maharashtra led FDI with about US$ 18.4 billion, then Karnataka |
| Who gained | Maharashtra, Gujarat, Rajasthan, West Bengal, Andhra Pradesh, Tamil Nadu, Karnataka | Mainly western and southern States and the National Capital Region |
| Who lagged | Bihar, Uttar Pradesh, Odisha, Himachal Pradesh, Uttarakhand, Jammu and Kashmir, Meghalaya, Mizoram, Tripura, Nagaland | Bihar, the north-eastern States and others |
| Income gap | Top-to-bottom ratio of per capita income among 20 major States: 4.9 (2011–12) | 5.6 (2023–24) |
- Infrastructure: of 33 electricity projects sanctioned in 1994, Odisha received 6 and Karnataka 5, while Madhya Pradesh, Uttar Pradesh, Bihar, Mizoram, Nagaland and Delhi received none.
- Enclaves: export zones, from Asia’s first at Kandla (1965) to the special economic zones of the Act of 2005, cluster strongly. Special economic zones numbered 277 operational on 31 March 2026.
- Farm regions: poor returns and lasting debt are common, and even richer farm States such as Punjab and Maharashtra have recorded farmer suicides.
- Skills and cities: after 1991, skilled emigration grew in software, management and finance, and the technology boom lifted a few metropolitan regions, mostly southern and western, along with the National Capital Region.





Really very helpful. Thanks for all ur efforts.
Thank a lot Sir
Extremely helpful, Thanks!
Substantial sale and Privatisation both terms are same??
Substantial sale means transferring of assets not less than 25% and rest you know
THANKSSS IT WAS OF GREAT HELP