

- Any crop rich in sugar can serve as a raw material, including sugar beet, but Indian mills run overwhelmingly on sugarcane.
- Among agro-based industries, it ranks second only to cotton textiles in India.
- World standing: India is the largest consumer and second-largest producer of sugar, behind Brazil, in government statements of 2024-25.
- In the record season of 2021-22, it was reported as the world’s largest producer and consumer and the second-largest exporter.
- The first sugar mill in India was set up in 1840 at Betia in Bihar.
- The mills depend on a crop that takes 10–18 months to mature and needs water throughout, which ties the industry closely to the irrigated belts of India’s cropping pattern.
- A sugar season runs from October to September, and its figures are quoted on that basis.
The Industry in Numbers
| Measure | Older figure | Recent figure |
|---|---|---|
| Sugar factories | 420 (1994-95) | 535 (2023-24), 534 (2024-25) |
| Cane output | over 5,000 lakh tonnes (2021-22) | 4,546 lakh tonnes (2024-25); about 5,000 lakh tonnes (2025-26) |
| Cane area | 54.5 lakh hectares (2024-25); 58.87 lakh hectares (2025-26) | |
| Direct workers | 2.86 lakh | about 5 lakh |
| Cane farmers | 2.5 crore growers | nearly 5 crore farmers |
| Domestic use | 280–290 lakh tonnes a year |
- Season 2021-22 as a worked example:
- Over 5,000 lakh tonnes of cane were grown, and mills crushed about 3,574 lakh tonnes, or some 71% of it.
- This could yield about 394 lakh tonnes of sugar. Of that, 35 lakh tonnes went to ethanol and 359 lakh tonnes came out as sugar.
- Recent output:
- 2023-24: about 320 lakh tonnes, after about 24 lakh tonnes went to ethanol.
- 2024-25: 261.08 lakh tonnes net, from a gross 296.10 lakh tonnes (industry estimate).
- 2025-26: about 306 lakh tonnes, against a first estimate of about 343 lakh tonnes, as red rot, top borer and waterlogging hit the crop.
- Normal levels: India makes about 300–340 lakh tonnes of sugar in an average year, a little above home use, so a good crop means a surplus and a poor one means tight supply.
- Investment: older data put capital in the business at Rs 1,250 crore.
- Markets abroad: the main buyers are Sri Lanka, West Asia and East Africa.
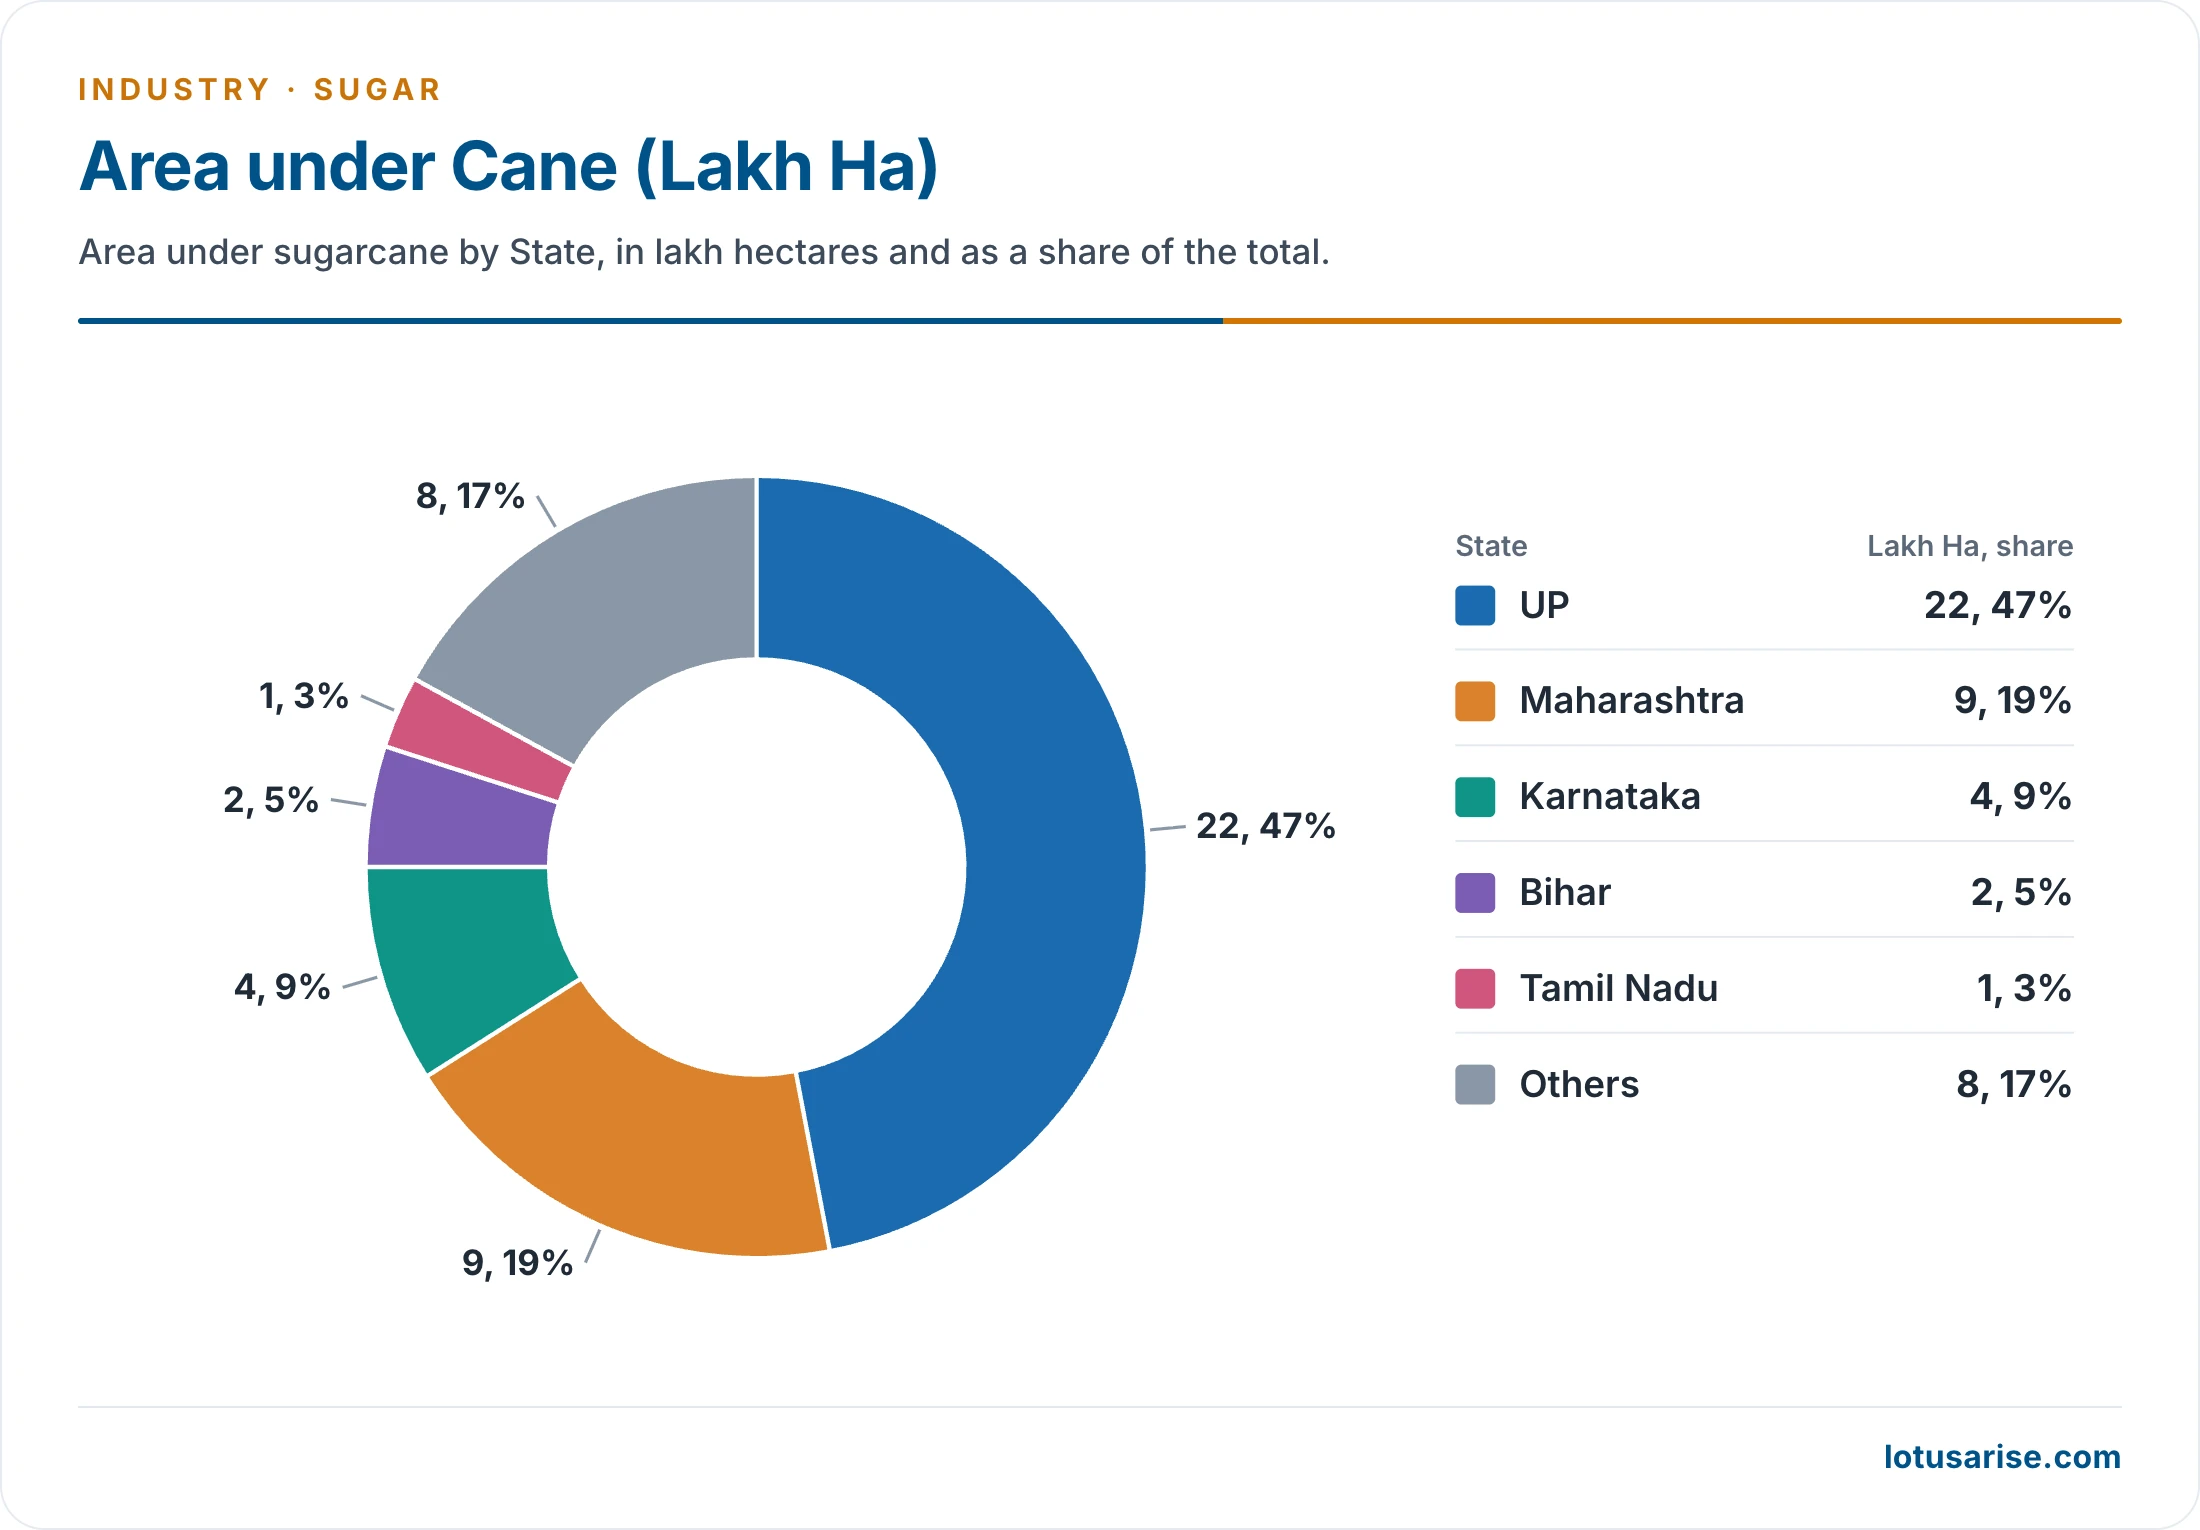
- This chart is undated, and its total of about 46 lakh hectares is below today’s national area, given in the table above.
Why Mills Stay Close to Cane
- Nature of the raw material: sugarcane is heavy, low in value, weight-losing and perishable, which ties mills to the fields.
- Sucrose is lost in storage, so it cannot be kept indefinitely.
- Long hauls raise costs, and the cane may dry out on the way.
- Cost: cane alone accounts for about 50% of the cost of production.
- Weight loss: about 100 tonnes of cane give 10–12 tonnes of sugar.
- Distance: bullock carts carry cane only 20–25 km. Tractor-trolleys, trucks and rail wagons stretch this to 70–75 km, beyond which the cost becomes excessive.
- Processing steps: cane is crushed for juice, which is cleaned, boiled down under vacuum and crystallised, and the crystals are spun free of molasses. The crushed fibre left behind is bagasse, and the filter residue is pressmud.
- Hence mills are set up in the cane-growing areas.
- This is a classic case of a weight-losing raw material, for which Alfred Weber’s location model predicts a site at the source of the material. Each mill therefore commands its own cane zone around it.
Historical Background
- Sugar making in India is very old, and the Atharva Veda already refers to it.
- The country has a fair claim to be the homeland of sugar, as the original home of both the cane and its manufacture.
- Ancient production stopped at gur and khandsari.
- The ancient method: cane was cut in pieces and crushed under a heavy weight, and the juice was boiled and stirred until it turned solid.
- The uneven solids were called sarkara, a Sanskrit term for gravel, which is the root of the word sugar.
- First attempts: the Dutch brought modern sugar making to North Bihar around 1840, in the middle of the 19th century. This did not succeed.
- First success (1903): indigo planters, encouraged by the British, started vacuum pan mills at Pursa, Pratapur, Barachakia, Marhowrah and Rose in north-eastern Uttar Pradesh and adjoining Bihar.
- They turned to sugar because synthetic blue dye had ended the demand for indigo.
- Slow start: the count stood at just 18 mills in 1920-21, reaching 29 by 1930-31.
- Fiscal protection in the early 1930s changed this. The count reached 137 mills in 1936-37, and output rose from 1.58 lakh to 9.19 lakh tonnes over the same period.
- Unsteady years followed during and after World War II. Stability came only after 1950-51, when 139 mills made 11.34 lakh tonnes.
- Plan period: growth was rapid, with 420 mills making 148 lakh tonnes in 1994-95.
- Output swings widely from year to year, within a rising long-term trend:
| Season | Sugar output (lakh tonnes) |
|---|---|
| 1950-51 | 11.34 |
| 1970-71 | 37.40 |
| 1990-91 | 120.47 |
| 2000-01 | 185.10 |
| 2006-07 | 281.99 |
| 2008-09 | 146.77 |
| 2011-12 | 274.30 |
| 2021-22 | 359 |
| 2024-25 | 261.08 |
Legislation and Government Initiatives
Early Legislation
- The Sugar Industry Protection Act was passed by the Indian Legislature in 1932, granting protection to the indigenous industry.
- Within four years, the country had become self-sufficient in sugar by 1935.
Deregulation and After
- 2013-14 was a watershed. The Centre accepted the suggestions of the deregulation committee led by Chakravarthi Rangarajan.
- It ended the levy on mills for sugar produced after September 2012, and also the regulated release mechanism on open-market sales.
- Under the levy, mills handed over 10% of output to the Centre below market price for ration shops. States now buy ration sugar on the open market, with the Centre reimbursing part of the cost.
- Under regulated release, the Centre set quotas for how much non-levy sugar each mill could sell, which forced mills to carry stocks and made it hard to plan cash flow.
- Aims: better financial health of mills, stronger cash flow, lower inventory costs and timely payment to growers.
- The minimum distance norm and cane price formula were left to States to adopt as they see fit.
- It ended the levy on mills for sugar produced after September 2012, and also the regulated release mechanism on open-market sales.
- Minimum selling price of sugar: raised from Rs 29 to Rs 31 per kg in February 2019, to help mills clear farmers’ arrears. Mills were still pressing for a further rise in 2026, as the FRP has kept climbing.
- Ethanol incentives: support for ethanol from B-heavy molasses and cane juice redirects surplus sugar to biofuel and indirectly lifts sugar prices.
- Sugar (Control) Order, 2025: it replaced the Sugar (Control) Order, 1966 and the Sugar Price (Control) Order, 2018.
- It links mills to the department’s portal by real-time data, and covers by-products including ethanol.
- It also lets the government regulate the diversion of sugar, so that enough remains for home use.
- Export control: exports are now managed by quota. 15 lakh tonnes were allowed for 2025-26 in November 2025, and exports stood at about 8 lakh tonnes for that season, up from 0.47 lakh tonnes in 2016-17.
- Season 2021-22 stands out, with exports capped at 100 lakh tonnes.
- The 2026 price rise: retail sugar rose from Rs 48.18 to Rs 55.70 per kg between 20 July and 20 August 2026.
- Before this, retail prices had risen only about 3% a year between August 2024 and July 2026, so the spike was a short-term one.
- Causes: lower output, festive demand, weather damage, tight world supply and hoarding by some traders and mills.
- Responses: a 400-tonne stock limit on dealers from 1 August to 30 November 2026, limits for bulk users, and duty-free import of 10 lakh tonnes of raw sugar. Crushing was also advised to begin earlier, from 15 October 2026.
National Policy on Biofuels, 2018
- The target: the policy set 20% blending of ethanol with petrol by 2030.
- A 2022 amendment advanced this to Ethanol Supply Year 2025-26.
- India reached the 20% blend in 2025. Average blending was 19.24% in 2024-25, and no decision has been taken to go beyond 20%.
- Feedstock: the policy widened the raw materials allowed.
- Sugarcane juice, sugar beet and other sugar-containing materials
- Starch-containing materials such as cassava
- Damaged food grains such as broken rice, and rotting potatoes, unfit for human use
- Surplus grain may be used for ethanol, so that farmers get a fair price in years of plenty.
- Second-generation plants: the policy stresses advanced biofuels. 2G ethanol biorefineries get a viability gap funding plan of Rs 5,000 crore over six years, added tax benefits, and a higher purchase price than first-generation biofuels.
- Biodiesel: supply chains are encouraged from non-edible oilseeds, used cooking oil and short-gestation crops.
- Coordination: it sets out the tasks of each department and ministry dealing with biofuels.
- Scale of the programme: blending rose from under 1.5% in 2013-14 to 20% in 2025-26.
- Ethanol procurement grew from about 38 crore litres in 2013-14 to a projected over 1,200 crore litres in 2025-26, and capacity from 421 crore litres in 2014 to about 2,000 crore litres in 2026.
- The logic is energy security, since India imports about 88.5% of its crude oil. Foreign exchange saved since 2014-15 exceeds Rs 1.90 lakh crore, up to May 2026.
- Sugar’s changing share:
- Nearly three-fourths of ethanol now comes from grains, particularly maize.
- Sugar diverted to ethanol fell from about 12% in 2022-23 to about 9% in 2025-26.
- Mills earned over Rs 1.29 lakh crore from ethanol between 2014-15 and 2024-25.
- In surplus years, unsold stocks lock up mill funds and delay cane payments. Diversion to ethanol eases this, which is why it has improved mill finances and farmer payments alike.
Rangarajan Committee (2012)
- Set up in 2012 to advise on regulation of the sugar sector.
- Trade: replace quantitative limits on export and import with suitable tariffs, and end outright bans on exports.
- Distance: the Centre’s 15 km minimum radial distance between two mills often creates a virtual monopoly over a vast area, giving mills too much power over farmers. The committee asked for a re-examination.
- By-products: free sale at market-determined prices.
- Power: States should allow mills to use energy generated from bagasse.
- Non-levy sugar: remove limits on its distribution, which would improve mill finances, speed up payment and reduce arrears.
- Cane price: the Commission for Agricultural Costs and Prices advocated a hybrid approach, built around the fair and remunerative price.
Fair and Remunerative Price (FRP)
- Definition: the minimum price mills must pay farmers for cane.
- How it is set: on Commission for Agricultural Costs and Prices recommendations, after consulting State governments and other stakeholders.
- Current rate: Rs 365 per quintal for 2026-27, at a basic recovery of 10.25%, with Rs 3.56 per quintal for each 0.1% above that.
- It stood at Rs 139.12 in 2010-11, Rs 210 in 2013-14, Rs 340 in 2024-25 and Rs 355 in 2025-26.
- Older base: the FRP for 2016-17 was Rs 230 per quintal at a basic recovery of 9.5%, so both the price and the base have moved up.
- Low-recovery mills: for recovery below 9.5%, no deduction applies, and farmers get Rs 338.30 per quintal in 2026-27.
- State Advised Price (SAP): Uttar Pradesh, Punjab, Haryana, Tamil Nadu and Uttarakhand set their own price, normally above the FRP.
Geographical Distribution
- The map shows twin clusters of mills, one on each side of the Vindhyas:
- North: Uttar Pradesh, Bihar, Haryana and Punjab
- South: Maharashtra, Karnataka, Tamil Nadu and Andhra Pradesh
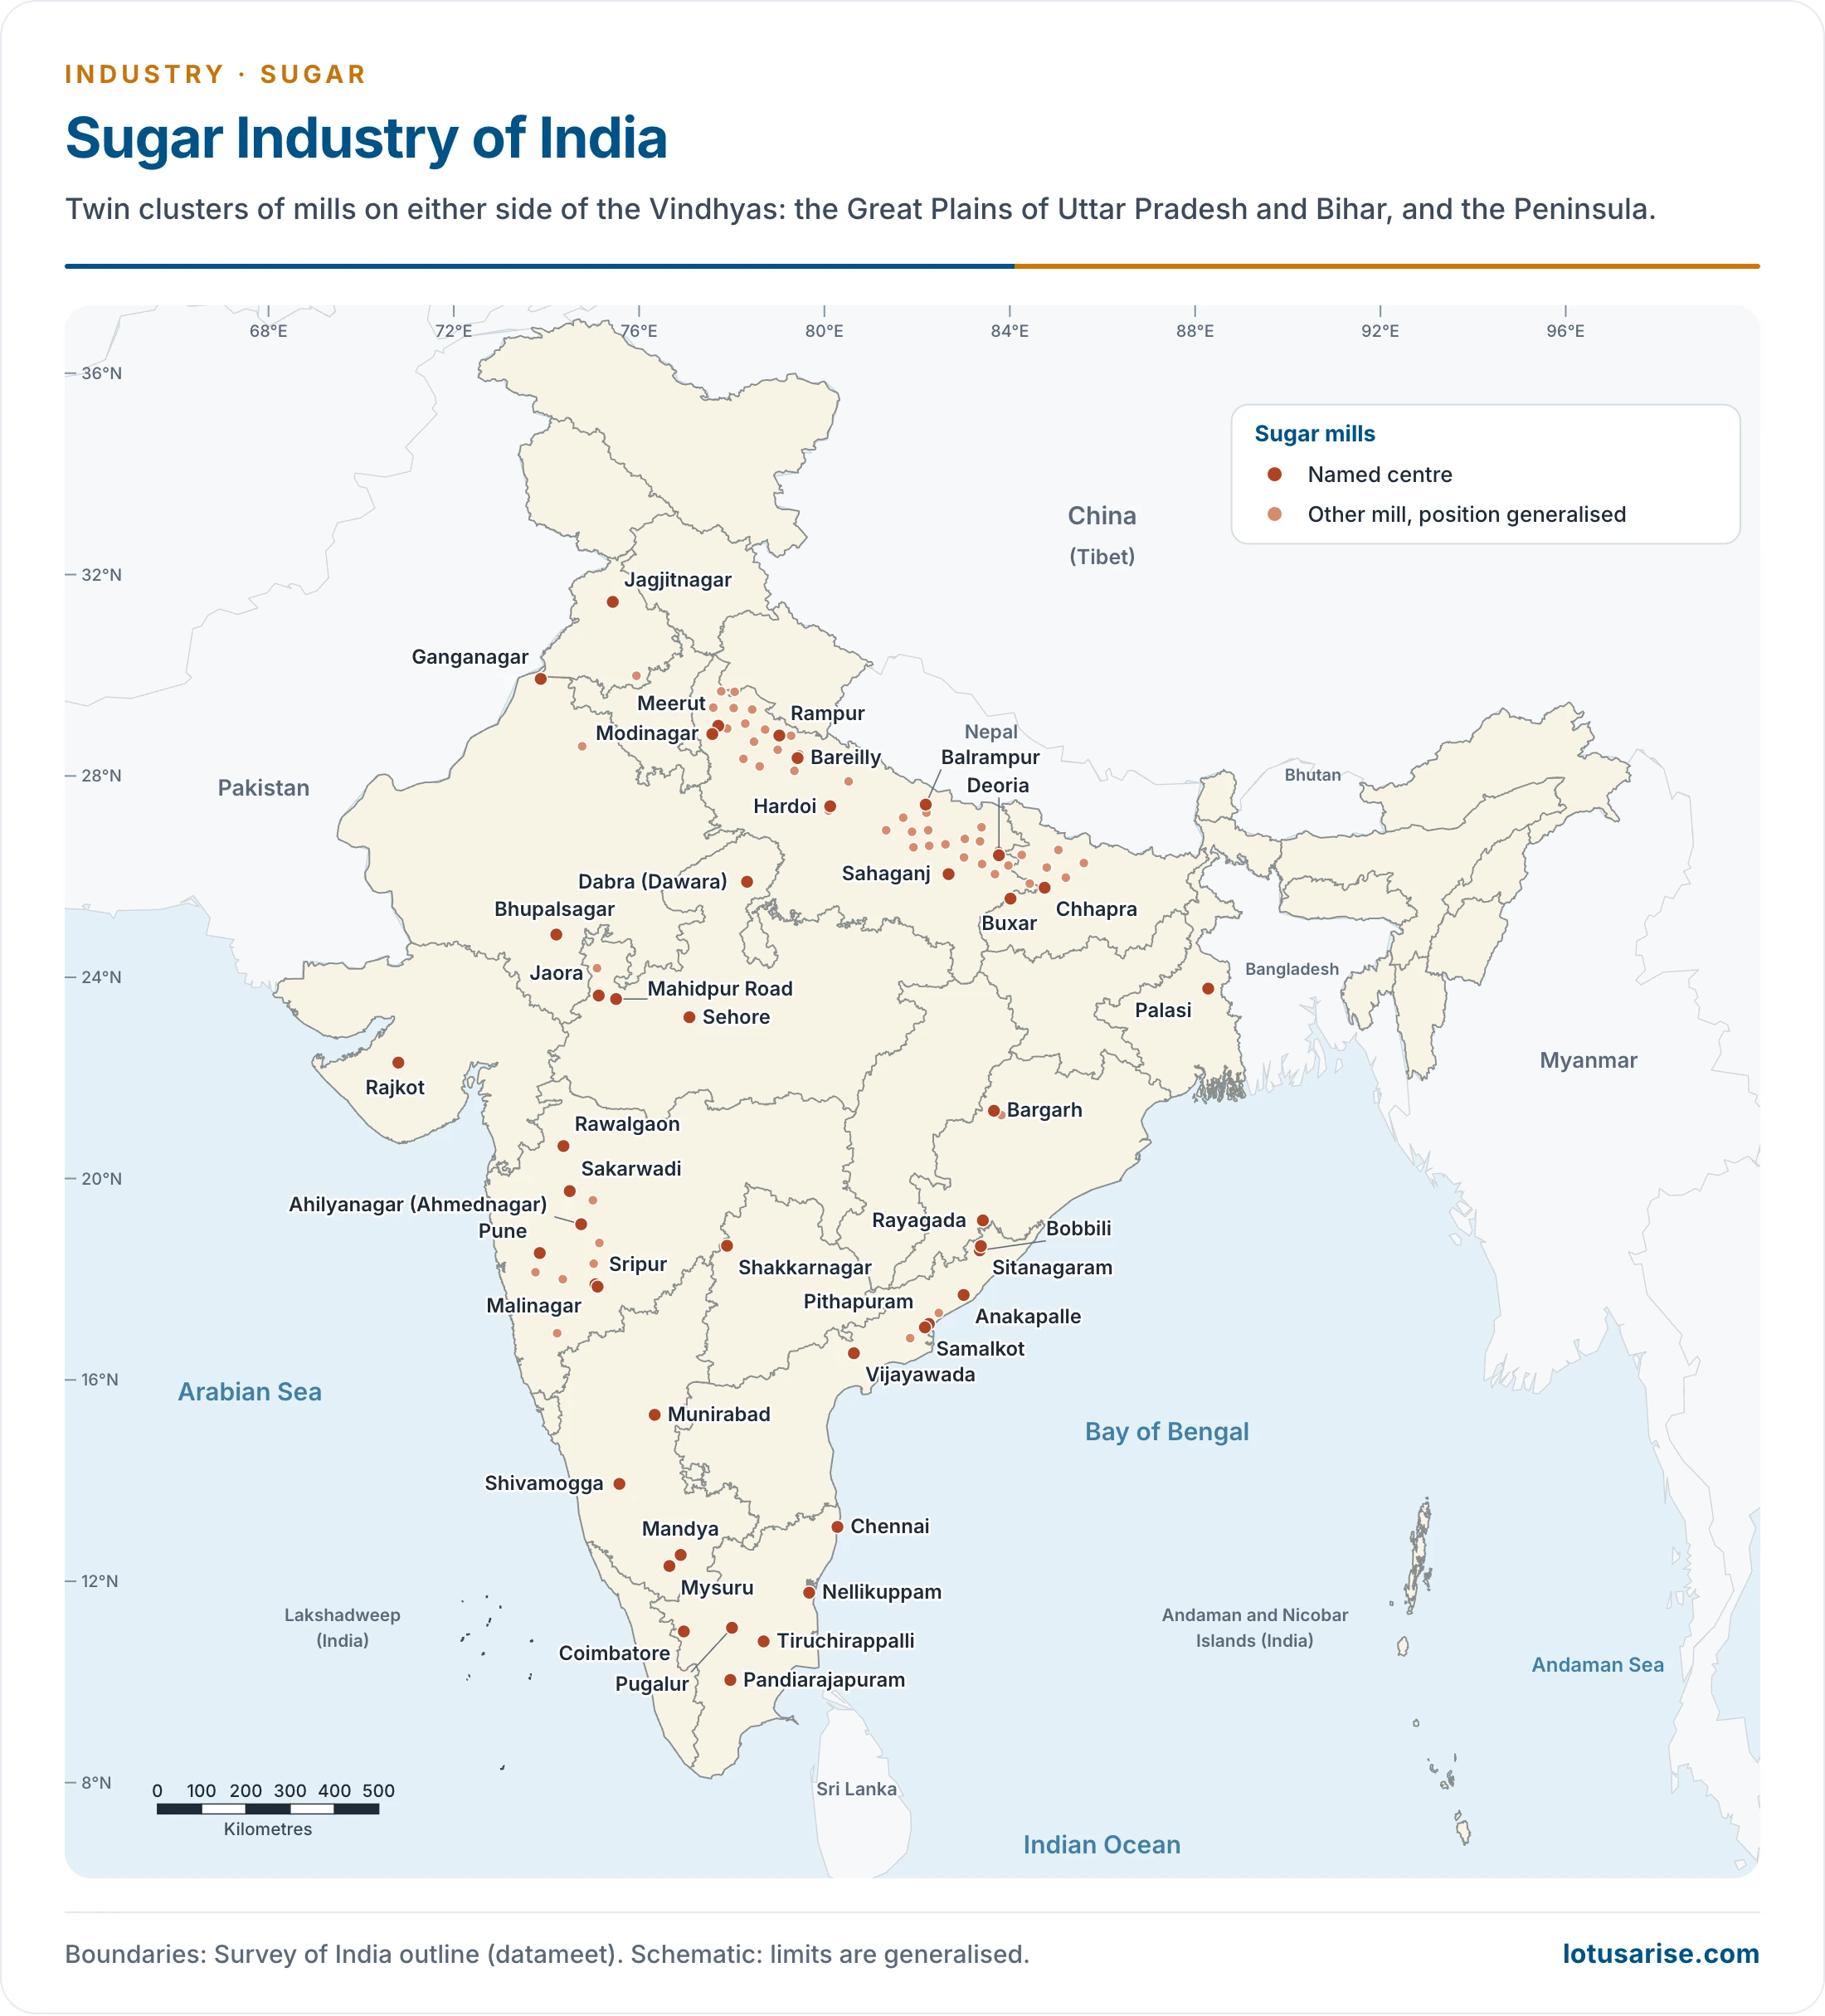
- Cane output shares, 2024-25: Uttar Pradesh 48.6%, Maharashtra 24.2%, Karnataka 10.6%, Gujarat 3.0%, Tamil Nadu 2.9%.
- Sugar output, 2024-25 (lakh tonnes, industry estimate): Uttar Pradesh 101.01, Maharashtra 93.51, Karnataka 54.89.
Uttar Pradesh
- The traditional leader, and first among the sugar States for most of the industry’s history. It gave up the top place to Maharashtra for a time, and the two now trade the lead.
- It has more mills than Maharashtra, though they are smaller and yield less. An older share of sugar was about 24%.
- Two regions:
- Eastern: Gorakhpur, Deoria, Basti and Gonda
- Upper Ganga Plain: Meerut, Saharanpur, Muzaffarnagar, Bijnor and Moradabad
- It is the largest cultivator of cane, the earlier level of over 177 million tonnes having grown to about 221 million in 2024-25.
- Perennial water from the Ganga system is the main reason.
- Major cane districts: Meerut, Bareilly, Saharanpur and Bulandshahr.
Maharashtra
- Second in cane, helped by large cane output, higher recovery and a longer crushing period.
- Older shares: about one-fourth of all mills, and between one-fifth and one-third of India’s sugar. Its mills are much larger than those elsewhere.
- Cooperative model: Asia’s first cooperative sugar factory came up at Pravaranagar (Loni) in Ahmednagar (now Ahilyanagar) district, working from 1950, through Vithalrao Vikhe Patil with Dhananjay Ramchandra Gadgil. Growers themselves became owners, and this model spread through the western valleys.
- Location: river valleys of the western Maharashtra Plateau.
- Ahmednagar is the largest centre, with others in Kolhapur, Solapur, Satara, Pune and Nashik.
- For 2021-22, cane area was put at 12.32 lakh hectares, with an expected yield of 97 tonnes per hectare.
- Main cane districts: Pune, Satara, Solapur, Ahmednagar and Aurangabad.
Karnataka
- Third-largest cane producer, with over 38 million tonnes in 2019-20. Climate favours high-quality cane.
- Mills: highest concentration in Belagavi and Mandya, with others scattered in Vijayapura, Ballari, Shivamogga and Chitradurga. An older count gave 30 mills and over 6% of output.
- Largest cane districts: Shivamogga, Mysuru, Belagavi and Chitradurga.
- Irrigation is the key, from the Cauvery in the south of the State and from the Krishna basin in the north.
Tamil Nadu
- Rapid progress rests on high cane yield, high sucrose, high recovery and a long crushing season, which gave the highest sugar yield per hectare in India (9.53 tonnes in older data).
- Older rank: third in sugar, with over 9% of output from 32 mills.
- Cane: fourth in older lists at about 18.5 million tonnes a year, slipping to fifth in 2024-25.
- It leads in productivity, at 99 tonnes per hectare in older figures and 102 in 2024-25.
- Mills: Coimbatore, Tiruppur, Karur and Tiruchirappalli.
Bihar
- Second only to Uttar Pradesh until the mid-1960s. Sluggish growth then cost it this place to Maharashtra, Tamil Nadu, Karnataka and Andhra Pradesh.
- Its 28 mills in older counts made little sugar.
- It remains a top producer of cane and jaggery, thanks to fertile plains.
- The eastern Uttar Pradesh belt runs on into Darbhanga, Saran, Champaran and Muzaffarpur. Patna, Darbhanga, Gaya and Champaran are major contributors.
Other States
| State | Older position | Mill districts or cane areas |
|---|---|---|
| Gujarat | 16 mills; 5.56% of sugar; 3% of cane | Surat, Bhavnagar, Amreli, Banaskantha, Junagadh, Rajkot, Jamnagar; southern Valsad, Navsari, Bharuch |
| Haryana | 8 large mills; 1.91% of sugar; over 8 million tonnes of cane on 1.3 lakh hectares | Rohtak, Ambala, Panipat, Sonipat, Karnal, Palwal, Hisar |
| Andhra Pradesh | 35 small mills; 5.8% of sugar | East and West Godavari, Krishna, Visakhapatnam, Chittoor |
| Telangana | Nizamabad, Medak | |
| Punjab | 13 mills; ninth in cane; 7 million tonnes on 0.92 lakh hectares | Amritsar, Jalandhar, Gurdaspur, Sangrur, Patiala, Rupnagar |
| Uttarakhand | Tenth in cane; 6.38 million tonnes | Dehradun, Haridwar, Udham Singh Nagar |
| Madhya Pradesh | 8 mills | Morena, Gwalior, Shivpuri |
| Rajasthan | 5 mills | Ganganagar, Udaipur, Chittaurgarh, Bundi |
- Gujarat: despite being an industrial State, it adds a useful share of cane. Its recovery of 10.31% is among the highest of the major States.
- Haryana also contributes heavily to the central food grain pool, and grows rice, jowar, bajra and maize beside cane.
- Andhra Pradesh: its black and alluvial soils suit cane, and the districts around the Krishna and Godavari grow it in bulk.
- Punjab’s output owes much to its strong farming culture.
- Uttarakhand is largely hilly, so its cane comes from the plains and foothills.
- Smaller producers: Keralam (Kerala), Odisha, West Bengal and Assam.
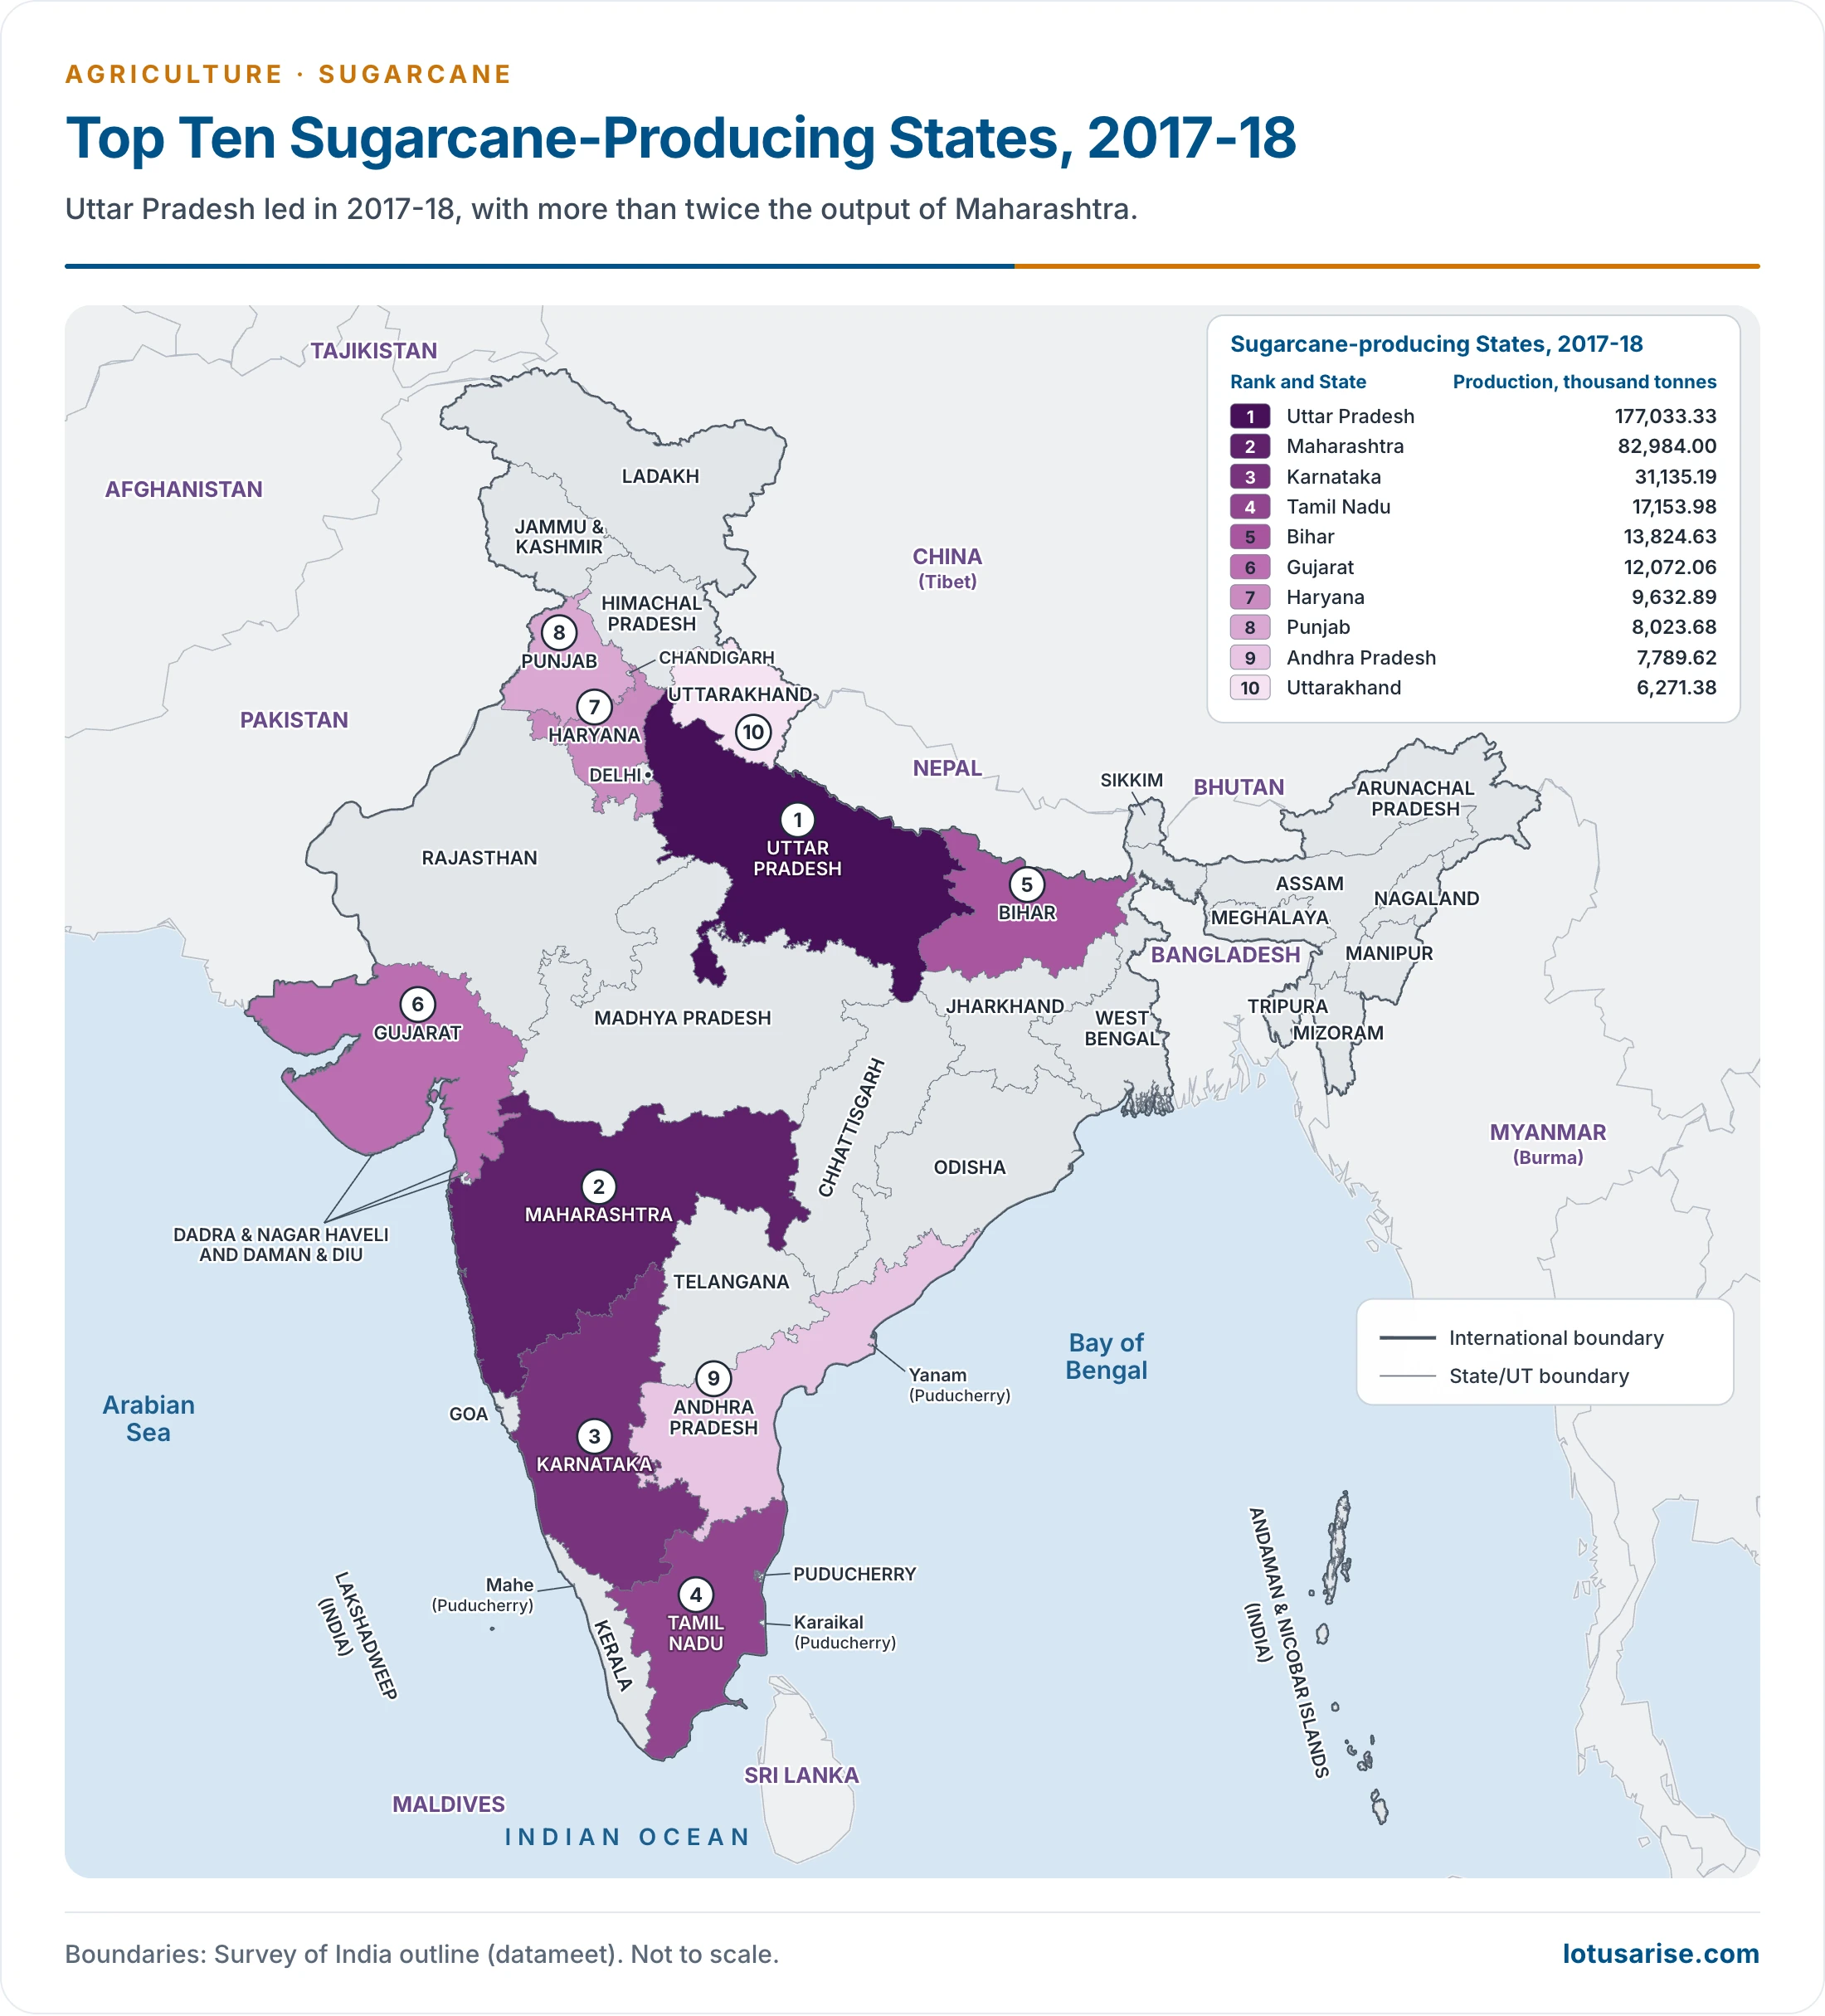
- This map shows 2017-18 output. In 2024-25, Uttar Pradesh made up 48.6% of national cane, about 221 million tonnes, within a total of 454.61 million tonnes.
North India and Peninsular India
- The shift south: better conditions drew the industry to the Peninsula. North India’s share of sugar fell from about 90% to 35–40% in older tables.
- Why the north first led:
- After aniline dyes ruined indigo, planters on the northern plain switched to cane, and British policy favoured it.
- Perennial rivers and canals supplied water all year, while the south relied on seasonal rivers and, for long, had little irrigation.
- In the south, cane had to compete for land with cotton, tobacco, groundnut and coconut.
- A dense home market lay close to the northern mills.
- Why the Peninsula gained:
- No frost and no loo, with a maritime influence that moderates temperature and keeps sugar content up.
- Canal and well irrigation spread widely, especially in the river valleys of Maharashtra and Karnataka.
- A longer season spreads fixed costs over more days of crushing, which lifts the earnings of each mill.
- Newer, larger units and grower-owned cooperatives brought in better plant.
- Mills near the western and eastern coasts are also closer to export ports.
| Factor | North India | Peninsular India |
|---|---|---|
| Climate | Sub-tropical, with frost and loo | Tropical, higher yield per unit area |
| Sucrose | Lower | Higher in tropical cane |
| Crushing season | About 4 months, November to February | 7–8 months, October to May or June |
| Cooperatives | Weaker management | Better managed |
| Mills | Many old | Most new, with modern machinery |
| Yield | Lower | Higher; Tamil Nadu 102 tonnes per hectare (2024-25) |
Problems of the Sugar Industry
- Low cane yield:
- India has a very large area under cane, yet low yields. Older comparisons put India at 64.5 tonnes per hectare, against 90 in Java and 121 in Hawaii.
- In 2012-13, India stood at 66.9, against Brazil 79.0, Colombia 101.3, Egypt 116.7 and Peru 125.5.
- The figure reached 83.4 tonnes per hectare in 2024-25.
- Effect: output falls short of capacity or potential, and mills run short of cane.
- Remedies: cane that yields more, ripens early and resists frost, with more sucrose, along with control of disease and pests.
- Short crushing season:
- Sugar is seasonal, with crushing normally for 4–7 months.
- Mills and workers then stay idle, which creates financial strain for the whole industry, since capital and permanent staff must be carried through the off-season.
- Fluctuating production:
- Cane competes with cotton, oilseeds, rice and other crops, so its land varies from year to year.
- Weather and disease add to this, as in 2025-26.
- Crop disease:
- Red rot and top borer, with waterlogging from excess rain, cut the 2025-26 crop well below early estimates.
- World market swings:
- The USDA forecast for 2025-26 placed Brazil first (44.7 million tonnes) and India second.
- World prices rose from USD 474 to USD 552 a tonne between 30 June and 20 August 2026, on an estimated global deficit of about 33 lakh tonnes for 2026-27.
- Low recovery:
- Average recovery was below 10% in older data, against 14–16% in Java, Hawaii and Australia.
- High cost of production:
- Costly cane, poor technology, uneconomic processes and heavy excise make Indian sugar among the world’s most costly to produce.
- Small, uneconomic mills:
- Most have a capacity of only 1,000–1,500 tonnes a day, and many are not viable.
- Old machinery:
- Machinery, particularly in Uttar Pradesh and Bihar, is 50–60 years old and needs renewal, but thin margins hold owners back.
- Competition from khandsari and gur:
- Both are older than the organised industry.
- Khandsari units pay no excise, so they can offer more for cane.
- Growers making gur themselves save on labour.
- About 60% of cane was used this way in older estimates, starving mills. By 2021-22, mills were crushing about 71%.
- Regional imbalance:
- Maharashtra and Uttar Pradesh hold over half of all mills and about 60% of output.
- Odisha, Jammu and Kashmir and the north-east have seen little growth.
- Low consumption per head:
- India’s older figure was 16.3 kg a year, against 48.8 kg in the USA, 53.6 kg in the UK, 57.1 kg in Australia and 78.2 kg in Cuba, with a world average of 21.1 kg.
- Today’s domestic use works out to about 20 kg a head. Thin demand has made surplus sugar hard to sell.
- FRP against SAP:
- The Centre declares the FRP, and States may declare their own State Advised Price.
- The SAP is generally higher, which raises the question of what is fair to both farmers and mills.
- Falling sugar prices (2010–2014):
- The FRP rose 50.9% from Rs 139.12 to Rs 210 per quintal between 2010-11 and 2013-14, according to the mills’ association.
- Sugar prices meanwhile fell 21%, from Rs 3,765 per quintal in January 2010 to Rs 2,962 in August 2014.
- Thin margins left companies heavily in debt.
- Minimum distance criterion:
- The 15 km radial rule was meant to assure each mill of cane.
- It creates local monopoly, which leads to exploitation of farmers, especially on small holdings, and it discourages innovation and investment.
- Unpaid dues to farmers:
- Arrears stayed stubbornly high for years. In Uttar Pradesh, farmers went unpaid for 2020 and received zero-price receipts for 2021.
- Recent position: about 99.5% of 2024-25 dues (Rs 1,02,209 crore of Rs 1,02,687 crore) had been paid by 20 April 2026, and 97% of 2025-26 dues by 20 August 2026.
- High export prices:
- Exporting surplus sugar is hard, because cane costs push up sugar costs.
- Indian cane prices were 70–80% above Brazil’s in older comparisons.
Measures to Resolve the Issues
Implementing the Rangarajan Recommendations
- Remove the distance norm, to raise competition, get farmers a better price and press mills to pay.
- Revenue sharing: States should not declare their own SAP, and pricing should rest on scientific and economic principles.
- Revenue split 70:30 between farmers and mills, including by-products.
- Payment in two instalments: the FRP as a floor at purchase, and the balance after the final price of sugar is settled.
- Duties: import and export duty not above 10%.
- Long-term agreements: States should encourage market-based contracts and phase out cane reservation areas, which tie growers in a zone to one mill.
- Exports and by-products: no outright bans on exports, and no limits on the sale of by-products.
Other Suggestions
- Price rationalisation: bring cane pricing in tune with global practice, so that surplus can be exported.
- Ethanol blending: diversion cuts the oil import bill and lifts mill profits.
- Brazil, the world’s largest cane grower, relies on ethanol as a major revenue source. Its mandatory blend rose from 27% to 30% on 1 August 2025.
- Research: fund varieties that yield more, ripen early, resist frost and hold more sucrose, and control pests and disease.
- Crushing season: stagger sowing and harvest in areas around each mill, to spread cane supply.
- Yield: intensive field research on cane production.
- Production cost: better use of by-products.
- Bagasse yields paper pulp, insulating board, plastic and carbon products.
- Molasses yields power alcohol, which in turn goes into DDT, acetate rayon, polythene, synthetic rubber, plastics and toiletries. It also gives edible molasses and cattle feed.
- Pressmud can give wax.
- Technology: upgrade old mills to raise efficiency.
- Export promotion: adjust policy to boost exports when output exceeds domestic use.
- Diversification: give mills incentives to make more alcohol, and deregulate its export.
- Bagasse use: about 96–97% of bagasse is still burnt for steam in mills, so sending more of it to paper mills or to power generation would raise its value.
- Multi-feedstock plants: a central scheme helps cooperative mills convert cane-only ethanol plants so that they can also run on grain, which keeps them busy in the off-season.
- Sustainable Sugarcane Initiative: practical options to raise the productivity of land, water and labour together, on the principle of “more with less”.
- It eases pressure on water, which matters greatly for a thirsty crop.





Your facts are wrong
Out of total cane produced only 13-14% is used for Khandsari and Jaggery according to Minstry of Food Processing
Per capita consumption of sugar in india is 19kg and not 3kg, thats why we have aa chronic problem of diabetes in India