

- Sea-level change is any rise or fall of mean sea level, the average height of the sea surface once tides, waves and seasonal swings are averaged out.
- What a coast records is relative sea level: the height of the sea against the land. It changes when the water moves, when the land moves, or both.
- A rise of the sea against the land is a positive change (transgression, submergence). A fall is a negative change (regression, emergence).
- Sea level is the grand base level of erosion, so every change in it is passed on to rivers, coasts, shelves and coral reefs.
Types and Causes of Sea-Level Change
Eustatic and relative change
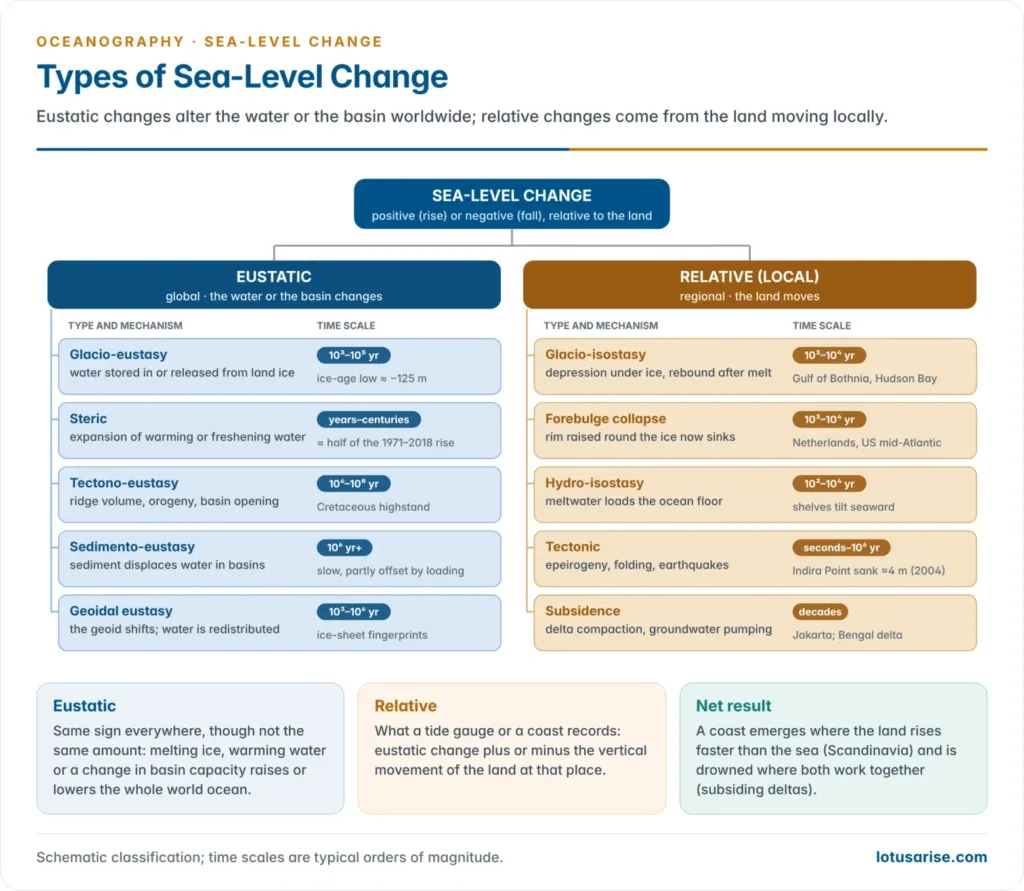
- Eustatic change is a worldwide change caused by a change in the volume of ocean water or in the capacity of the ocean basins. The term was introduced by Eduard Suess (1888).
- Relative (local) change comes from vertical movement of the land: isostatic, tectonic or by subsidence. It varies from coast to coast.
- The two often act together. Scandinavia’s coast is emerging although the world ocean is rising, because the land rises faster.
- Tectonic changes are slow (thousands to millions of years). Climatic changes are fast (centuries to millennia).
Eustatic changes
Glacio-eustasy
- Glacio-eustasy is the locking up and release of water in land ice. It is the main cause of sea-level change on time scales of thousands of years.
- In a glacial stage water evaporated from the ocean is stored as ice sheets, so sea level falls. In an interglacial the meltwater returns and sea level rises.
- Only ice on land counts. Floating sea ice and ice shelves already displace their own weight of water.
- Ice still on land: the Antarctic Ice Sheet holds about 58 m of sea-level equivalent, Greenland about 7.4 m, and mountain glaciers about 0.3 m.
- The added weight of meltwater would press the ocean floor down and offset part of any such rise.
Steric change
- Steric change is a change in the density of seawater with no change in its mass.
- Thermosteric: warm water expands. Halosteric: fresher water is less dense and stands higher.
- It also explains why mean sea level is not flat. The fresher Pacific stands a few tens of centimetres above the saltier Atlantic.
- Steric expansion is a major part of today’s rise, as the warming oceans absorb heat.
Tectono-eustasy and sedimento-eustasy
- Tectono-eustasy is a change in the capacity of the ocean basins. It works over millions of years.
- Ridge volume: fast spreading makes broad, hot, high mid-ocean ridges that displace water. Sea level stood perhaps 100–250 m higher in the mid-Cretaceous, when spreading was fast and ridges long.
- Orogeny: collision thickens and shortens continental crust, so the continents cover less area and the basins enlarge, lowering sea level.
- Basin opening and closing over the Wilson cycle changes the total area of the ocean.
- Sedimento-eustasy is the slow displacement of water by sediment filling the basins. It is offset by subsidence under the sediment’s load and removal at trenches.
Geoidal eustasy
- Nils-Axel Mörner (1976) showed that the sea surface follows the geoid, the Earth’s gravitational equipotential surface, which has hills and hollows of up to about 100 m.
- A shift in the geoid, from mass changes in the mantle or the loss of an ice sheet’s gravitational pull, redistributes water without changing its volume.
- When an ice sheet melts, sea level near it can even fall, while the far field receives more than the global average. This is the “fingerprint” of each ice sheet.
Isostatic and local changes
- Glacio-isostasy: ice sheets 1,000–3,000 m thick pressed the crust down by hundreds of metres. After the ice melted the land began a slow isostatic rebound that has not yet finished.
- The Gulf of Bothnia still rises by about 8–9 mm a year, and the Hudson Bay region by about 1 cm a year. Sweden’s High Coast has the world’s highest post-glacial shoreline, at about 286 m above sea level.
- Marine shells lie far above the sea on uplifted shores round James Bay and in the Champlain lowland, which the sea flooded as the Champlain Sea. The Baltic passed through lake and sea stages as rebound and the rising ocean competed.
- Peripheral bulges that rose round the ice margin are now collapsing. The Netherlands and the US mid-Atlantic coast are sinking, and their relative rise is faster than the global average.
- Hydro-isostasy: the weight of meltwater presses the ocean floor and shelves down.
- Tectonic movements:
- Epeirogenic warping and tilting lift one part of a coast and lower another.
- Co-seismic jumps can be sudden. In the 2004 Sumatra–Andaman earthquake parts of North Andaman rose while the Nicobars sank; land at Indira Point dropped by about 4 m.
- Subsidence by compaction and pumping: deltas sink as their muds compact, and faster where groundwater, oil and gas are extracted.
- Northern Jakarta has sunk by several metres, one reason Indonesia is moving its capital to Nusantara. Parts of the Ganga–Brahmaputra delta subside by several millimetres a year.
Short-term fluctuations
| Factor | Effect on local sea level |
|---|---|
| Atmospheric pressure | Rises about 1 cm for each 1 hPa fall in pressure (inverse barometer effect) |
| Wind set-up and storm surge | Onshore winds pile water on the coast; monsoon winds raise sea level along South Asian coasts in season |
| Currents | Fast currents slope the surface; the Gulf Stream stands about 1 m higher on its seaward side |
| Seasonal density and runoff | Warming and river floods raise the northern Bay of Bengal in the summer monsoon |
| ENSO | La Niña rains move water onto land and lower global mean sea level for a year or two |
Sea Level in the Quaternary
Glacial and interglacial cycles
- The Quaternary has seen dozens of glacial–interglacial cycles, once grouped as the Günz, Mindel, Riss and Würm glaciations in the Alps. Sea level swung 100–130 m with each Pleistocene glaciation.
- Raised coral terraces (Barbados, the Huon Peninsula of New Guinea) and oxygen-18 ratios in deep-sea cores record these swings.
- In the last interglacial, about 125,000 years ago, sea level stood about 5–10 m above today’s.
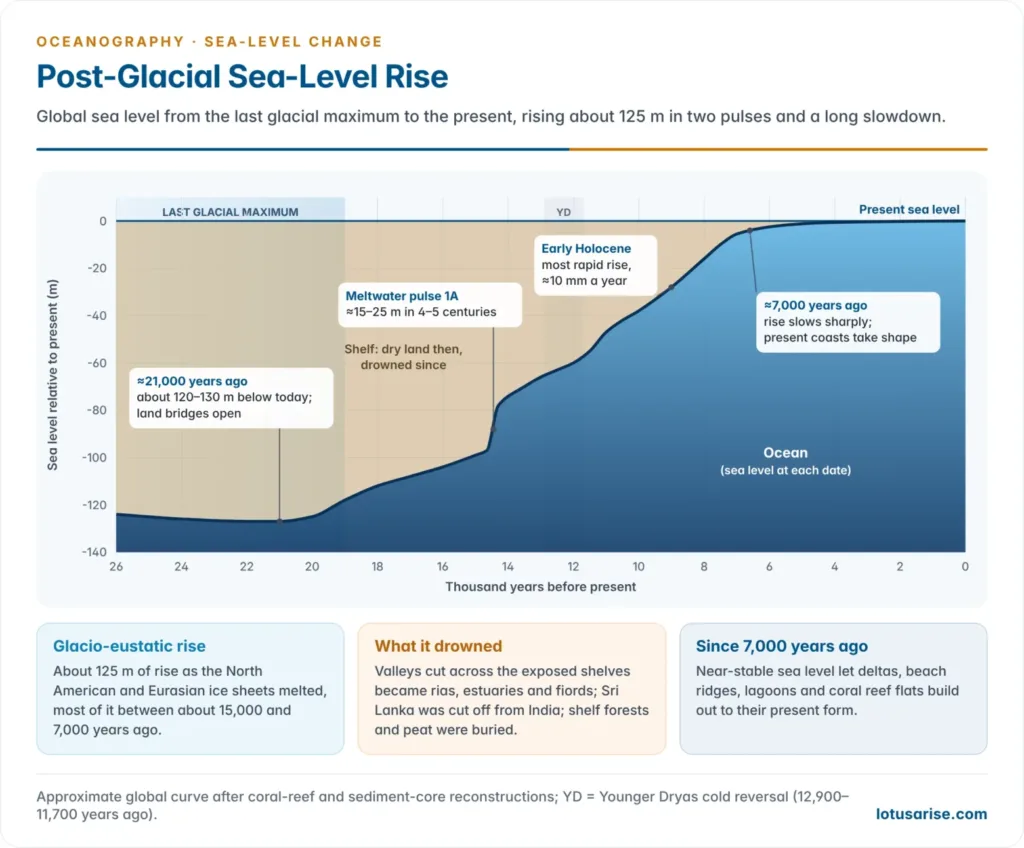
- At the last glacial maximum, about 21,000 years ago, sea level was about 120–130 m lower. Shelves were dry, land bridges joined Asia to North America and Sri Lanka to India, and rivers cut valleys across the exposed shelves.
- These swings are the basis of Reginald Aldworth Daly‘s glacial control theory of coral reefs.
The post-glacial (Flandrian) transgression
- Deglaciation raised sea level by about 125 m, most of it between about 15,000 and 7,000 years ago.
- Meltwater pulse 1A, about 14,600–14,300 years ago, added roughly 15–25 m in four or five centuries, at rates near 40 mm a year.
- The rise slowed sharply about 7,000 years ago. Sea level has been near its present level for the last 6,000 years, rising at well under 1 mm a year until the late nineteenth century.
- The transgression drowned the shelves and river mouths and fixed the outline of today’s coasts and deltas.
Evidence and landforms
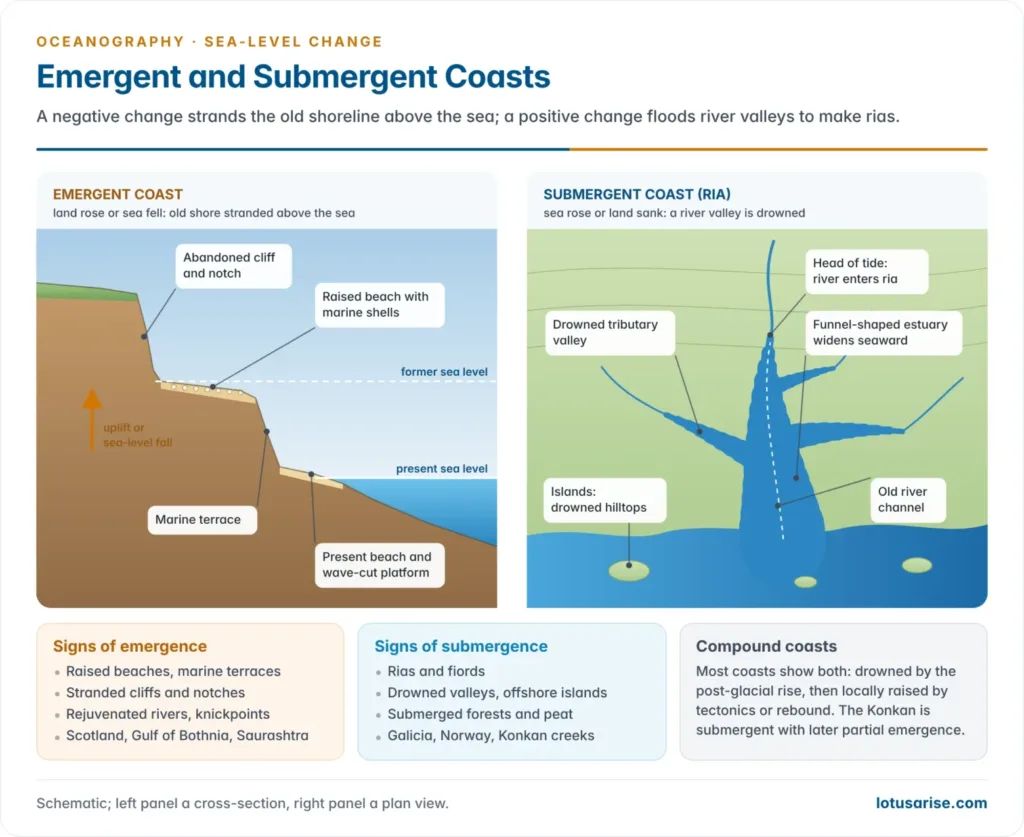
- Coasts are classified by this history. Douglas Wilson Johnson (1919) divided shorelines into those of emergence, submergence, neutral (deltas, alluvial plains, volcanoes, reefs, fault coasts) and compound.
- Francis Parker Shepard objected that almost every coast was drowned by the post-glacial rise, so pure shorelines of emergence are rare and most are compound.
| Shoreline of emergence (negative change) | Shoreline of submergence (positive change) |
|---|---|
| Raised beaches and marine terraces with shells | Rias: drowned river valleys, funnel-shaped estuaries |
| Abandoned cliffs, notches and wave-cut platforms above the sea | Fiords: drowned glacial troughs |
| Rejuvenated rivers, knickpoints, incised meanders, paired terraces | Drowned dendritic coasts with islands of old hilltops |
| Longer rivers across the newly exposed shelf | Submerged forests, peat and buried valleys offshore |
| Scotland, Gulf of Bothnia, Saurashtra coast | Galicia (Spain), Norway, the Dalmatian coast, the Konkan |
- Through base level the same changes reach far inland:
- A fall lengthens the erosion cycle and causes rejuvenation. Rivers incise into valley-in-valley forms with river terraces, as on the Red River of the USA, whose terraces match the glaciations. Exposed reefs die and shorelines advance seaward.
- A rise shortens it. Valley mouths are drowned into estuaries, channels fill to form buried valleys, and floodplains aggrade.
- India: the Konkan coast is a submergent coast with later partial emergence.
- Its drowned valleys stay tidal and navigable for 40–50 km inland. Excavations near Mumbai have found old land surfaces 5–10 m below sea level.
- The east coast is dominated by deltas and beach-ridge plains, which are neutral forms.
Present-Day Sea-Level Rise
The observed rise
- Tide gauges show that global mean sea level rose by 0.20 m between 1901 and 2018. That is faster than in any century of at least the last 3,000 years.
- The rate rose from 1.3 mm a year (1901–1971) to 1.9 mm (1971–2006) and 3.7 mm (2006–2018). Human influence has very likely been the main driver since at least 1971.
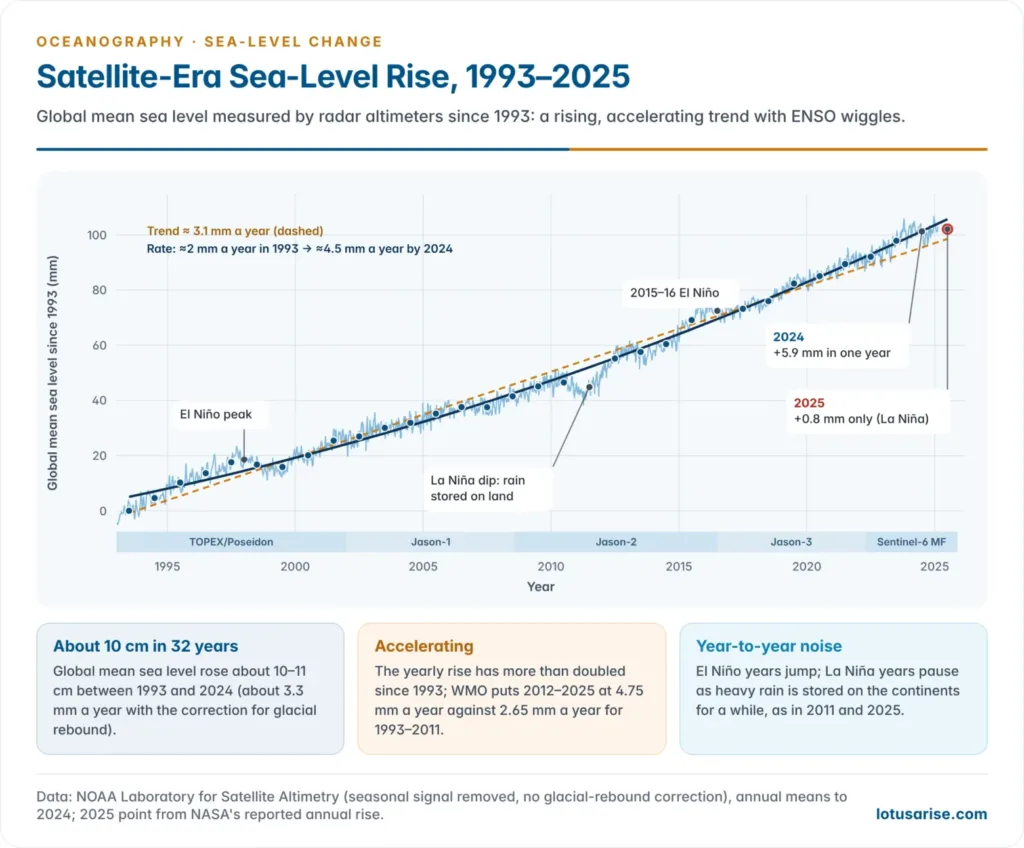
- Satellite altimetry (TOPEX/Poseidon, the Jason series and Sentinel-6 Michael Freilich) has measured the sea surface continuously since 1993.
- Sea level has risen by about 10–11 cm since 1993, at an average of about 3.3 mm a year. The annual rate has more than doubled, from about 2.1 mm in 1993 to about 4.5 mm by 2024.
- 2024 brought an unexpectedly large rise of 5.9 mm. In 2025 a strong La Niña moved rainwater onto land, and sea level rose by only about 0.8 mm, although the oceans gained record heat.
- Causes: over 1971–2018, thermal expansion explains about half of the rise, glaciers 22%, ice sheets 20% and changes in land-water storage 8%.
- Melt has now overtaken expansion, supplying about two-thirds of the satellite-era rise. Ice-sheet loss was about four times faster in 2010–2019 than in 1992–1999.
Projections
- Sea level will keep rising for centuries to millennia, because the deep ocean keeps warming and ice sheets keep responding.
| Scenario (IPCC AR6, 2021) | Likely rise by 2100 (relative to 1995–2014) |
|---|---|
| SSP1-1.9 (very low emissions) | 0.28–0.55 m |
| SSP1-2.6 (low) | 0.32–0.62 m |
| SSP2-4.5 (intermediate) | 0.44–0.76 m |
| SSP3-7.0 (high) | 0.55–0.90 m |
| SSP5-8.5 (very high) | 0.63–1.01 m |
- Ice-sheet instability cannot be ruled out. Under very high emissions a rise approaching 2 m by 2100 and 5 m by 2150 is possible, at low confidence.
- Over 2,000 years, sea level is committed to rise by 2–3 m if warming is held to 1.5 °C and by 2–6 m at 2 °C.
- By 2100, sea levels that now occur once a century will occur at least every year at more than half of all tide-gauge sites.
Sea-level rise and India
- The Indian Ocean rose about 1.7 mm a year over 1900–2000, and the north Indian Ocean about 3.3 mm a year over 1993–2015.
- Satellite trends for 1993–2020 lie between about 4.1 and 4.6 mm a year off India’s ports. Mumbai is the highest, then Paradip, Chennai, Mormugao, Visakhapatnam and Kochi.
- About 33.6% of the mainland coast eroded between 1990 and 2018, 26.9% accreted and 39.6% was stable (National Centre for Coastal Research).
- INCOIS maps coastal vulnerability for the whole mainland coast. Its maps combine sea-level trend, slope, elevation, shoreline change, tidal range and wave height, and its multi-hazard maps show land that 100-year storm surges and tsunamis could flood.
- The island territories are the most exposed:
- Lakshadweep coral islands rise only 1–2 m above the sea. A 2021 study projected the loss of about 70–80% of Chetlat’s shoreline and 60–70% of Amini’s, and found Agatti’s airstrip and much housing at risk.
- Sundarbans islands combine rising seas with delta subsidence and erosion. Lohachara vanished in the early 2000s, and Ghoramara has shrunk from about 7 km² in 1972 to about 3.6 km².
- In the Andaman and Nicobar Islands tectonic sinking adds to the eustatic rise. Their reefs and freshwater lenses are threatened by salt-water intrusion and bleaching.
- Cities and deltas at risk include Mumbai, Kolkata, Chennai, Surat, Kochi and the Mahanadi, Godavari and Krishna deltas.
Impacts and adaptation
- Impacts:
- Inundation of low land and coastal erosion.
- Salinisation of aquifers, soils and estuaries.
- Higher storm surges on top of a higher base.
- Loss of mangroves and wetlands where they cannot migrate inland.
- Displacement of coastal people.
- Atoll nations face loss of territory. Under the Falepili Union treaty (in force 2024), Australia offers residence to Tuvalu’s citizens. In July 2025 the International Court of Justice advised that states have binding obligations to limit warming.
- Adaptation strategies: protect (sea walls, dykes, beach nourishment), accommodate (raised plinths, salt-tolerant crops, early warning), retreat (planned relocation) and ecosystem-based defences (mangroves, reefs, dunes).
- India’s response:
- Planning rules: the Coastal Regulation Zone Notification of 2019 and integrated coastal zone management plans.
- Ecosystem defences: MISHTI (2023) for mangroves.
- Warning systems: INCOIS storm-surge and tsunami warnings.
- Shoreline work: shoreline mapping and coastal protection works by the states.
Previous Year Questions
2024With suitable examples explain the factors causing sea level changes.2018Describe the causes and consequences of sea level changes.2015Indian island territories are vulnerable to the sea level rise. Explain.2007Write short note: Eustatic changes of Sea-level





very helpful….thank you..
Thanx really appreciable
Thanks.