

- Agricultural productivity is the quantitative measure of the capacity of land in relation to crop yield. It signifies the total output from a given piece of land.
- Agricultural geography also uses it more widely, relating money value of output to land farmed, workers engaged or inputs applied. These give land, labour and capital productivity.
- India’s yields remain well below the best in the world, and they differ sharply across its own regions, which is why productivity is measured region by region.
Agricultural Productivity
The Concept
- Productivity is not simply the physical quality of land that gives greater yield per hectare. It is the product of both physical and technological factors.
- Per-hectare yield, the simplest measure, depends on:
- Physical factors: soil, climate and the agricultural ecology.
- Technological factors: the degree of mechanisation, and the use of modern inputs and technology.
- So productivity measures the capacity of the soil and farm ecology, and also the inputs and technology used on it.
- Regional differences arise partly from natural advantage (soil and climate) and partly from farming efficiency, shaped by the human setting.
- Productivity is at heart a relationship between output and the main inputs of land, labour and capital.
- The level of productivity shows how far economic, cultural, technical and organisational variables manage to draw output from the area’s natural resources.
- Why compute it:
- It shows the relative standing of the units of a region.
- It picks out weak areas of low productivity.
- It helps assess past development.
- It gives a sound base for future planning.
Agricultural Efficiency
- Agricultural efficiency is often used as a synonym of productivity, yet it is different.
- It is the input-output ratio in a farm operation.
- It reflects the impact of modern inputs and technology, and depends on how the soil and farm ecology respond to them.
- It measures the rise in output for a given rise in inputs, which raises profit. That extra profit is what efficiency captures.
- It depends on the physical quality of land, measured as Potential Productivity per Unit (PPU).
- An example. Lands A and B each cover 100 ha and each yield 150 kg of rice in a year. A needs an investment of ₹100, and B only ₹50.
- Agricultural productivity of A = agricultural productivity of B.
- Agricultural efficiency of A < agricultural efficiency of B.
| Feature | Agricultural productivity | Agricultural efficiency |
|---|---|---|
| Asks | How much is produced? | How much for what is put in? |
| Measure | Output per hectare or per worker | Input-output ratio |
| Depends on | Land, climate and technology together | Response to inputs, and skill in using them |
| Lands A and B | Equal | B higher |
Why India’s Yields Lag
- India’s crop yields are low by international standards, in spite of the rise since the Green Revolution.
- The chart compares FAO data for 2024. FAO counts rice as paddy, so its Indian figure runs above the official one, which counts milled rice.
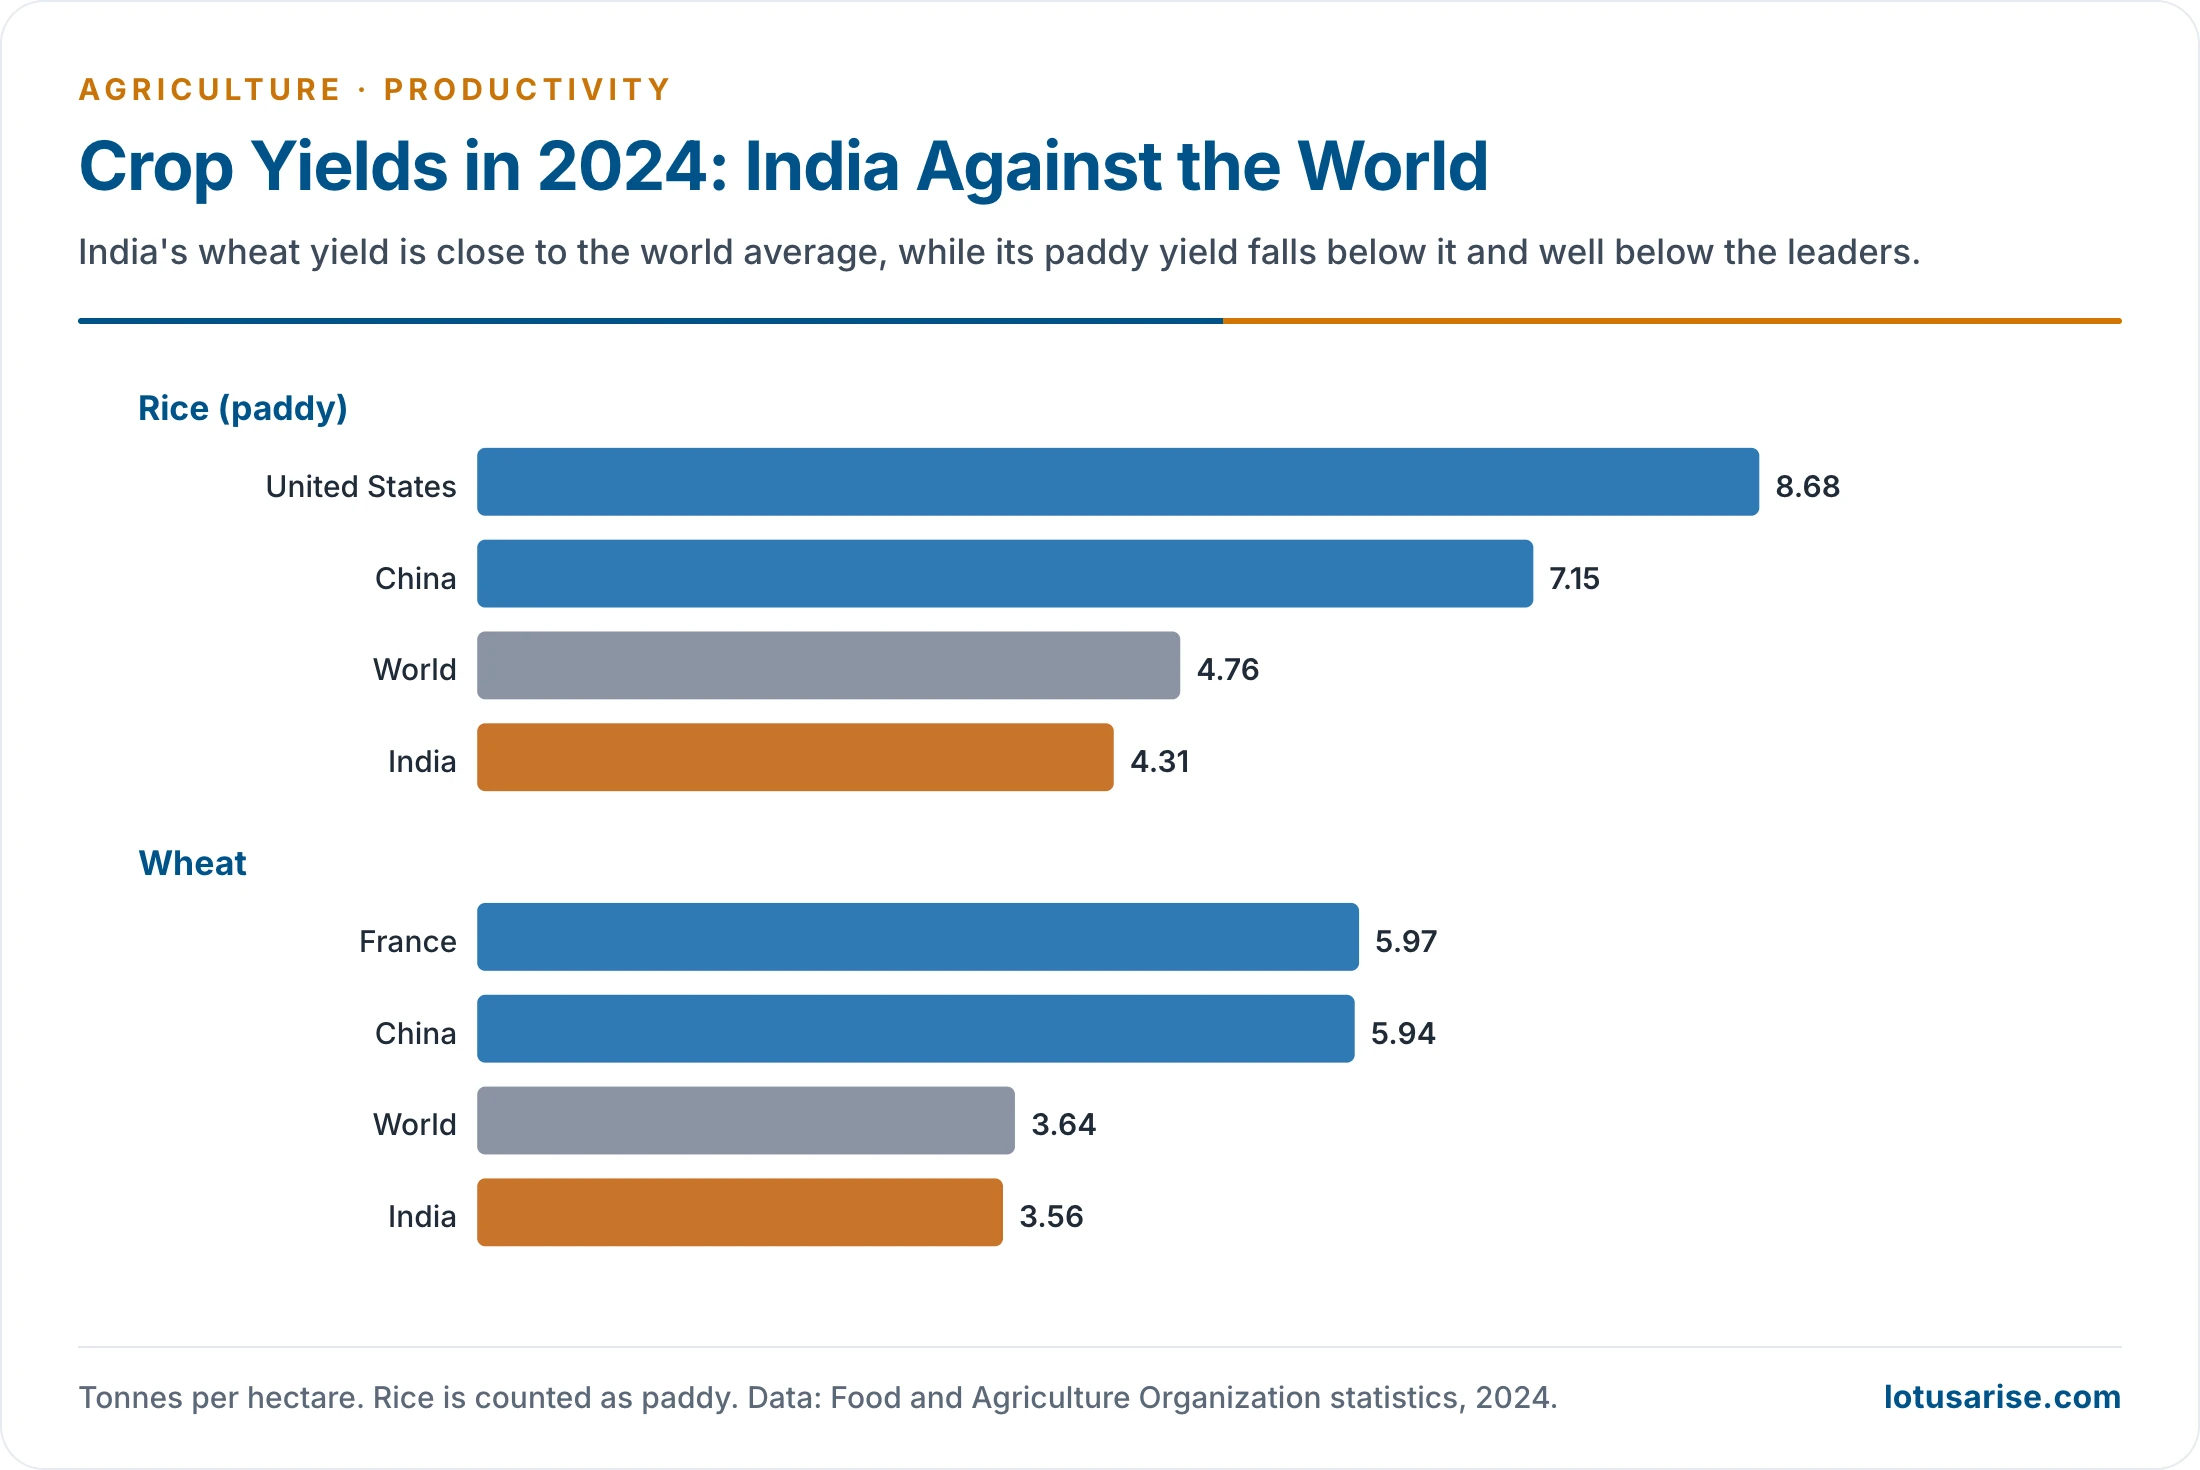
| Crop, official Indian yield (kg per hectare) | 2023–24 | 2024–25 |
|---|---|---|
| Rice | 2,882 | 2,929 |
| Wheat | 3,559 | 3,595 |
| All foodgrains | 2,515 | 2,578 (third advance estimate) |
- Main reasons, each treated under the determinants of agriculture:
- Rainfed land, which leaves large areas open to the failure of the monsoon.
- Small and fragmented holdings, which restrict the use of machines and the scale of investment.
- Uneven use of inputs, from unbalanced fertilizer use to limited supply of quality seed.
- Soil degradation and falling groundwater in the very tracts that lead on yield.
- Weak extension, credit and marketing in the low-yield eastern and central regions.
- The answer lies across regions: irrigation efficiency, diversification and soil health in the north-west, and better water control and technology in the east and on the plateaus.
Measuring Productivity
- No single method gives a flawless result, and the methods differ widely.
| Measure | Proponent | How it works | Chief drawback |
|---|---|---|---|
| Value of output per unit area | General | Money value per hectare | Data not always available |
| Output per unit of farm labour | General | Production per worker or man-hour | Same |
| Input-output ratio | Ali Mohammad Khusro (1964) | Surplus over paid-out cost | Weak in a subsistence economy |
| Grain equivalents | John Lossing Buck (1937), Egbert de Vries, Colin Clark and Margaret Haswell | All output as grain per head | Ignores who actually produces |
| Ranking coefficient | Maurice Kendall (1939), Stamp, Shafi | Average rank of yields | Ignores crop area |
| Weighted ranks and yield index | Sapre and Deshpande (1964), Shyam S. Bhatia (1967) | Weights by cropland share | Harvested area left out |
| Carrying capacity | Laurence Dudley Stamp (1958, 1967), Jasbir Singh | Calories as population supported | Caloric focus only |
| Productivity index | György Enyedi (1964), Shafi | Unit’s yield against the national | Needs full crop data |
| Crop yield and concentration ranks | Jasbir Singh (1976) | Average of the two ranks | Food crops only |
| Money value of output | Study of the Satluj-Ganga plains (1976) | Value of output against the region’s | Prices vary |
| Intensity and spread indices | V. R. Singh (1979) | Yield, grain equivalents, cropping system | Heavy computation |
| Net farm income | Jasbir Singh and others (1982–85) | Rupees per hectare or adult male unit | Needs farm surveys |
1. Per-Hectare Yield
- It is the most accepted method, but it does not give a correct assessment on its own.
- Crop choice matters as much as the land. Paddy in a sub-humid tract short of water may yield less than a millet suited to the moisture there, so the same land scores differently according to the crop.
2. Per Capita Output of Male Workers
- This is also imperfect, because it does not give the total value of farm output from a given piece of land.
- Each crop of coffee fetches a higher money value per male worker than paddy does, whatever the land is like.
- It is hard to apply, since inputs of family labour are poorly recorded.
3. Jasbir Singh’s Method
- Jasbir Singh measures productivity as the money value earned from farming per unit of labour employed.
- It is the sum of the product of each crop’s output and its market price, less the cost of production:
- Agricultural productivity = ∑(Pij × Mij) − Cop
- Here P is the quantity of output of the crop, M its market price, and Cop the cost of production.
- A later form, tried in Haryana, reads productivity from net farm income, in rupees, for each hectare cropped or each adult male unit of family labour.
- Two children aged 7–15, or 1.5 women aged 15–59, count as one adult male unit.
- Productive regions recorded the highest net income per hectare, and net income generally rose with farm size.
- An earlier approach of his treated carrying capacity per unit area as a percentage of the whole region’s, after deducting about 16.8 per cent of output for seed, feed and waste.
4. Kendall’s Ranking Coefficient Method
- Maurice Kendall (1939) worked out the method on the yields of ten leading crops in 48 English counties.
- Stamp (1960) used it to compare twenty countries on nine crops, and Mohammad Shafi (1960) to rate Uttar Pradesh on eight food crops.
- It rests on statistics and has wide acceptance across the world.
- It was applied to India in 1991 and again in 2005–06.
- Steps:
- Divide a region into units, and list the crops grown. For example, a region X may have 50 units and 8 crops: rice, wheat, cotton, oilseeds, sugarcane, pulses, jowar and bajra.
- Rank each unit by yield per hectare for each crop.
- Average each unit’s ranks by the formula below.

- For Punjab, the working runs as below.
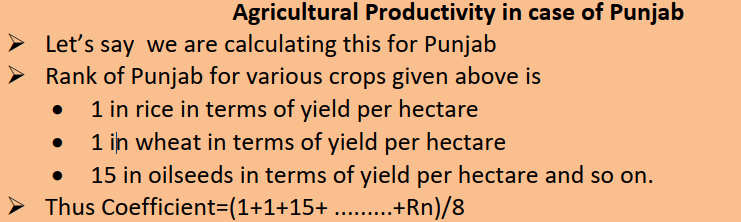
- The average ranked position of all units is arranged in an ascending or descending array, which is cut into five equal parts: very low, low, medium, high and very high productivity. Punjab is the example here, and the whole of India is treated the same way.
- The lower the index value, the greater the productivity or efficiency. A unit at the top of every list scores one.
- For India the method used 80 regions and 8 crops in 1991, and 120 regions and 11 crops in 2005–06.
Other Measures
- Grain equivalents. Buck argued that money values mean little where crops are grown for home use, as in a subsistence economy like China’s or India’s. So he converted all farm output into grain, counting all grains as equal.
- Egbert de Vries refined it into milled-rice equivalents per head, using local prices. Its weakness is that it divides by the total population, and not by the rural workers who actually produce.
- Clark and Haswell used wheat equivalents per person per year.
- Input-output. Khusro favoured output against paid-out cost, leaving out the imputed value of family labour. It suits comparison between farm-size classes.
- It has little validity in a subsistence economy, where foodgrains form 75–85 per cent of output, most of it is kept at home and the farmer supplies most inputs.
- Weighted ranks. Sapre and Deshpande weighted Kendall’s ranks by each crop’s share of cropland.
- Yield index. Shyam S. Bhatia assumed that hectare yields capture all physical and human factors, and that shares of cropland reflect land-use choices. He weighted crop yield indices by cropland share.
- Yield index of a crop = (yield in the unit ÷ yield in the region) × 100
- Carrying capacity. Stamp turned crops into calories, and read productivity from how many people the land can support.
- Enyedi’s index. It compares a unit’s share of a crop’s output with its share of cropped area, on the national scale. Shafi (1972, 1974) applied it to twelve food crops of India.
- Productivity index = (Y ÷ Yn) ÷ (T ÷ Tn)
- Y and Yn are the crop’s production in the unit and the nation, and T and Tn the total cropped areas.
- Yield and concentration ranks. Jasbir Singh (1976) averaged a crop’s yield rank and its concentration rank. A lower coefficient means higher productivity.
Regional Pattern in India
- The all-India index divides the country into 5 regions, as the table shows.
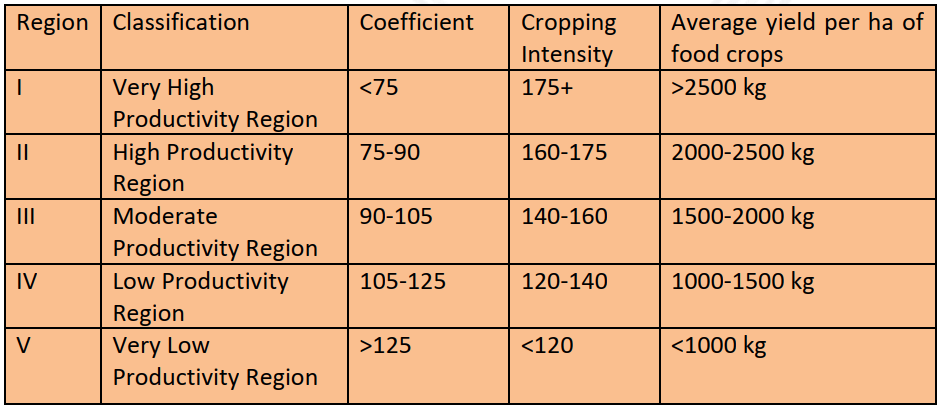
- Region I (very high): the Punjab-Haryana plains, Ganganagar and Hanumangarh districts, the Rohilkhand plains, the Ganga-Yamuna doab, Shahbad district, the lower Bengal delta, and the Krishna-Godavari and Kaveri deltas.
- Reasons match those behind high cropping intensity: assured irrigation, high-yielding seed, fertilizer and machinery.
- Region II (high): the river valleys of the Peninsula, the eastern coastal plains, the northern Bengal delta, the middle Gangetic plain, the Kaveri basin and the Malabar coast.
- Region III (moderate): the Chhattisgarh basin, and the river basins of Maharashtra and Karnataka, such as the Tungabhadra, Khandesh, Vidarbha and Rayalaseema, with the Gujarat plains, Baghelkhand and the Malwa plateau.
- Region IV (low): Jharkhand, eastern Rajasthan, the Purvanchal hills, and the rain-shadow plateaus of south India such as Telangana.
- Region V (very low): Jammu and Kashmir, the Himalayan region and western Rajasthan.
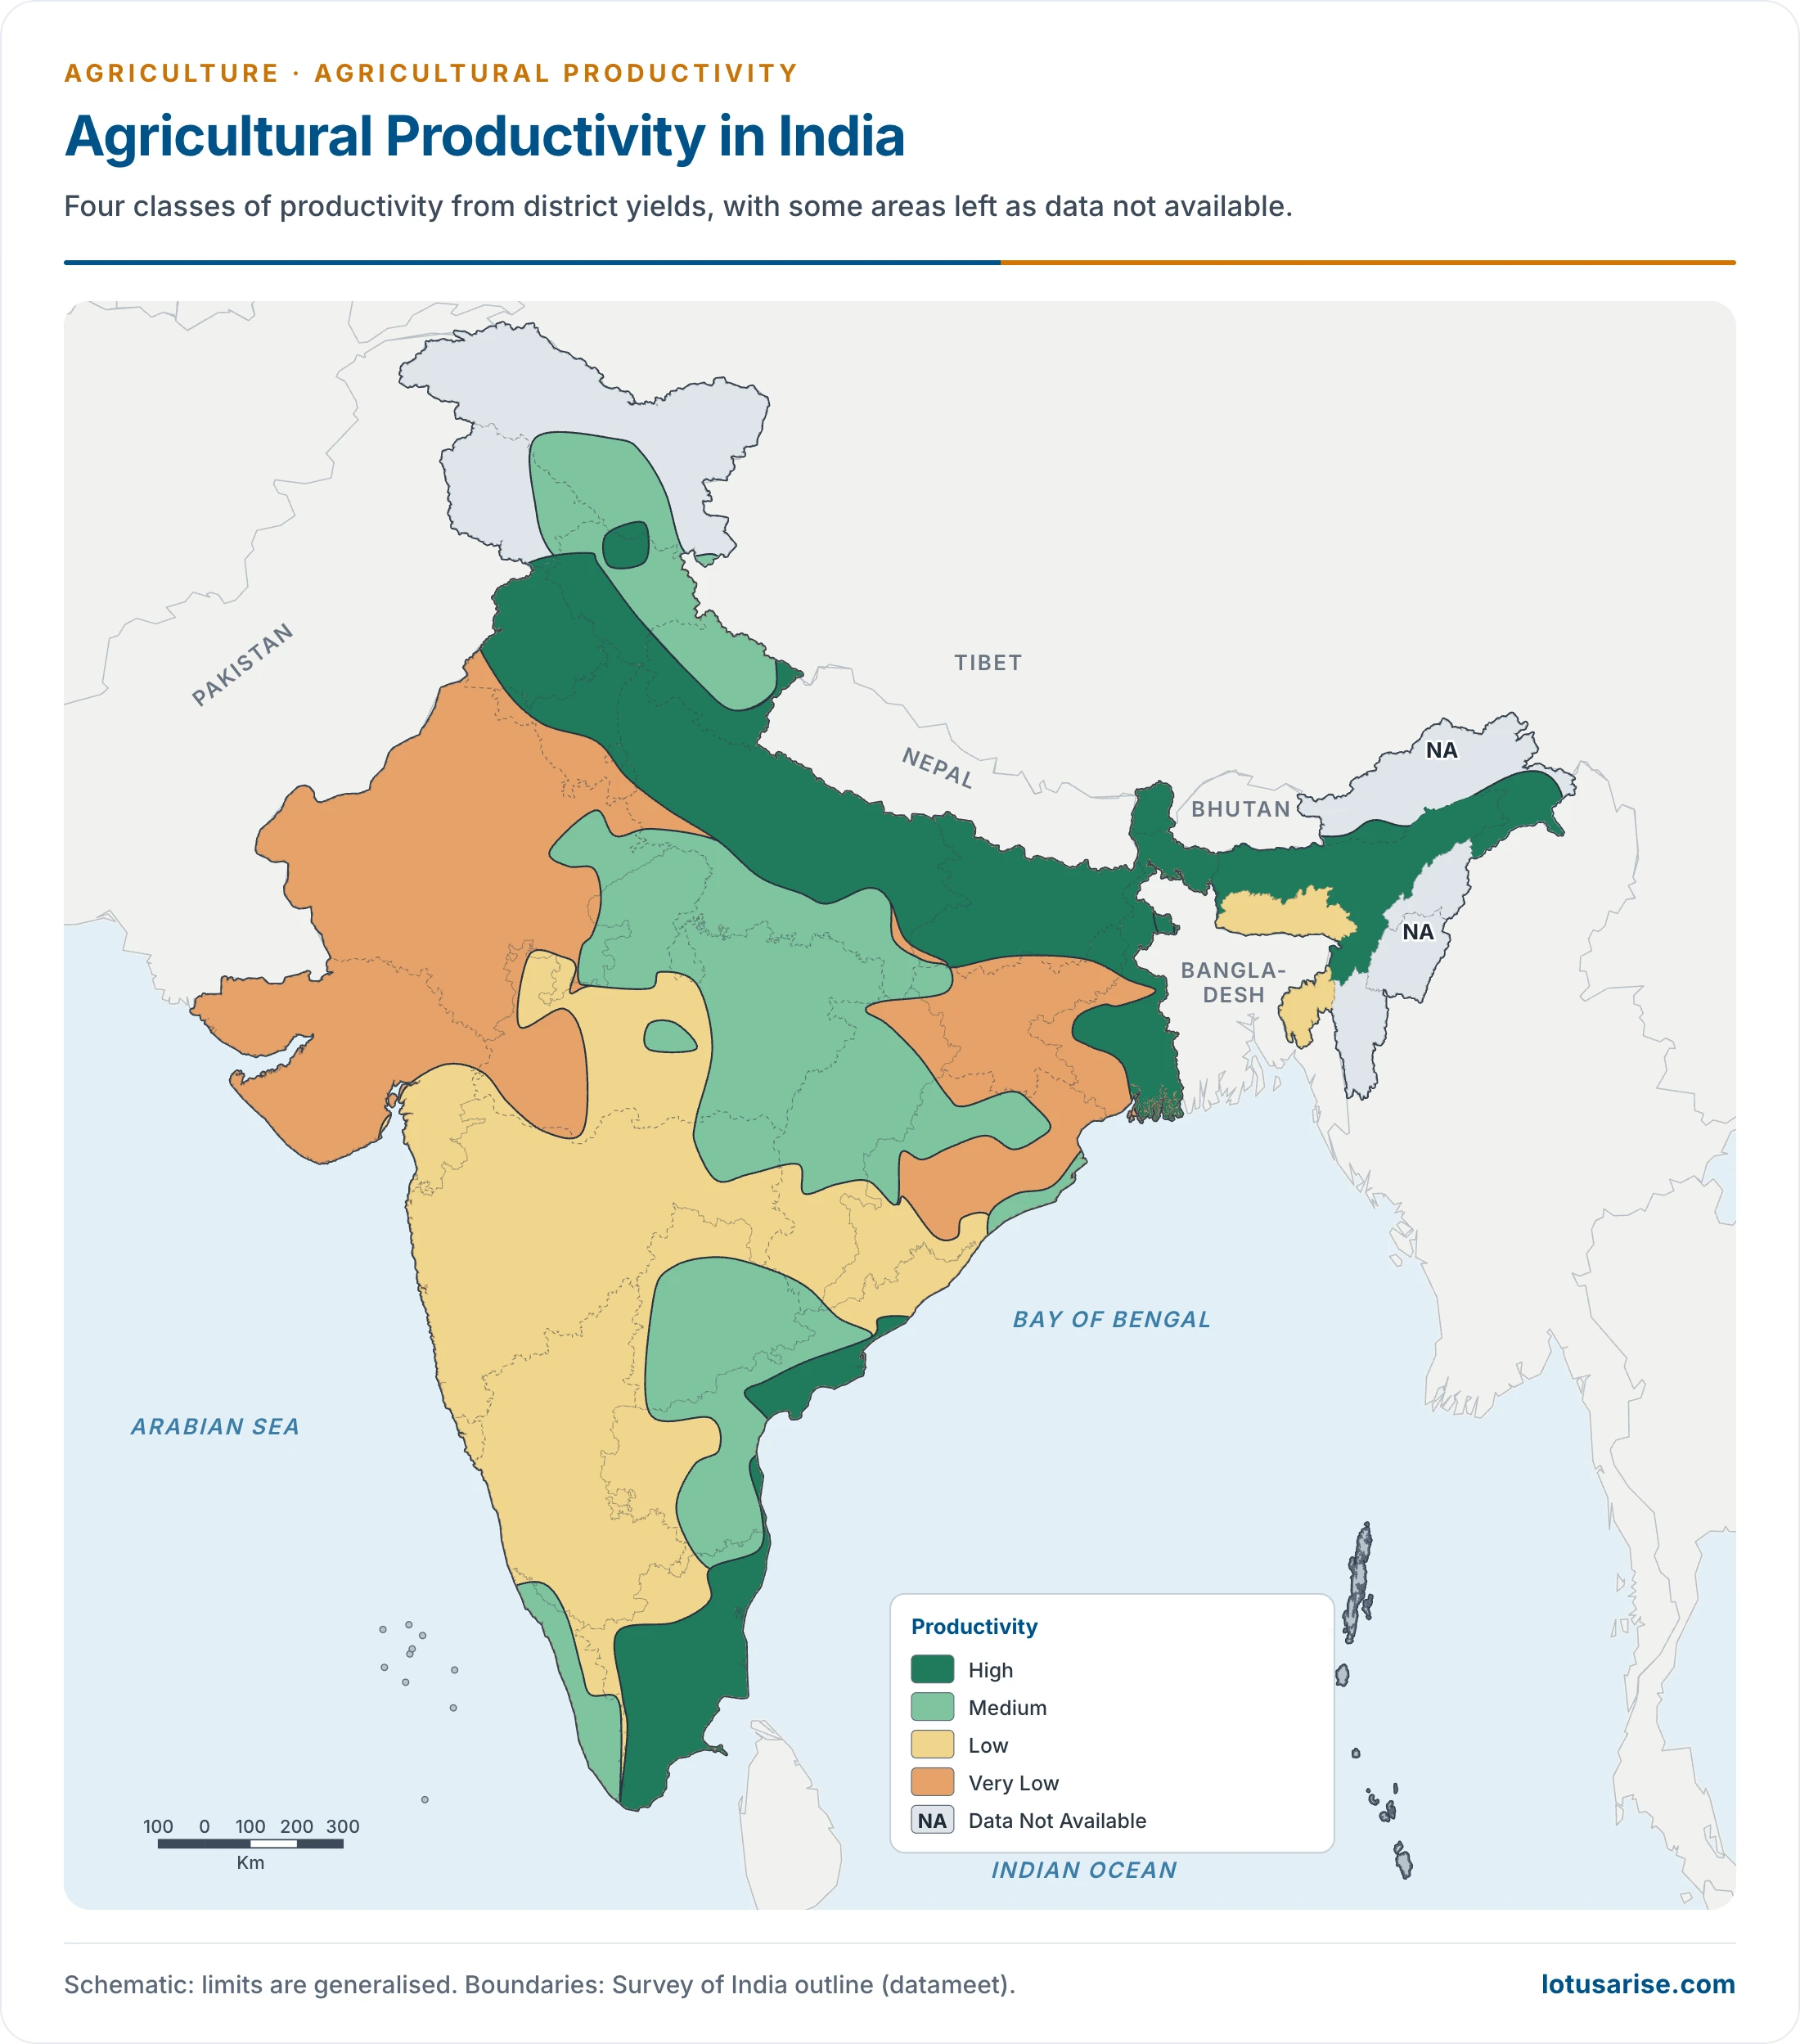
- This map groups India into four classes (high, medium, low and very low) from district yields of the 2003–06 period, and leaves some north-eastern hill areas as data not available. It therefore does not match the five regions line for line.
- High: the Satluj-Ganga plain, the Brahmaputra valley, and the Godavari, Krishna and Kaveri deltas. Farming here has moved towards agri-business in Punjab, Haryana and western Uttar Pradesh.
- Medium: scattered patches in Andhra Pradesh, Gujarat, Karnataka, Maharashtra, Madhya Pradesh, Odisha, Tamil Nadu and West Bengal, with limited irrigation and mostly subsistence farming.
- Low: dry and rainfed tracts of the plateau and hills, prone to drought or flood, with low-intensity farming.
- Very low: large parts of Rajasthan, Jharkhand and Chhattisgarh, because of high rainfall variability and rural poverty.
Previous Year Questions
2026Discuss agricultural productivity and techniques adopted for computing efficiency in the levels of agricultural productivity.2023Why does India lag behind many other countries in agricultural productivity? Suggest suitable measures to raise productivity across the regions in a sustainable manner.2015Distinguish between ‘agricultural productivity’ and ‘agricultural efficiency’, and bring out the disparity in regional distribution of agricultural efficiency.2013Define agricultural productivity. Mention the methods of its measurement and bring out the disparities in its regional distribution.1994Differentiate between agricultural efficiency and agricultural productivity and discuss the methods used in the determination of agricultural efficiency in India.1993Write short note: Measures of agricultural efficiency.1989Formulate a suitable agricultural land-use policy that will achieve the twin goals of optimum agricultural efficiency and crop productivity.





Provide PYQs solved booklet if any
Distinguish between Agricultural productivity and agricultural efficiency and bring out the disparities in regional distribution of agricultural efficiency?
do you have awnser for this ,if yes please share